The New Zealand dollar climbed toward 0.5650 against the US dollar on Friday, 16 October 2026, after Federal Reserve Chair Kevin Warsh declined to say whether the Fed will raise rates or hold at its 27-28 October meeting. The greenback softened during Asian trading, giving the Kiwi room to recover and reopening the near-term NZD/USD forecast debate.
The rebound comes two days after a sharp fall. On 14 October, hot US inflation data drove the pair to an 18-month low as traders rushed to price a faster Fed. On Thursday, the US producer price index then showed annual inflation of 6.3%, the fastest pace since 2022.
Across the Pacific, the Reserve Bank of New Zealand (RBNZ) faces its own late-October decision. Its chief economist has described the outcome as “wide open”.
Here is where the pair sits, which price levels would change the picture, and why two central bank meetings in the next fortnight are likely to set its direction.
Where is NZD/USD trading, and which levels decide the next move?
The Kiwi’s Friday gain pushed it to roughly 0.5650. Some quotes placed it nearer 0.5621-0.5631, a gap that reflects when each price was captured during the session rather than any disagreement about direction.
The bounce is real, but the chart puts a ceiling on it. FXStreet’s daily-chart analysis shows the pair recovering from oversold conditions while still trading below its 100-period moving average at 0.5780. That average tracks the pair’s mean price over the last 100 trading days, and it acts as resistance while price stays below it.
Bollinger Bands help frame the nearer levels. These are lines plotted above and below a moving average to show how far price is stretching from its recent norm.
| Level | Price | What it marks |
|---|---|---|
| Major resistance | 0.5780 | 100-period moving average |
| Initial resistance | 0.5710 | Upper Bollinger Band |
| Horizontal resistance | 0.5700 | Repeated cap on recent rebounds |
| Immediate support | 0.5635 | Middle Bollinger Band |
| Stronger support | 0.5560 | Lower Bollinger Band |
| Further support | 0.5550, then 0.5500 | Prior swing and round-number levels |
Momentum is soft. The Relative Strength Index (RSI), a gauge of buying and selling pressure scaled from 0 to 100, sits at 46.5. A reading below 50 points to weak upward momentum, and it suggests rallies are more likely to be corrective than the start of a new uptrend.
The conditional read: A break above 0.5710 would weaken the bearish structure. A sustained move below 0.5635 would expose 0.5560.
For you, the takeaway is that this is a bounce inside a downtrend. A run toward 0.5700 would be a test of resistance, not proof that the trend has turned.
Readers wanting the oil-to-yield chain behind the slide can read our full explainer on the NZD/USD six-week slide, which maps how Middle East escalation reaches the US dollar.
Fed hold or hike, RBNZ hold or hike: why are both central banks undecided?
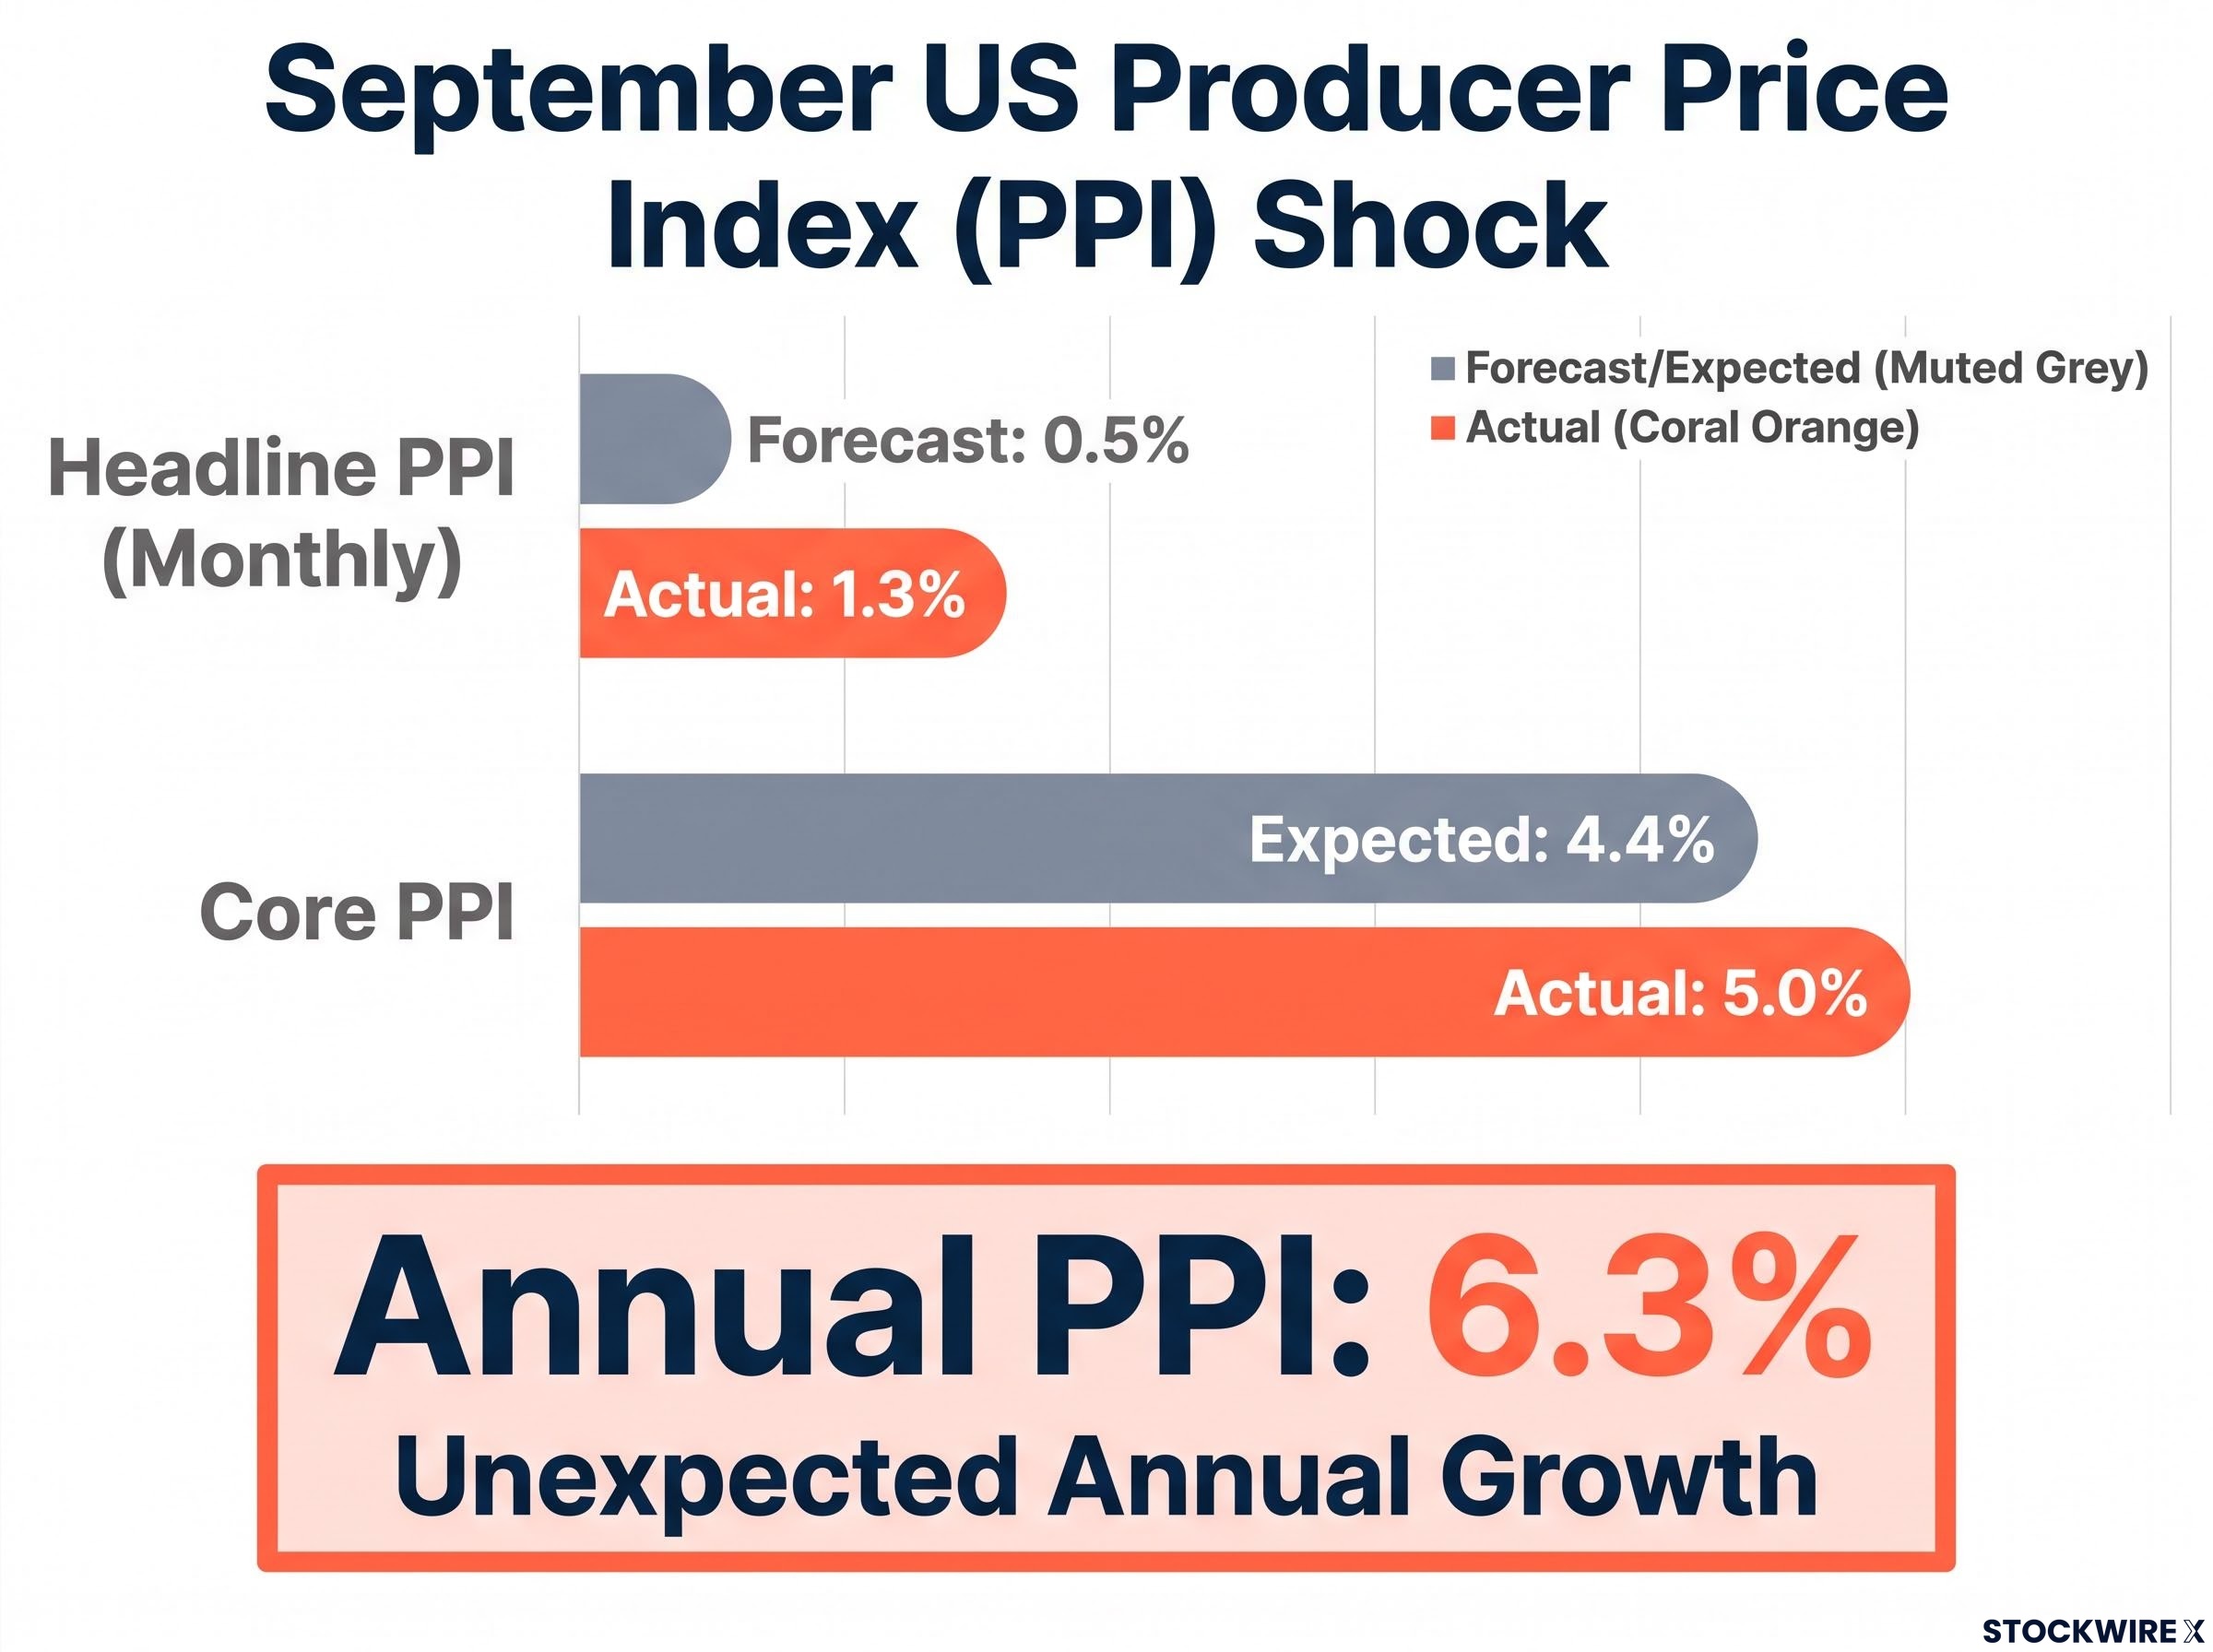
The number that rattled markets was bigger than anyone expected. US headline producer prices, which measure what businesses receive for their goods and services, jumped 1.3% in September against forecasts of 0.5%. Annual PPI accelerated to 6.3% from 5.6%, while core PPI rose 5.0% against 4.4% expected.
That is producer inflation, not consumer inflation. September CPI ran at 3.7%, with core CPI at 2.6%.
The Fed: hold now, hike later?
Warsh gave markets nothing to anchor to, saying he does not pre-judge rate decisions. FXStreet’s Speechtracker scored the speech 5.6/10 against a 6.1 baseline. San Francisco Fed President Mary Daly said further adjustment was “more likely than not” but saw no urgency, and Vice Chair for Supervision Michelle Bowman struck a similar tone.
CME FedWatch data showed October hike odds swing from about 22% to 40-47% on 14 October before settling near 27%. Odds of a hike by December sit at about 89.5%. Two camps have formed:
Fed funds futures pricing has proven unusually unstable, with October hike odds swinging from under 9% to 73% in six weeks as single speeches and data prints reset expectations.
- Hike in October: Eugenio Aleman of Raymond James argues broadening inflation raises the case for moving now.
- Hold in October: Citi expects a December increase, giving earlier tightening time to work.
The RBNZ: hike pressure versus lagged effects
The RBNZ’s Official Cash Rate (OCR), its benchmark lending rate, stands at 2.75% after two hikes in Q3. Money markets price roughly a 64% chance of a 25 basis point (0.25%) October hike.
Chief Economist Paul Conway called the decision “wide open”, while noting the OCR is still more likely to rise than fall. A weak Kiwi adds imported inflation, but earlier hikes have yet to fully flow through, with the bank targeting 1%-3% inflation. ASB, Westpac and BNZ have all forecast December moves. One report claims all five major banks now expect an October hike, though that has not been confirmed.
| Central bank | Current rate or stance | October pricing | Next likely move |
|---|---|---|---|
| Federal Reserve | Non-committal, data dependent | About 27% hike | Hike priced by December (89.5%) |
| RBNZ | OCR 2.75% | About 64% hike | Hike in October or December |
With both meetings priced close to a coin-flip, you should expect a surprise from either one to move the pair sharply rather than gradually.
What could push NZD/USD lower or higher from here?
The Kiwi rises when the RBNZ hikes, when China’s economy is strong, when dairy prices climb and when investors are willing to take risk. China is New Zealand’s largest trading partner and dairy is its main export, so prices at Global Dairy Trade auctions feed straight into the currency.
RBNZ guidance, Chinese activity data, dairy auctions and risk appetite are the four forces moving the Kiwi, and risk sentiment can override the other three when capital runs toward safe havens.
Risks to the downside
- A stronger US dollar if the Fed reprices higher; the rate gap drove the 14 October fall.
- Weaker Chinese demand for New Zealand exports.
- Soft Global Dairy Trade auction results.
- Risk-off markets driven by geopolitics or falling equities.
- Further upside US data surprises, or soft New Zealand data.
The RBNZ channel already bit once. October hike expectations slid from about 80% in late September to about 58% in early October, dragging the pair lower before any decision.
The case for a rebound
- Oversold conditions could slow the selling.
- A Fed hold after hike pricing could weaken the US dollar.
- An RBNZ hike or hawkish guidance could force short sellers to cover.
- Holding above 0.5635 keeps 0.5710 in reach.
Guidance carries weight. In October 2023, the RBNZ’s signal of higher-for-longer rates sparked a roughly 1.5% Kiwi rally against the US dollar. Treat the two meetings as the events that will validate or break the chart levels, not the chart alone.
What the Fed and RBNZ decisions change for the Kiwi, and what they do not
The near-term bias remains bearish, with real rebound risk. Support at 0.5635 and resistance between 0.5710 and 0.5780 frame the range, and a single bounce does not change that structure.
What can change it is how the Fed responds to persistent inflation, how the RBNZ weighs lagged tightening, and whether China and dairy data support the currency. The Fed meeting on 27-28 October and the RBNZ’s decision are the next tests.
This article is for informational purposes only and should not be considered financial advice. Investors should conduct their own research and consult with financial professionals before making investment decisions. Past performance does not guarantee future results, and forecasts are subject to market conditions and various risk factors.