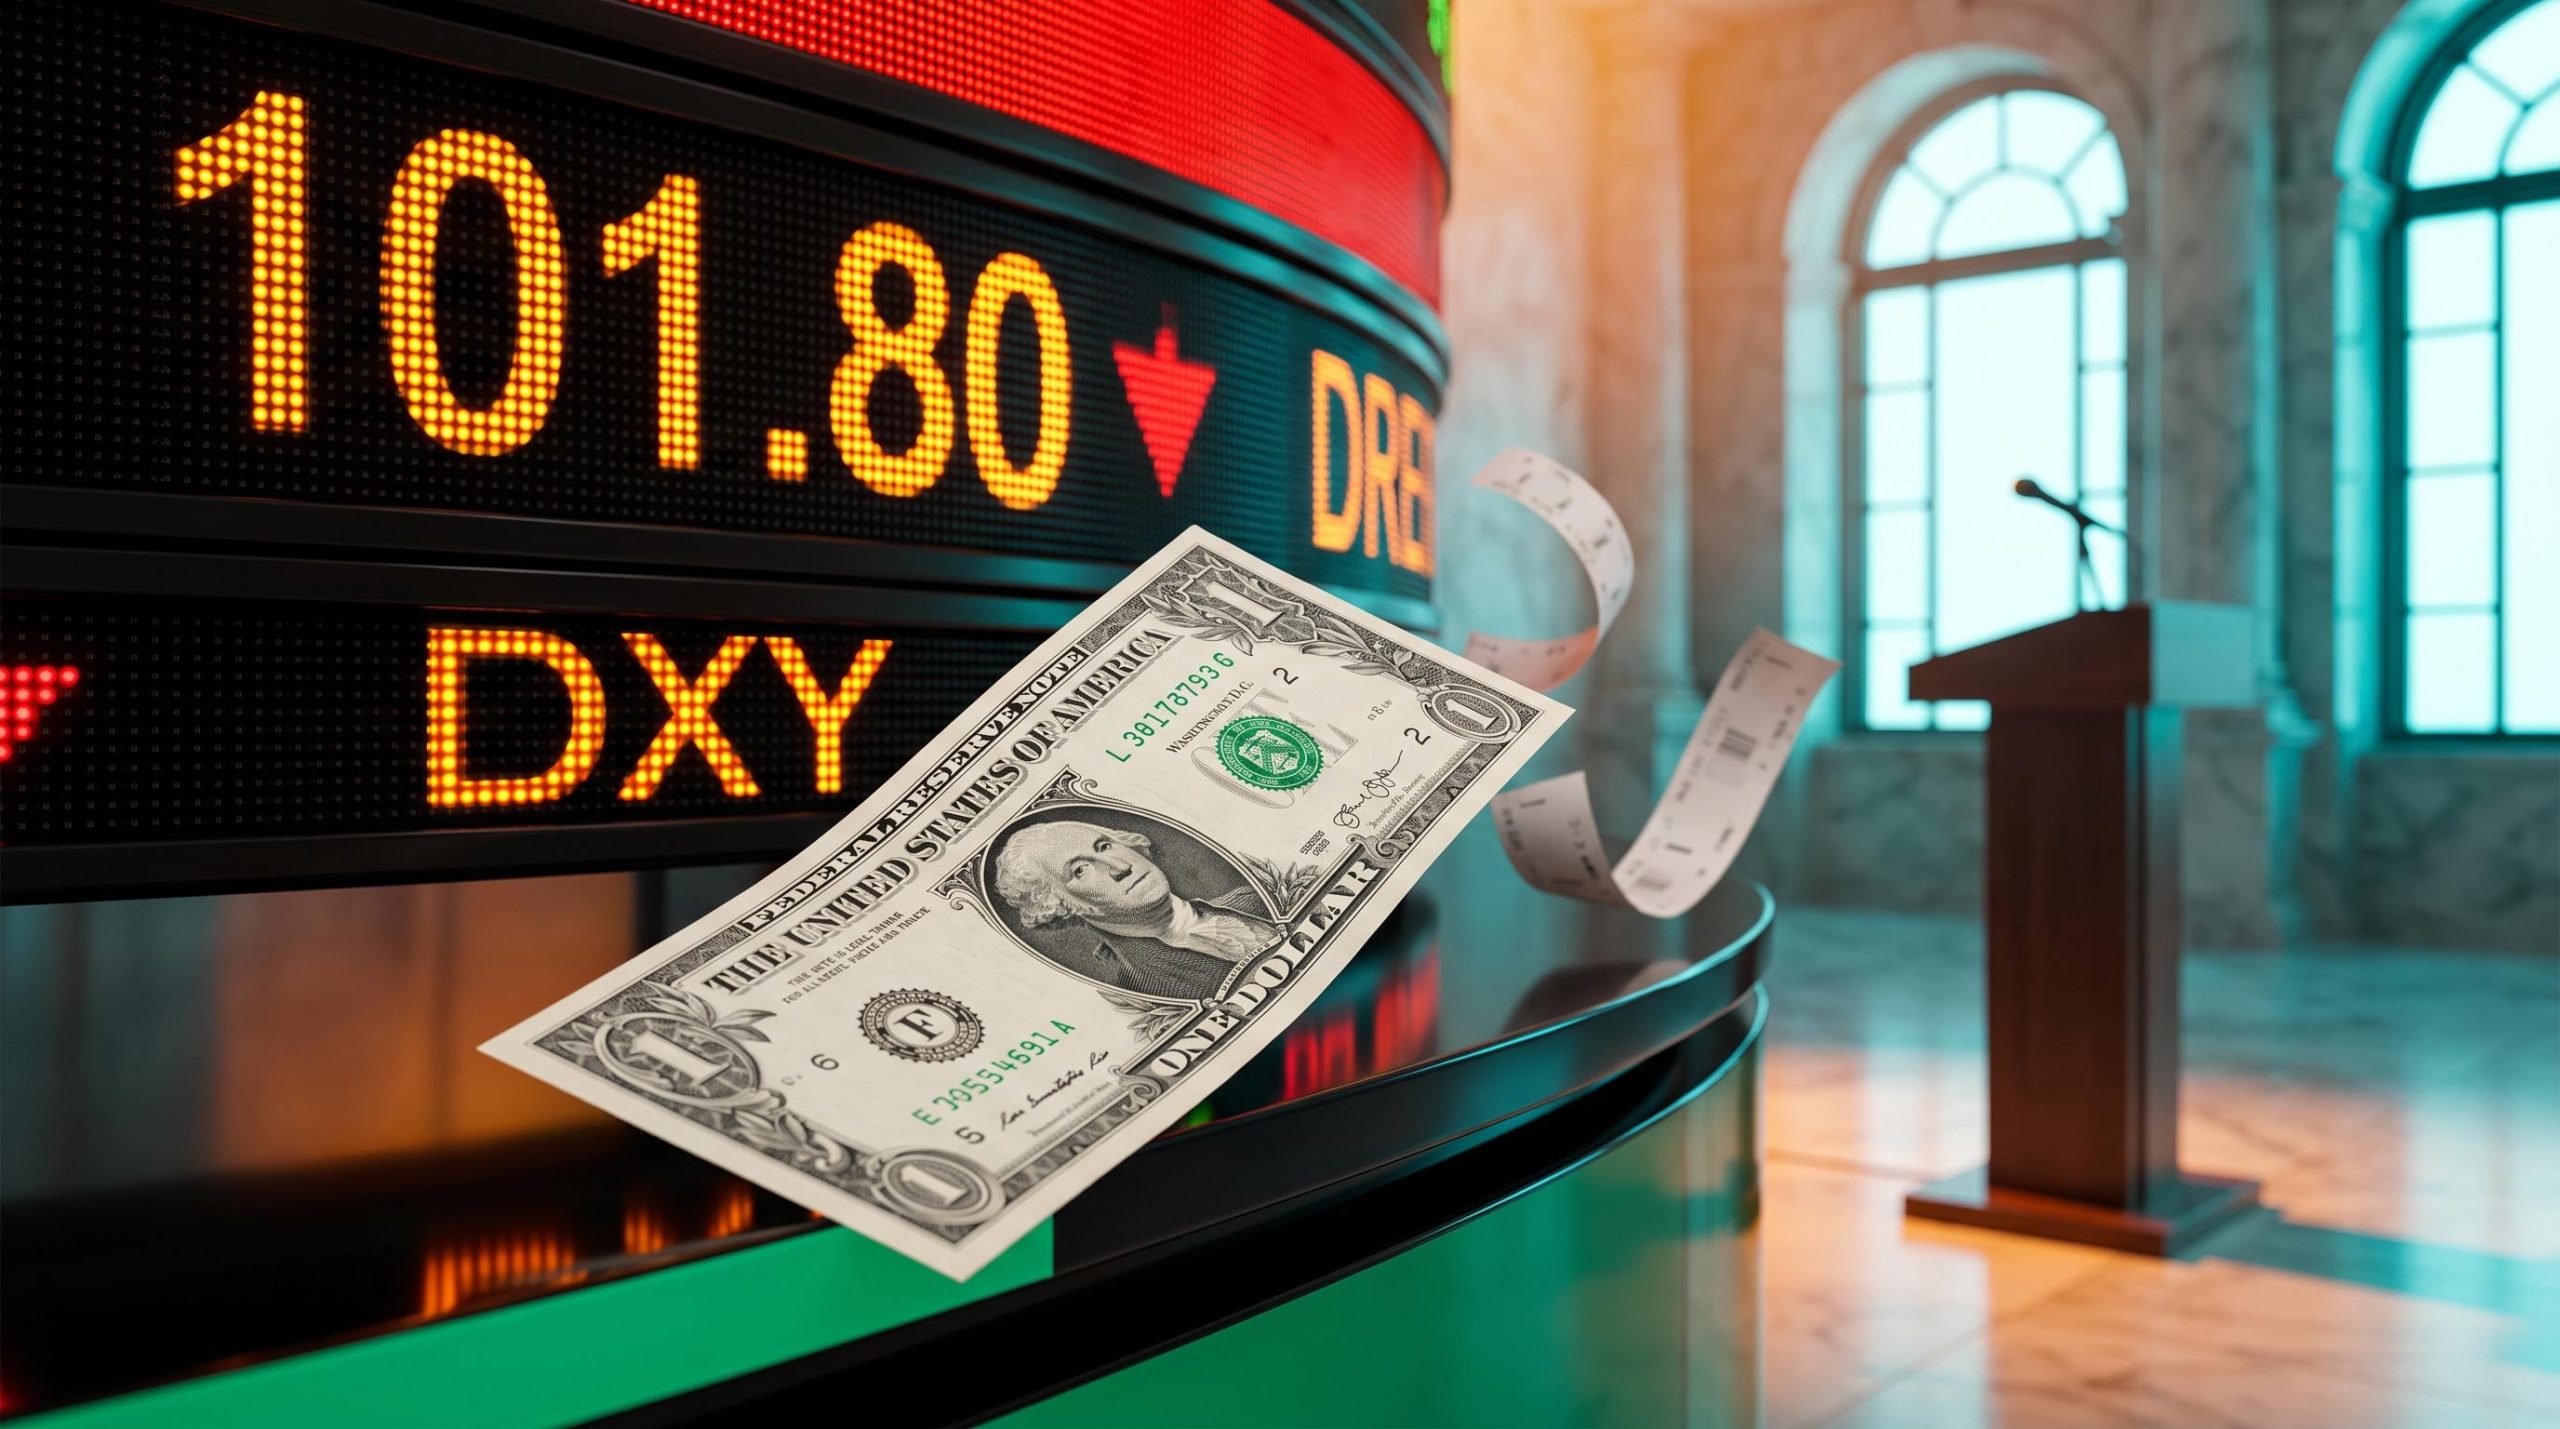
The Dollar Index slipped about 0.15% to roughly 101.80 on Friday, 16 October 2026, its lowest level in around 10 days, after Fed Chair Kevin Warsh declined to signal an October rate hike. Warsh did not say anything dovish. The market sold the dollar because he said nothing firm at all.
That silence matters because the US data is pulling in two directions. Headline inflation is reported at 3.7%, while September payrolls reportedly rose by just 29,000 (neither figure has been independently confirmed). That combination leaves both the October and December Federal Open Market Committee (FOMC) decisions genuinely open. The FOMC is the Federal Reserve committee that sets US interest rates.
Here is what a data-dependent Fed means for the dollar’s near-term path, and the specific chart levels that would tell you whether this dip is a pause or the start of something larger.
Why did the dollar slip when Warsh and Hammack both sounded worried about inflation?
On paper, Friday’s Fed commentary leaned hawkish, meaning it favoured higher rates to fight inflation. In a conversation with International Monetary Fund (IMF) head Kristalina Georgieva, Warsh put price stability first.
Cleveland Fed President Beth Hammack went further. Her concerns covered stubborn inflation, climbing input costs and the danger of an ingrained inflation mindset, and she indicated she would be open to tighter policy should inflation expectations rise.
Yet the dollar fell. The explanation sits in what Warsh would not say.
Warsh on the coming meetings The Fed Chair said he will make his judgments at the October and December meetings as they arrive, without deciding the outcome in advance.
FXStreet’s Speechtracker, which scores how hawkish a speech sounds, captured the gap between expectation and delivery.
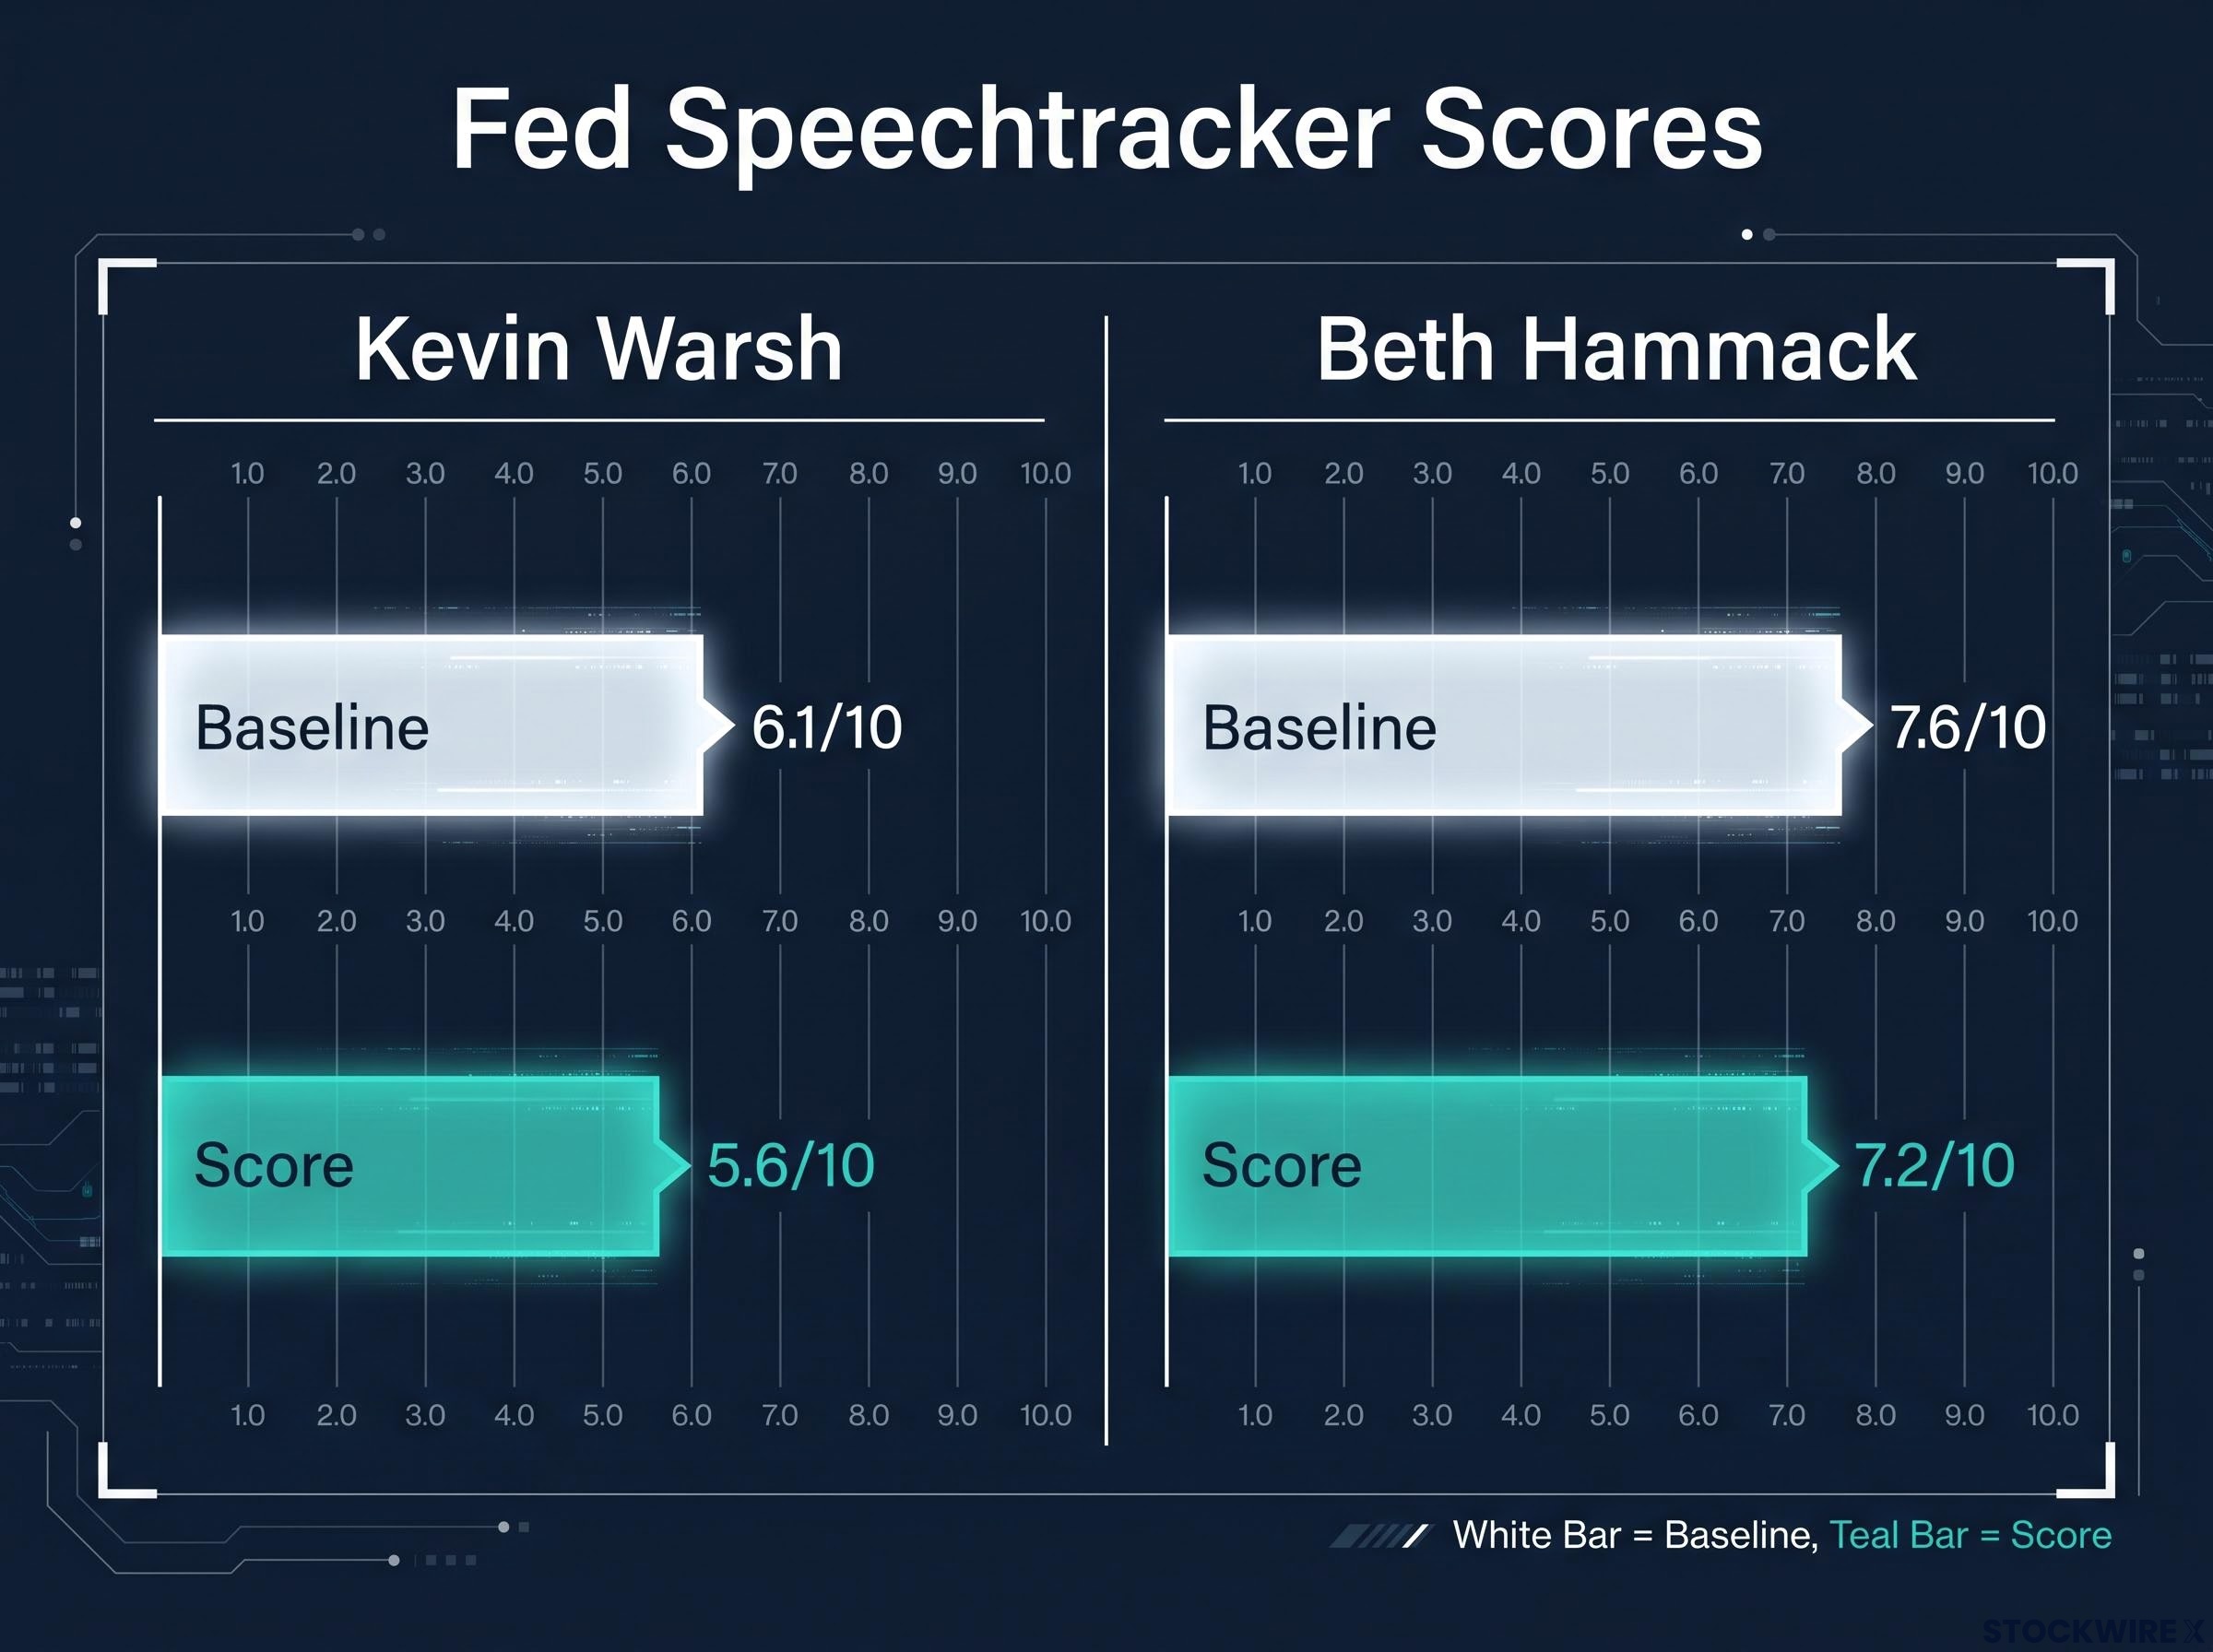
| Official | Speechtracker score | Baseline | Key message |
|---|---|---|---|
| Kevin Warsh | 5.6/10 | 6.1/10 | Price stability first; no prejudging October or December |
| Beth Hammack | 7.2/10 | 7.6/10 average | Persistent inflation; open to firmer policy |
Both officials scored below their usual readings. The FXS Fed Sentiment Index held at 127.51 after Warsh and was reported at 127.92 following Hammack, still well above the neutral 100, so the Fed’s overall tone remains hawkish.
Currency markets moved anyway. AUD/USD pushed toward 0.6950, USD/JPY slipped below 158.00 and gold bounced toward $4,200. Over the week, the dollar was down about 0.36% against the euro.
The read for you: a Fed chair’s refusal to pre-commit is market-moving in itself. Traders had positioned for a hawkish nudge, and when it failed to arrive they unwound part of that bet. This was a positioning adjustment, not a policy pivot.
Warsh has scrapped forward guidance entirely, which concentrates repricing risk into single speeches and data releases rather than spreading it gradually, and explains why silence alone moved the dollar.
What does a data-dependent Fed mean for October, December and the dollar?
The Fed is caught between sticky inflation and a weakening jobs market, and Warsh has chosen to let the numbers decide.
| Measure | Latest reading (unverified) | Why it matters for the Fed |
|---|---|---|
| Fed target range | 3.75%-4.00% | Already lifted in September |
| September headline CPI | 3.7% y/y | Well above the 2% target |
| September core CPI | 2.6% y/y | Underlying pressure is milder |
| September payrolls | +29,000 | Weak hiring argues for patience |
| Unemployment | 4.2% | Labour market softening |
Futures pricing has swung with each release. CME FedWatch reportedly showed about 41.5% odds of an October hike and 88%-90% for December as of 14 October. These figures reflect market pricing, not Fed forecasts.
Bank views, as reported but not confirmed, split along the same line. Goldman Sachs reportedly moved its expected hike to December, OCBC expects an October pause followed by a December hike, and UBS reportedly saw an election-eve move as politically untenable.
Two readings of Warsh now compete:
- Hawkish: He stressed price stability, did not rule out October, and a December hike is heavily priced, so the dip may be temporary.
- Less hawkish: Refusing to prejudge October signals no rush, weak payrolls argue for waiting, and doubts over December could narrow the dollar’s yield advantage.
How Fed tools move the dollar
The dollar responds to where traders expect US rates to go relative to other countries. When the Fed raises rates while inflation sits above its 2% target, US yields tend to rise and the dollar usually strengthens; cuts tend to weigh on it.
The dollar tracks expected rate differentials against other economies, which is why a hike that is already fully priced can leave the currency flat or even lower once the decision lands.
Quantitative easing (QE), where the Fed creates money to buy bonds, usually weakens the dollar. Quantitative tightening (QT), the reverse, usually supports it.
For you, that means the next CPI, PCE and jobs releases matter more than any speech. Each one shifts expected rates, and expected rates move the currency.
Which Dollar Index levels matter next?
On the daily chart, the index sits near 101.83, just above its 20-day exponential moving average (EMA) at 101.63. An EMA is an average of recent prices that gives more weight to the latest days, and here it acts as the main support.
The 14-day Relative Strength Index (RSI), a momentum gauge running from 0 to 100, reads 56.79. That is neutral to positive: upside momentum is cooling, not reversing.
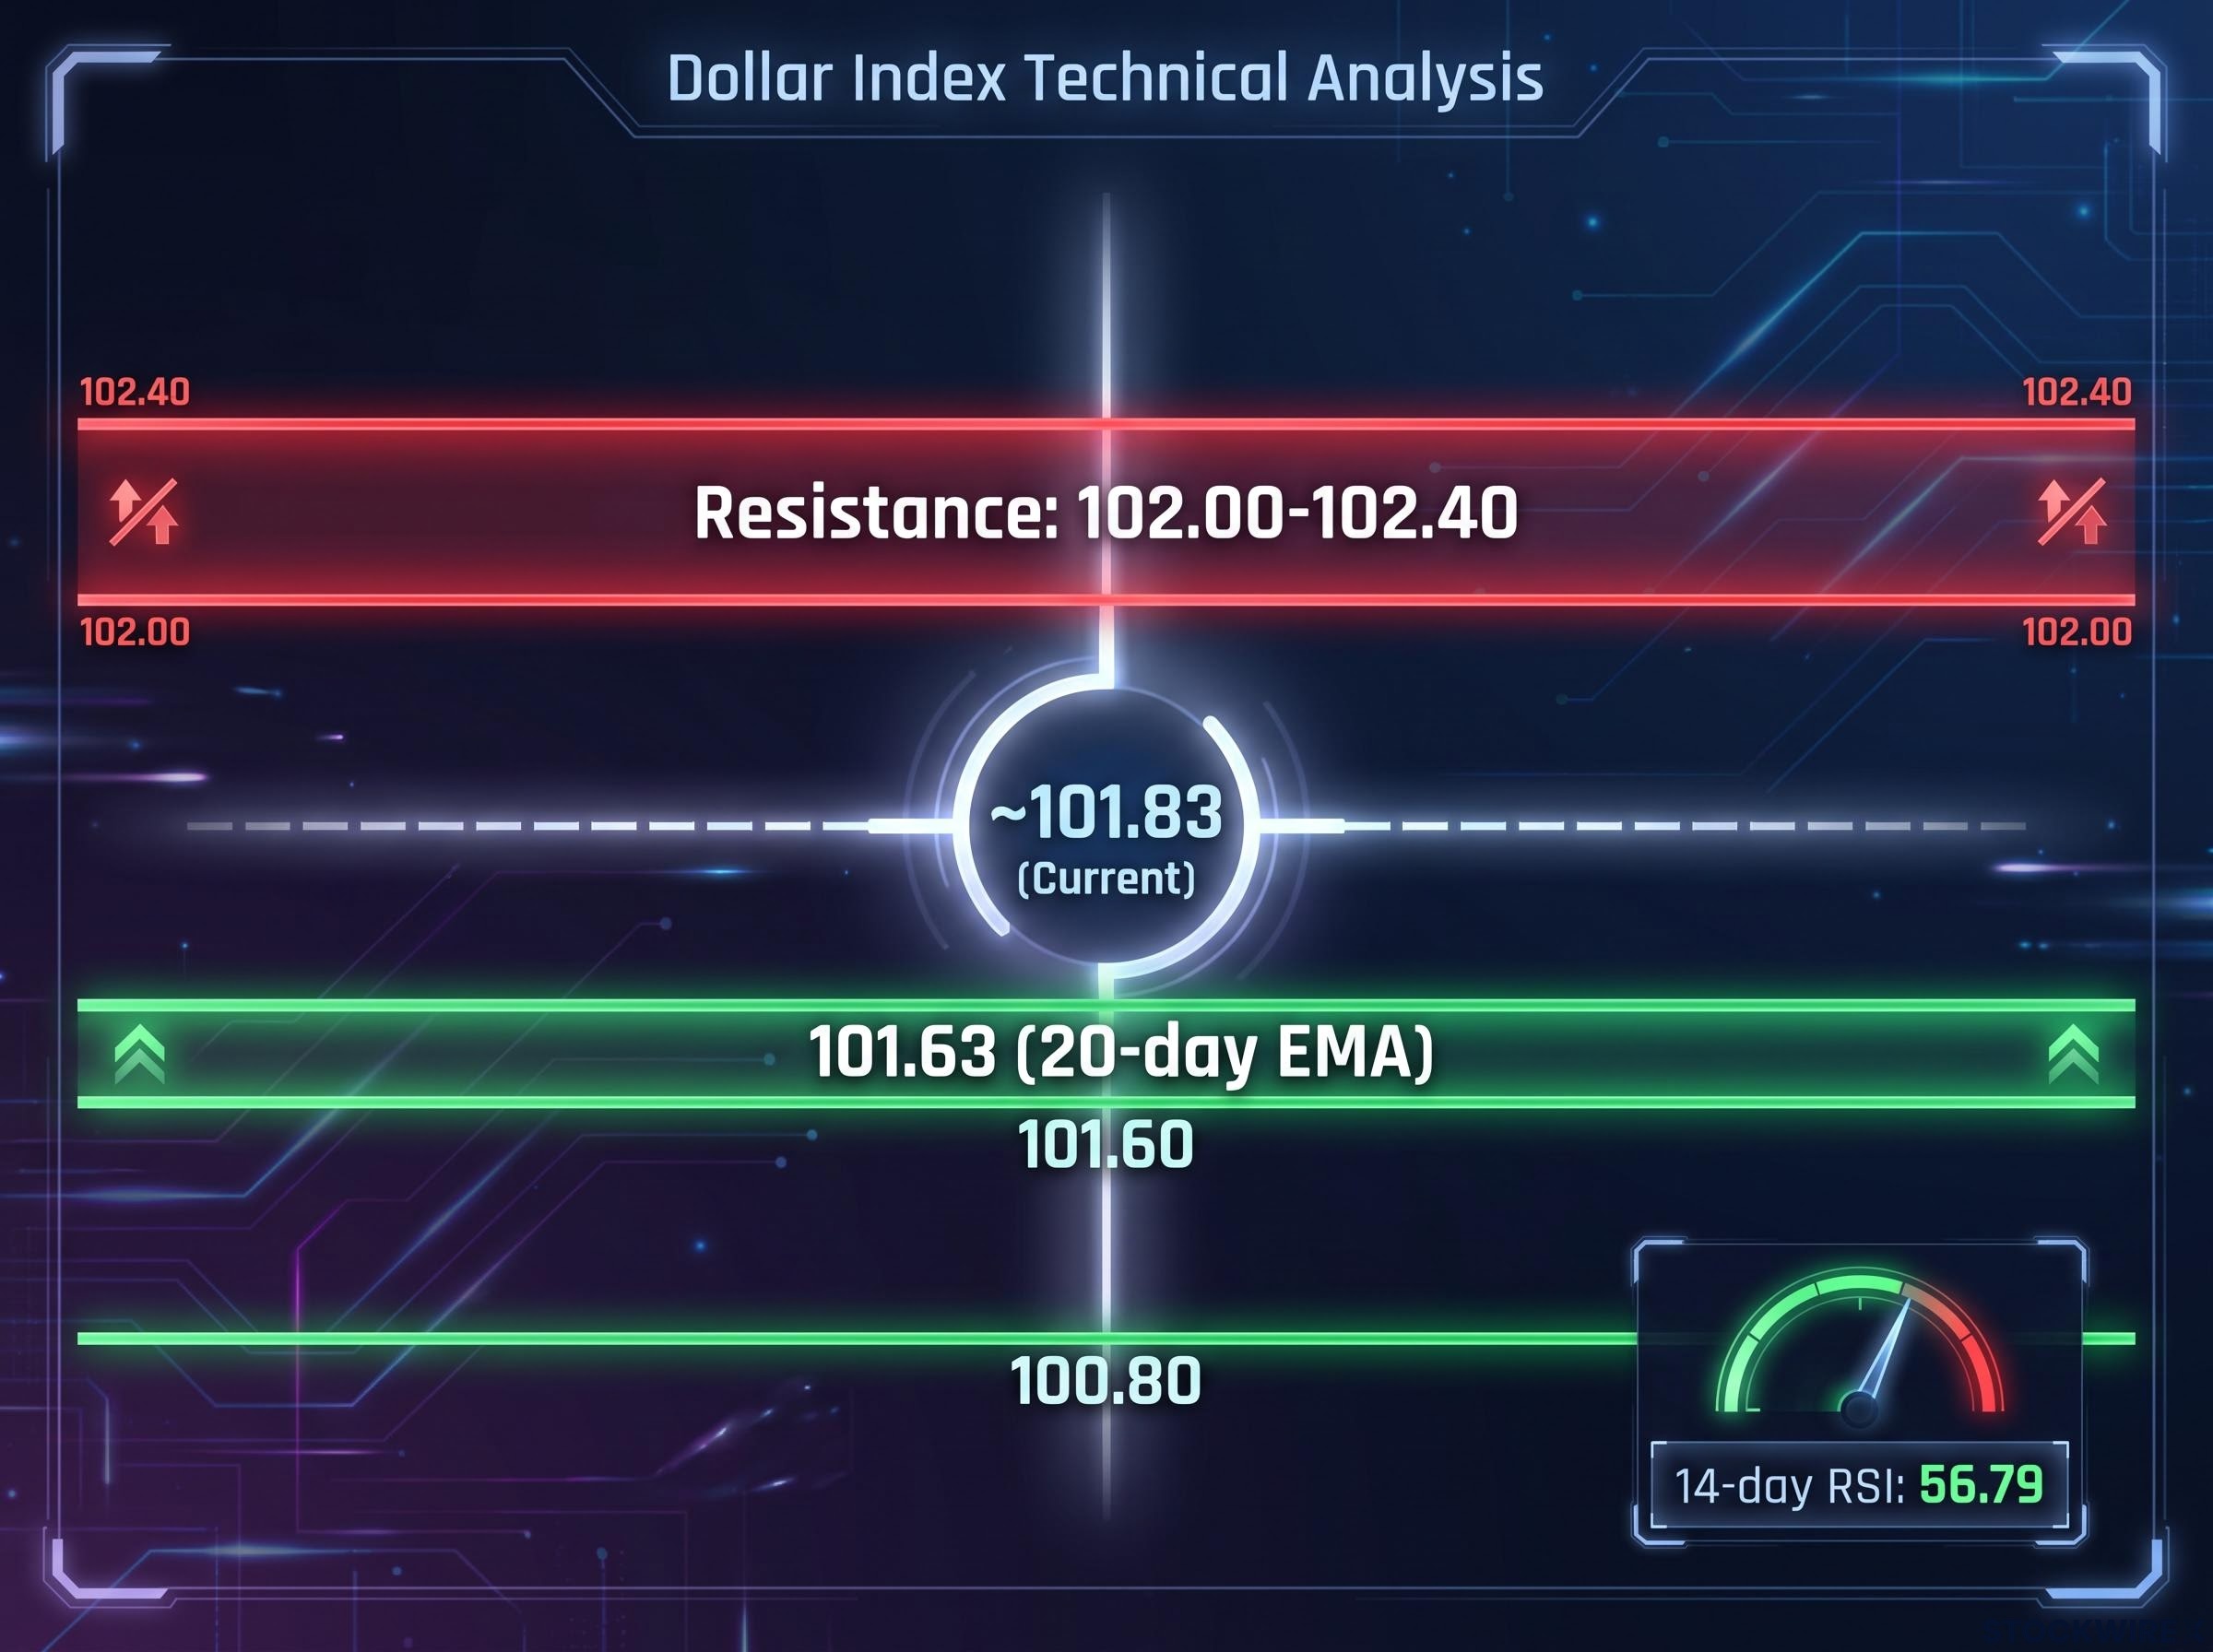
The news-led Dollar Index forecast is therefore mildly bullish while the index holds above the EMA. If the index closed convincingly under that average, it would hint that the rebound is running out of steam.
| Level | Type | Significance |
|---|---|---|
| 102.00-102.40 | Resistance (unverified) | Includes the 13 October high region |
| 101.63 | Support | 20-day EMA, the main line for the bias |
| 101.60 | Support (unverified) | Just beneath the EMA |
| 100.80 | Support (unverified) | Deeper floor if the EMA gives way |
Treat these as tools, not predictions. The index is weighted heavily toward the euro, an RSI near 57 does not point in any direction, and a single data surprise can reverse an EMA break within days.
Three things to watch:
- Whether the index holds 101.63 on a daily close
- The next CPI and PCE inflation prints
- The October FOMC decision
Holding or losing 101.63 is the practical test of whether this dip is a pause within a recovery or the start of a deeper retreat.
Investors exploring the 20-day EMA and RSI framework further can use our deep-dive into DXY technical analysis, which shows how chart signals line up with Fed policy.
What traders should weigh before the October and December decisions
Friday’s move looks event-driven rather than a structural shift; the dollar’s broader supports have not changed. What has changed is that guidance has stepped aside and data now sets the direction. Inflation and jobs releases, then the October and December FOMC meetings, will decide whether the slide extends, with 101.63 as the checkpoint between them.
Every level and probability here is market-derived and can shift quickly. Past performance does not guarantee future results, and forward-looking views are subject to change as conditions develop.
This article is for informational purposes only and should not be considered financial advice. Investors should conduct their own research and consult with financial professionals before making investment decisions.
—