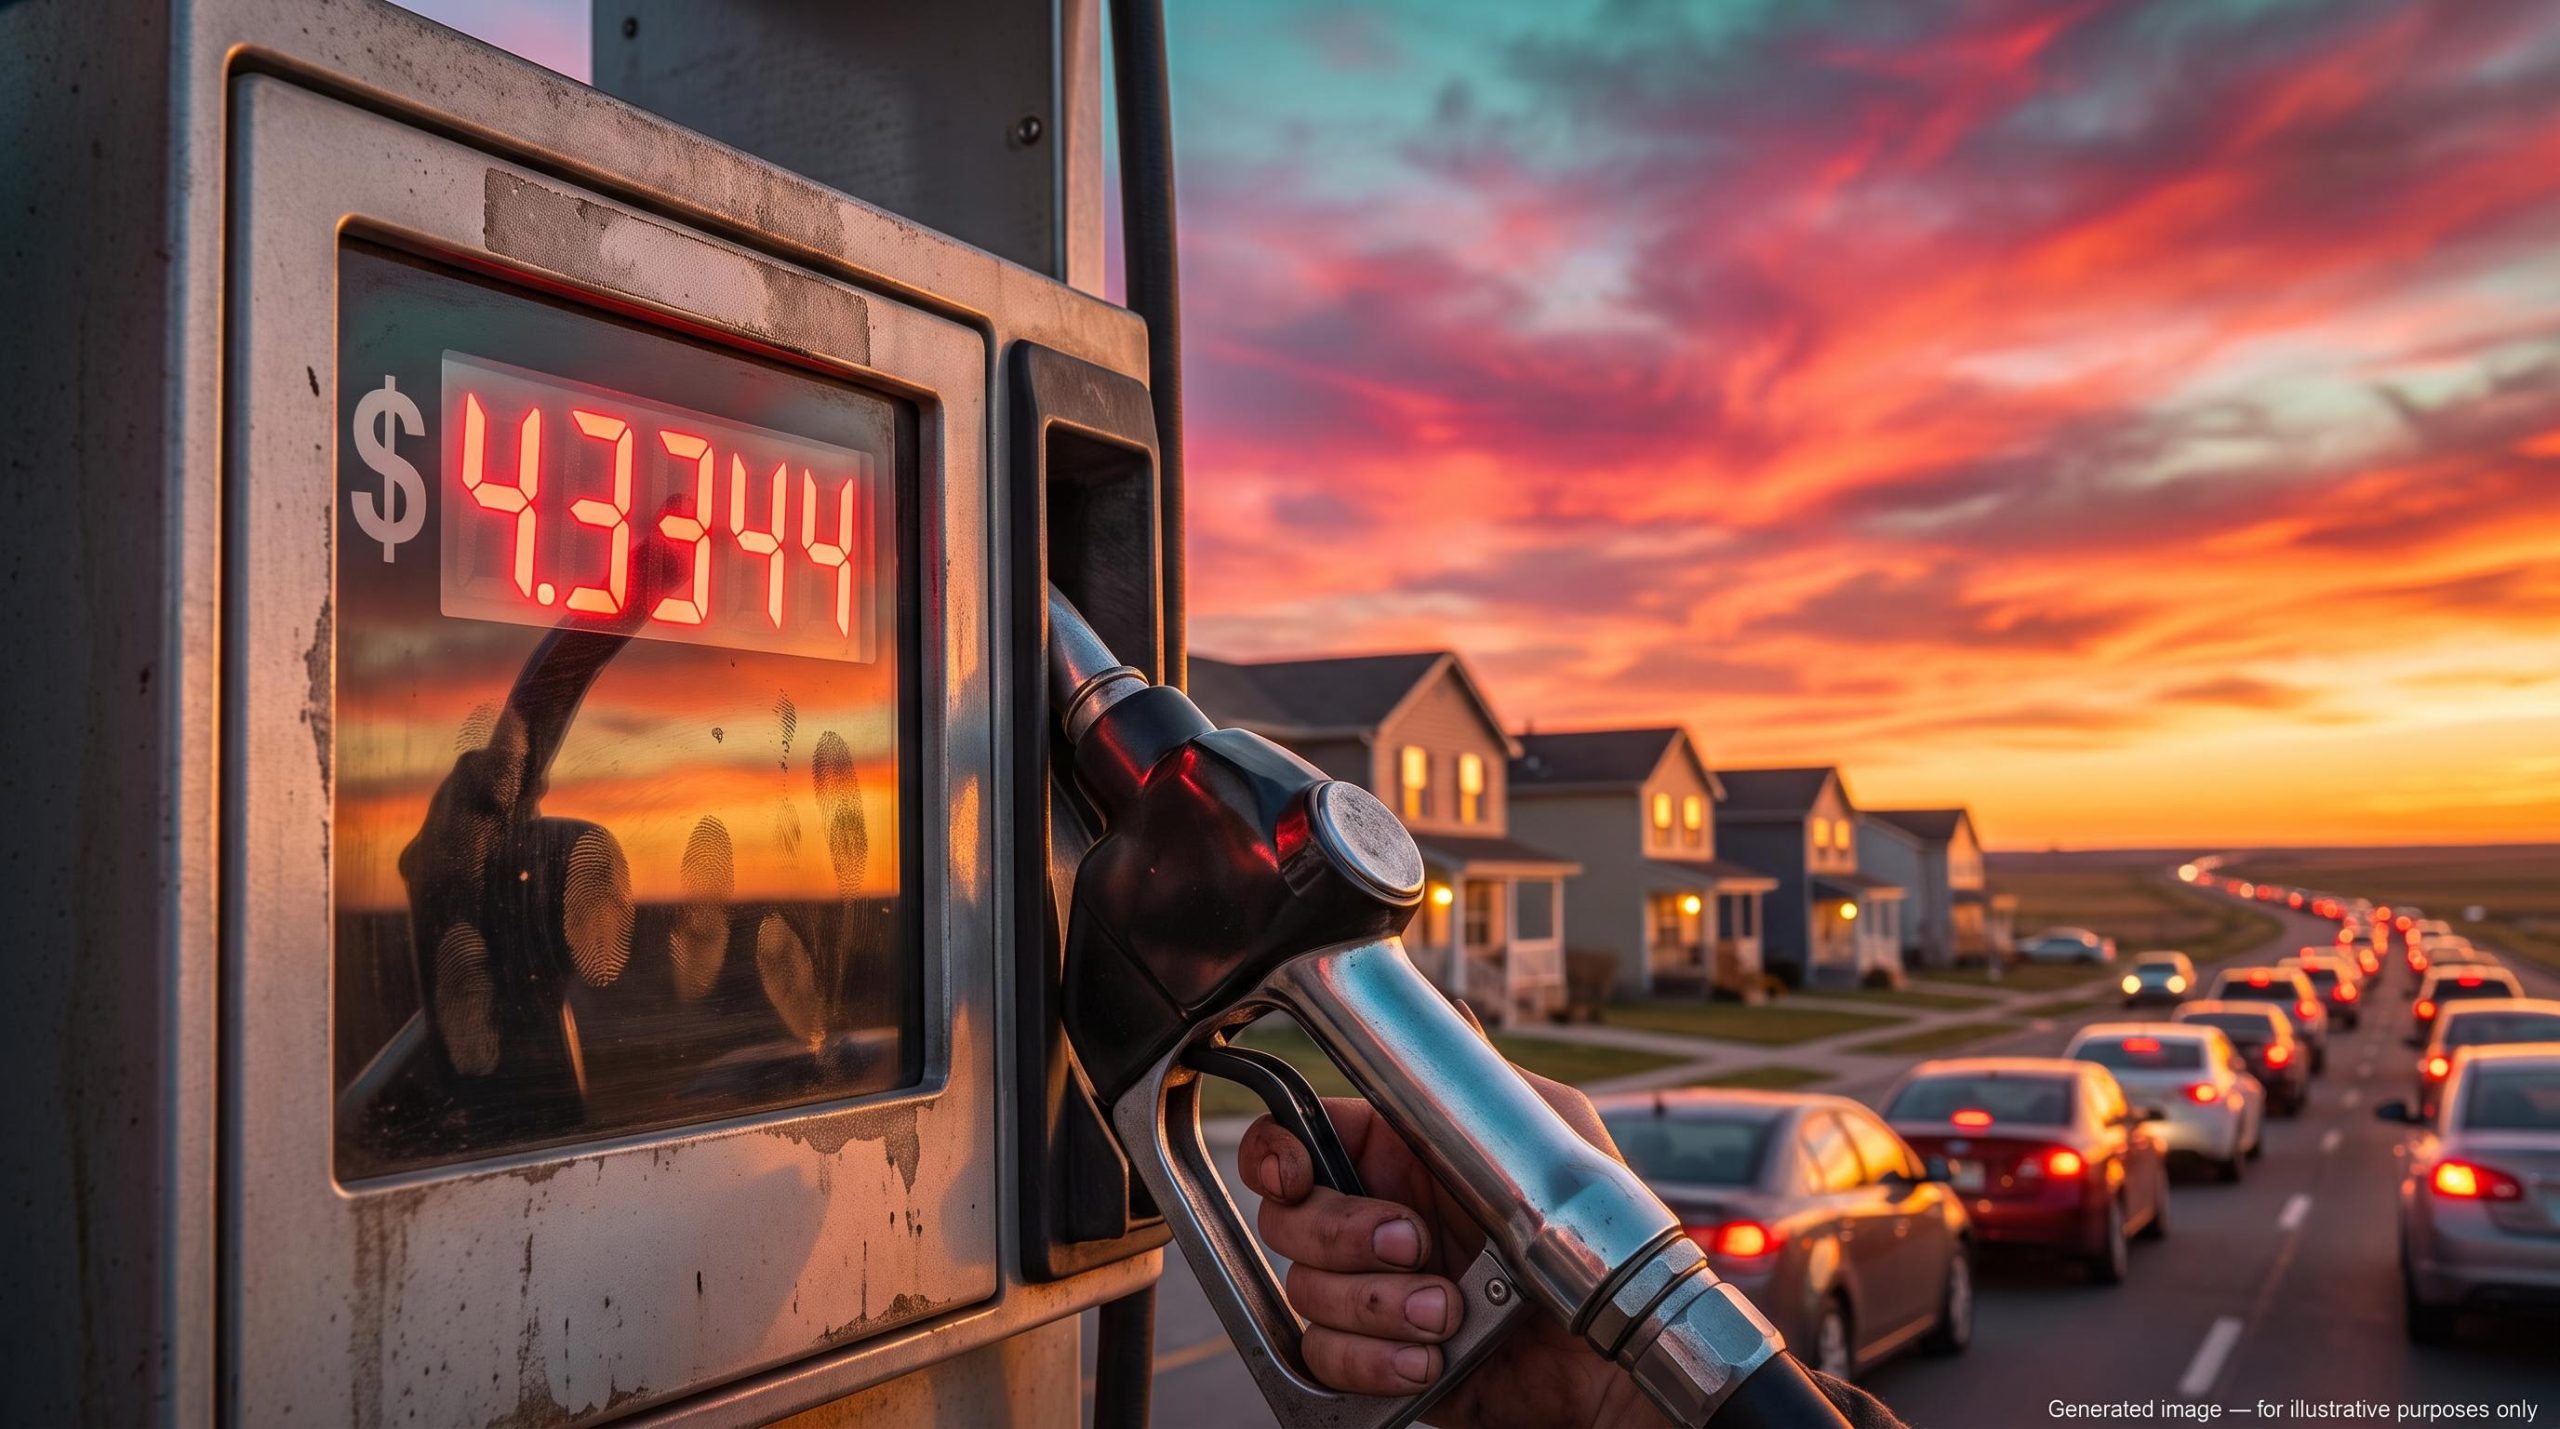
Headline US consumer prices rose 0.6% in September and 3.7% on the year, a reading that looks like inflation is breaking loose again. Look closer and gasoline explains more than half of that monthly jump. The question that shapes the US inflation outlook, and the one most headlines skip, is whether you are watching a temporary energy spike or the start of something stickier.
The answer matters because the forecasters are not relaxed. UOB economist Alvin Liew expects headline CPI to stay above 3% for the rest of 2026, with some months possibly near 4%, before easing toward 2% in 2027.
The Federal Reserve has already acted. It raised its target range to 3.75%-4.00% in September 2026, which puts your assumptions about borrowing costs, mortgage rates and portfolio returns directly in play.
This gives you a working framework for judging whether inflation pressure is fading or hardening, and the specific indicators that will tell you before the headline number does.
Why is September’s CPI reading both alarming and ambiguous?
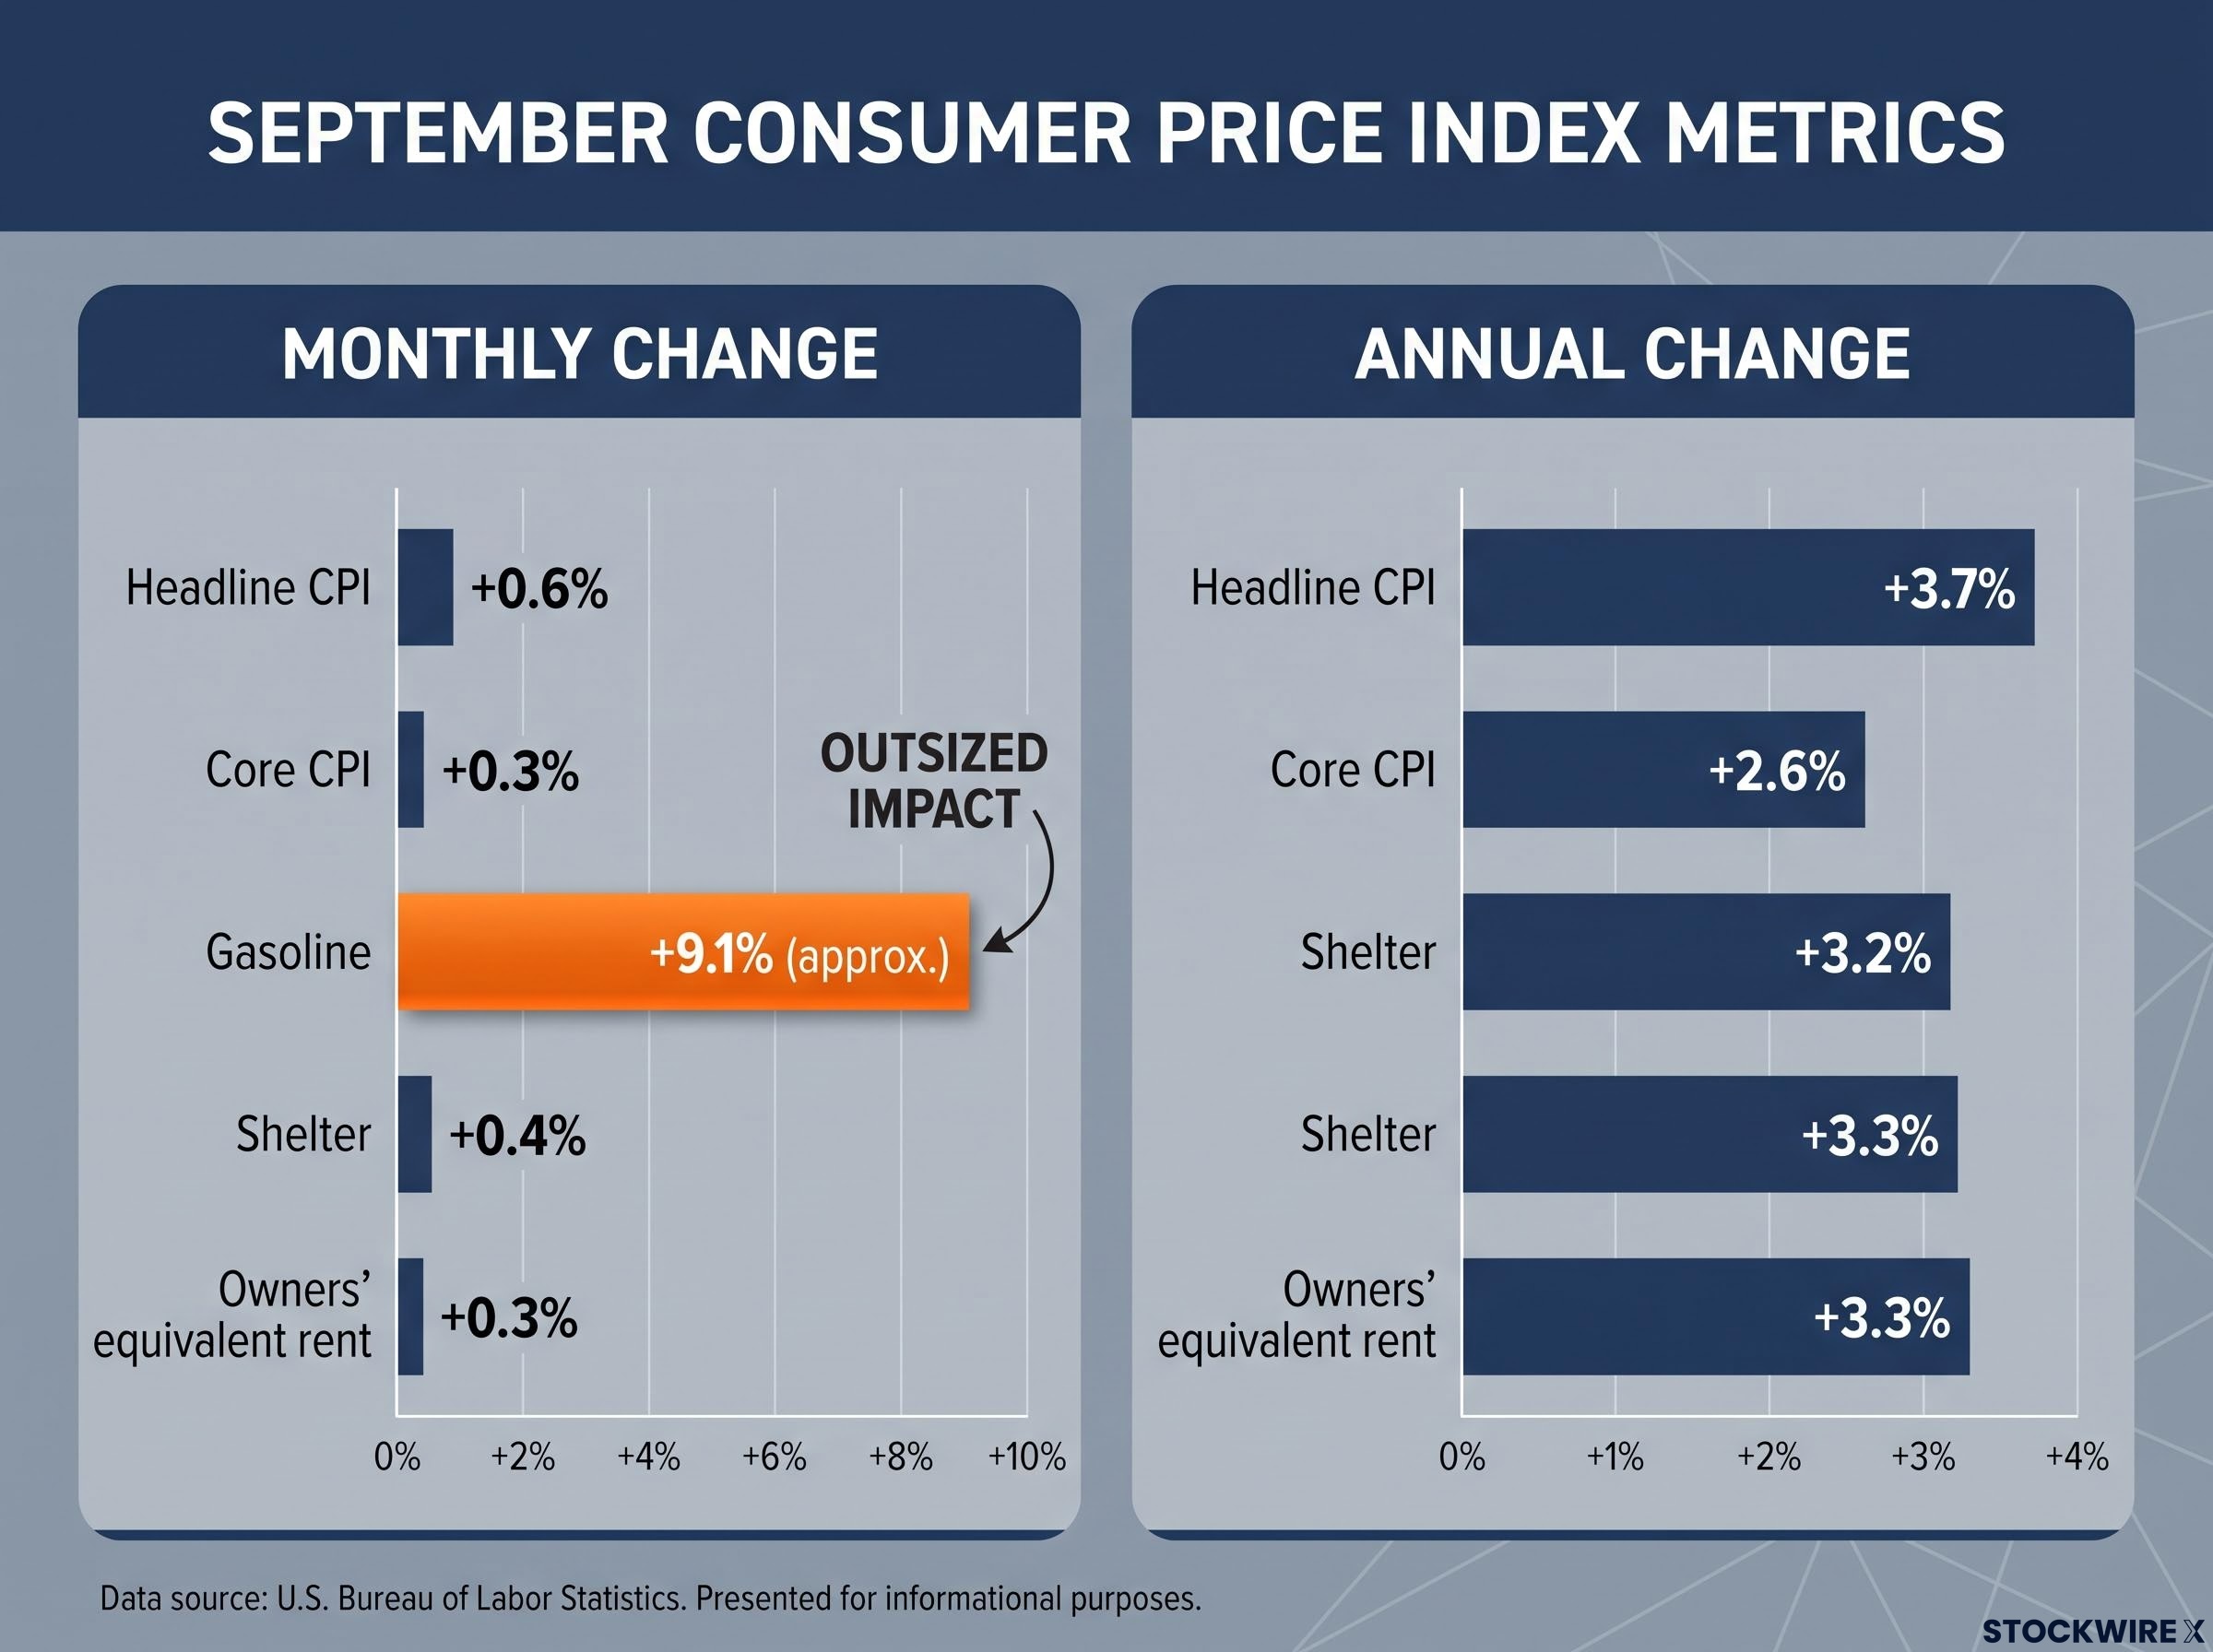
Start with the number that made the news. The Consumer Price Index (CPI), the government’s measure of the average change in prices households pay, rose 0.6% in September, according to the US Bureau of Labor Statistics (BLS) release on 14 October 2026. Annual inflation reached 3.7%.
Now take it apart. Gasoline prices climbed about 9.1% in a single month and accounted for more than half of that headline increase. AAA put the national average for regular gasoline at $4.3344 per gallon on 15 October 2026.
If that were the whole story, you could call it an oil problem and move on. It is not.
Your reading of a gasoline-driven spike also depends on money supply growth, because broad money expanding at a fraction of its 2020 pace is one reason energy shocks have so far failed to spread into every category of prices.
Core CPI, which strips out volatile food and energy prices to show the underlying trend, rose 0.3% on the month and 2.6% on the year. Shelter, the housing component, accelerated to 0.4%.
| Component | Monthly change | Annual change |
|---|---|---|
| Headline CPI | +0.6% | +3.7% |
| Core CPI | +0.3% | +2.6% |
| Gasoline | about +9.1% | Not reported |
| Shelter | +0.4% | +3.2% |
| Owners’ equivalent rent | +0.3% | +3.3% |
Rent of primary residence rose a milder 0.2%. Liew summed up the month as inflation picking up on energy costs alongside shelter costs that refuse to cool.
The practical read: mixed but hawkish Gasoline explains much of the headline jump, but core still rose 0.3%, shelter accelerated and annual core climbed to 2.6%. That combination supports keeping policy restrictive.
What this means for you: a gasoline-driven headline can overstate the trend, but rising core and shelter readings give the Fed reason to stay tight regardless of what happens at the pump.
When big ASX news breaks, our subscribers know first
How do energy prices, Middle East tensions and shelter feed into CPI?
Not every part of CPI moves at the same speed. Some components react within weeks, while others take months or years to catch up.
From crude oil to the pump: the fast channel
Brent crude, the global benchmark oil price, stood at $130.18 per barrel on 9 October 2026, according to the US Energy Information Administration (EIA). That is not a same-day figure with the AAA gasoline price, but it frames the backdrop.
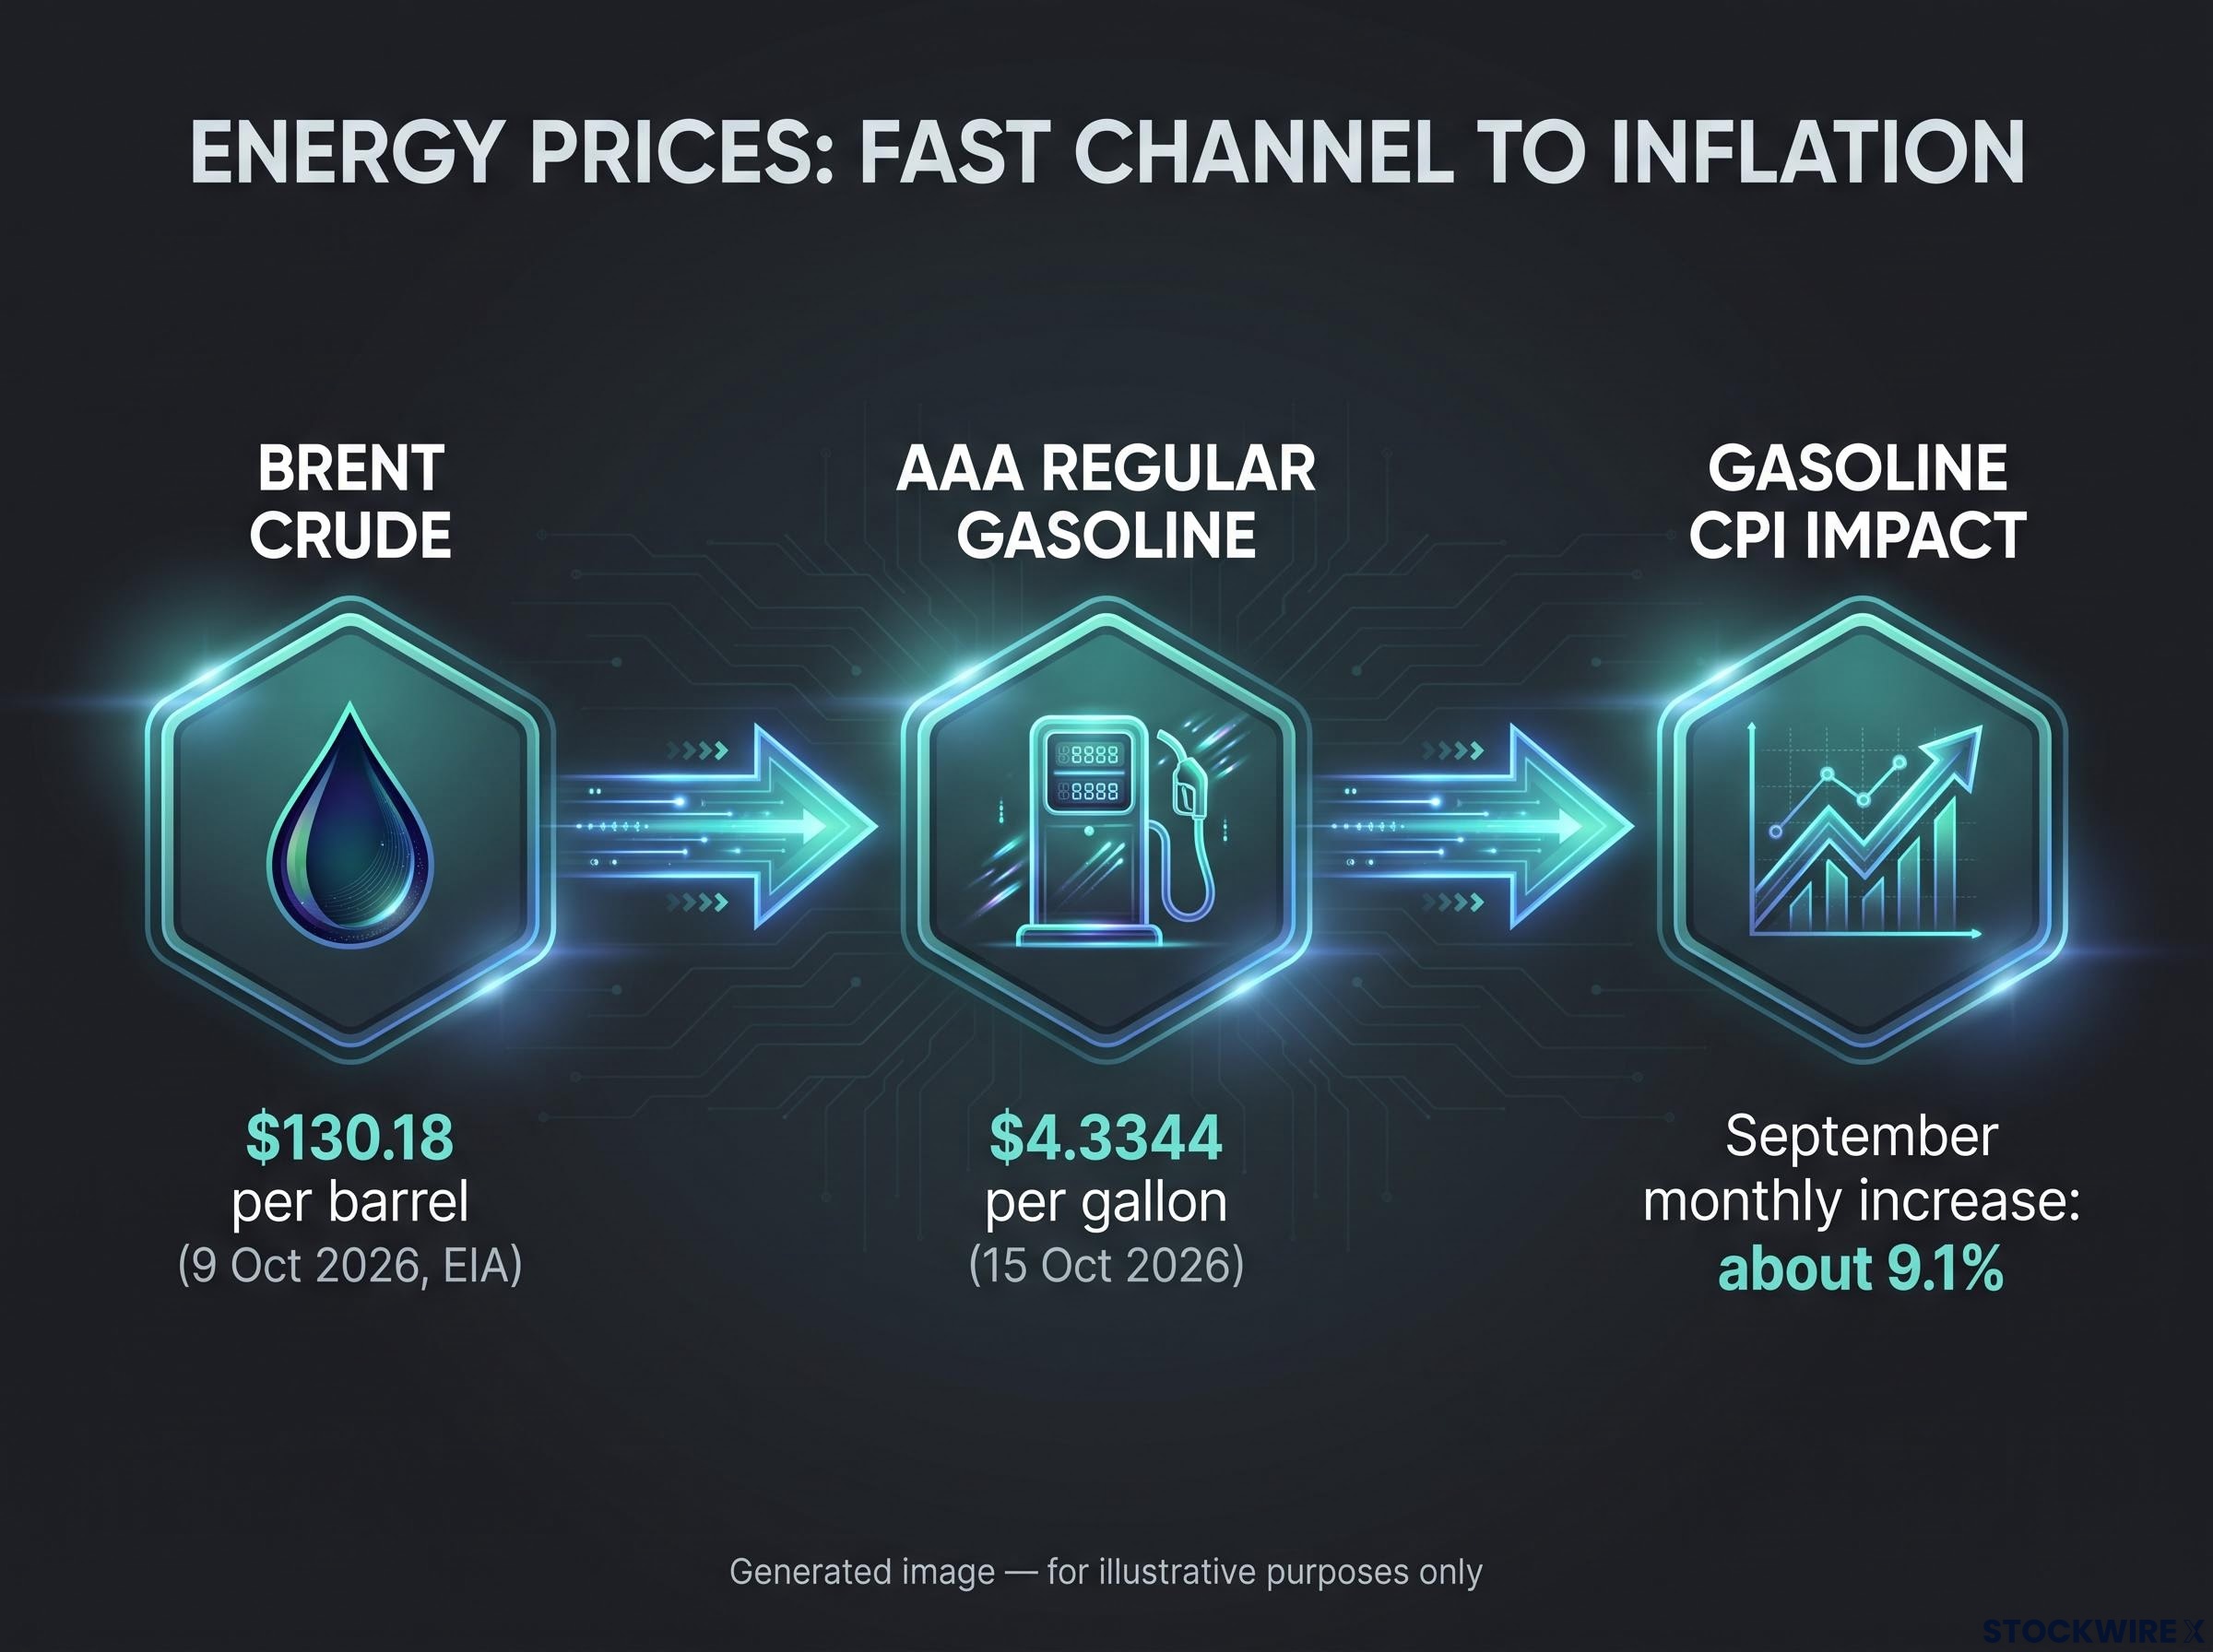
Higher crude flows quickly into gasoline, diesel and jet fuel. Gasoline carries a large, visible weight in CPI and reprices fast, so an oil shock lifts the monthly headline almost immediately. September shows that mechanism at work.
Middle East tensions can push prices higher even before any physical supply disappears. The channels include:
- risk premiums built into crude prices;
- threats to shipping routes and higher insurance costs;
- disruptions to refining, pipelines or production;
- precautionary buying as firms stock up; and
- higher transport and logistics costs.
Energy then seeps into core prices through trucking, aviation, chemicals, plastics, agriculture and utilities. Businesses may absorb the costs in their margins at first, but persistent increases can show up later in prices, wage demands and expectations. That slower second round is how a temporary shock becomes a broader problem.
The indirect transmission channel works on a lag of several months to a year, so the full effect of sustained high crude prices on your grocery, freight and service bills may not appear in the data for some time.
Why shelter inflation moves slowly
Shelter works on a different clock. CPI measures rents paid by existing tenants, not just new leases, and most tenants do not renegotiate monthly. BLS also rotates the units it samples over time.
Owners’ equivalent rent (OER) adds another lag. OER is an imputed figure, meaning BLS estimates what a homeowner would pay to rent a comparable home rather than recording an actual payment. The result is a smooth, slow-moving series, so rents on new leases can cool well before official shelter does.
It helps to sort the drivers by type:
- Cyclical: oil shocks, demand surges, shipping disruption, temporary tariff pass-through.
- Structural: housing shortages, restrictive zoning, construction and insurance costs, persistent service-sector wage pressure.
- Policy-sensitive: tariffs lift import prices directly, while tight monetary policy suppresses demand with a lag.
The takeaway for your budget: the energy shock hits you immediately, but any relief from falling market rents will reach the official data late.
What does UOB expect through 2027, and where do other forecasters disagree?
UOB’s path reads less like a prediction and more like a conditional story. Liew forecasts 2026 averages of 3.5% headline and 2.8% core inflation, with both easing gradually toward 2% in 2027.
That easing depends on two things holding. Energy prices need to stay contained and shelter needs to keep normalising. UOB also flags tariffs and AI-related effects as upside risks, and expects the Fed to deliver further 25 basis point hikes in December 2026 and Q1 2027 before a prolonged hold.
UOB’s conditional framing The move toward 2% in 2027 relies on energy staying contained and shelter inflation continuing to normalise. Take away either condition and the path lengthens.
Set that beside the other major views and the shape of the debate changes.
| Forecaster | 2026 view | 2027 view | Key assumption |
|---|---|---|---|
| UOB (CPI) | 3.5% headline, 2.8% core | Easing toward 2% | Energy contained, shelter normalises |
| Fed SEP (PCE) | 3.7% headline, 3.4% core | 2.3% headline, 2.5% core | Rates held near 4.1% |
| Morningstar | About 3.4% | 2.4% | Falling energy, fading tariffs |
| Goldman Sachs | Core notably above target | Core may stay sticky | Tariffs and “tech-flation” lift goods |
The Fed projects the Personal Consumption Expenditures (PCE) price index, a different inflation gauge from CPI, so the figures are not a direct like-for-like comparison.
Morningstar expects falling energy to deliver a negative inflation impulse in 2027. Goldman Sachs sees a stickier problem: services have largely normalised, but tariffs and technology-driven price increases keep goods inflation elevated even if oil retreats.
The real disagreement is not whether inflation is high. It is how quickly temporary shocks reverse. For you, the striking point is that none of these forecasts puts inflation at 2% before 2027, so planning around quick relief is itself a risk.
These forecasts are speculative and subject to change based on market developments. Past performance does not guarantee future results.
Why does this backdrop support a hawkish Fed, and what would change the picture?
Why the Fed has little room to ease
The Fed raised its target range by 25 basis points to 3.75%-4.00% at its 15-16 September 2026 meeting. Its Summary of Economic Projections (SEP), the quarterly set of forecasts from Fed officials, implies another 25 basis point increase by the end of 2026 and no median cut in 2027.
The September FOMC statement confirms the decision to lift the federal funds target range to 3-3/4 to 4 percent, which means your borrowing costs are now being set against a committee that still sees inflation as too high.
That is a “higher for longer” signal. With inflation projected well above the 2% target, cutting early risks lifting long-term inflation expectations.
The dilemma cuts both ways. Tightening into a supply shock can weaken employment without lowering energy or shelter prices, while tolerating the shock too long risks embedding it in wages and expectations. The 1970s remain the warning case of energy feeding into wages and price-setting, though not every oil spike ends that way.
What would need to go right for disinflation
History offers some reassurance. The 2021-23 disinflation came from prices rising more slowly, not from prices falling. High base effects from 2022 also showed how annual inflation can drop quickly once a spike rolls out of the comparison.
For that to repeat, several conditions would need to line up:
- oil and gasoline prices retreat;
- market rents keep slowing;
- wage growth moderates without a sharp rise in unemployment;
- tariffs stop generating new price increases.
Risks could also break the hawkish case: demand destruction if gasoline stays above $4, a sudden energy reversal, a weakening labour market, or a policy error.
When the next CPI release lands, check these indicators in order:
- Monthly versus annual: base effects can move the annual rate against the monthly trend.
- Headline versus core: headline shows the household cost shock, core shows persistence.
- Three- and six-month annualised rates: these often reveal turning points before the 12-month figure.
- Market rents versus CPI shelter: new-lease data leads the official measure.
- Core goods and services excluding shelter: these expose second-round effects.
- Breakevens: market-implied inflation expectations show whether investors see the shock as temporary.
- Wages: labour-market cooling is a precondition for lasting core disinflation.
Rate cuts are not the base case in the near term. These signals, though, are likely to shift well before the headline number does.
What the September data changes, and what it does not
September confirmed that headline pressure is largely energy-led and potentially temporary. It did not loosen the case for restrictive policy, because core and shelter are still pushing in the wrong direction. The path back to 2% in 2027 is conditional, not guaranteed.
Three variables carry most of the weight from here: oil prices and Middle East developments, the gap between market rents and official shelter, and how quickly the labour market cools. The next CPI release will be the first real test of which way they are breaking.
This is educational context rather than personalised financial advice.
This article is for informational purposes only and should not be considered financial advice. Investors should conduct their own research and consult with financial professionals before making investment decisions.