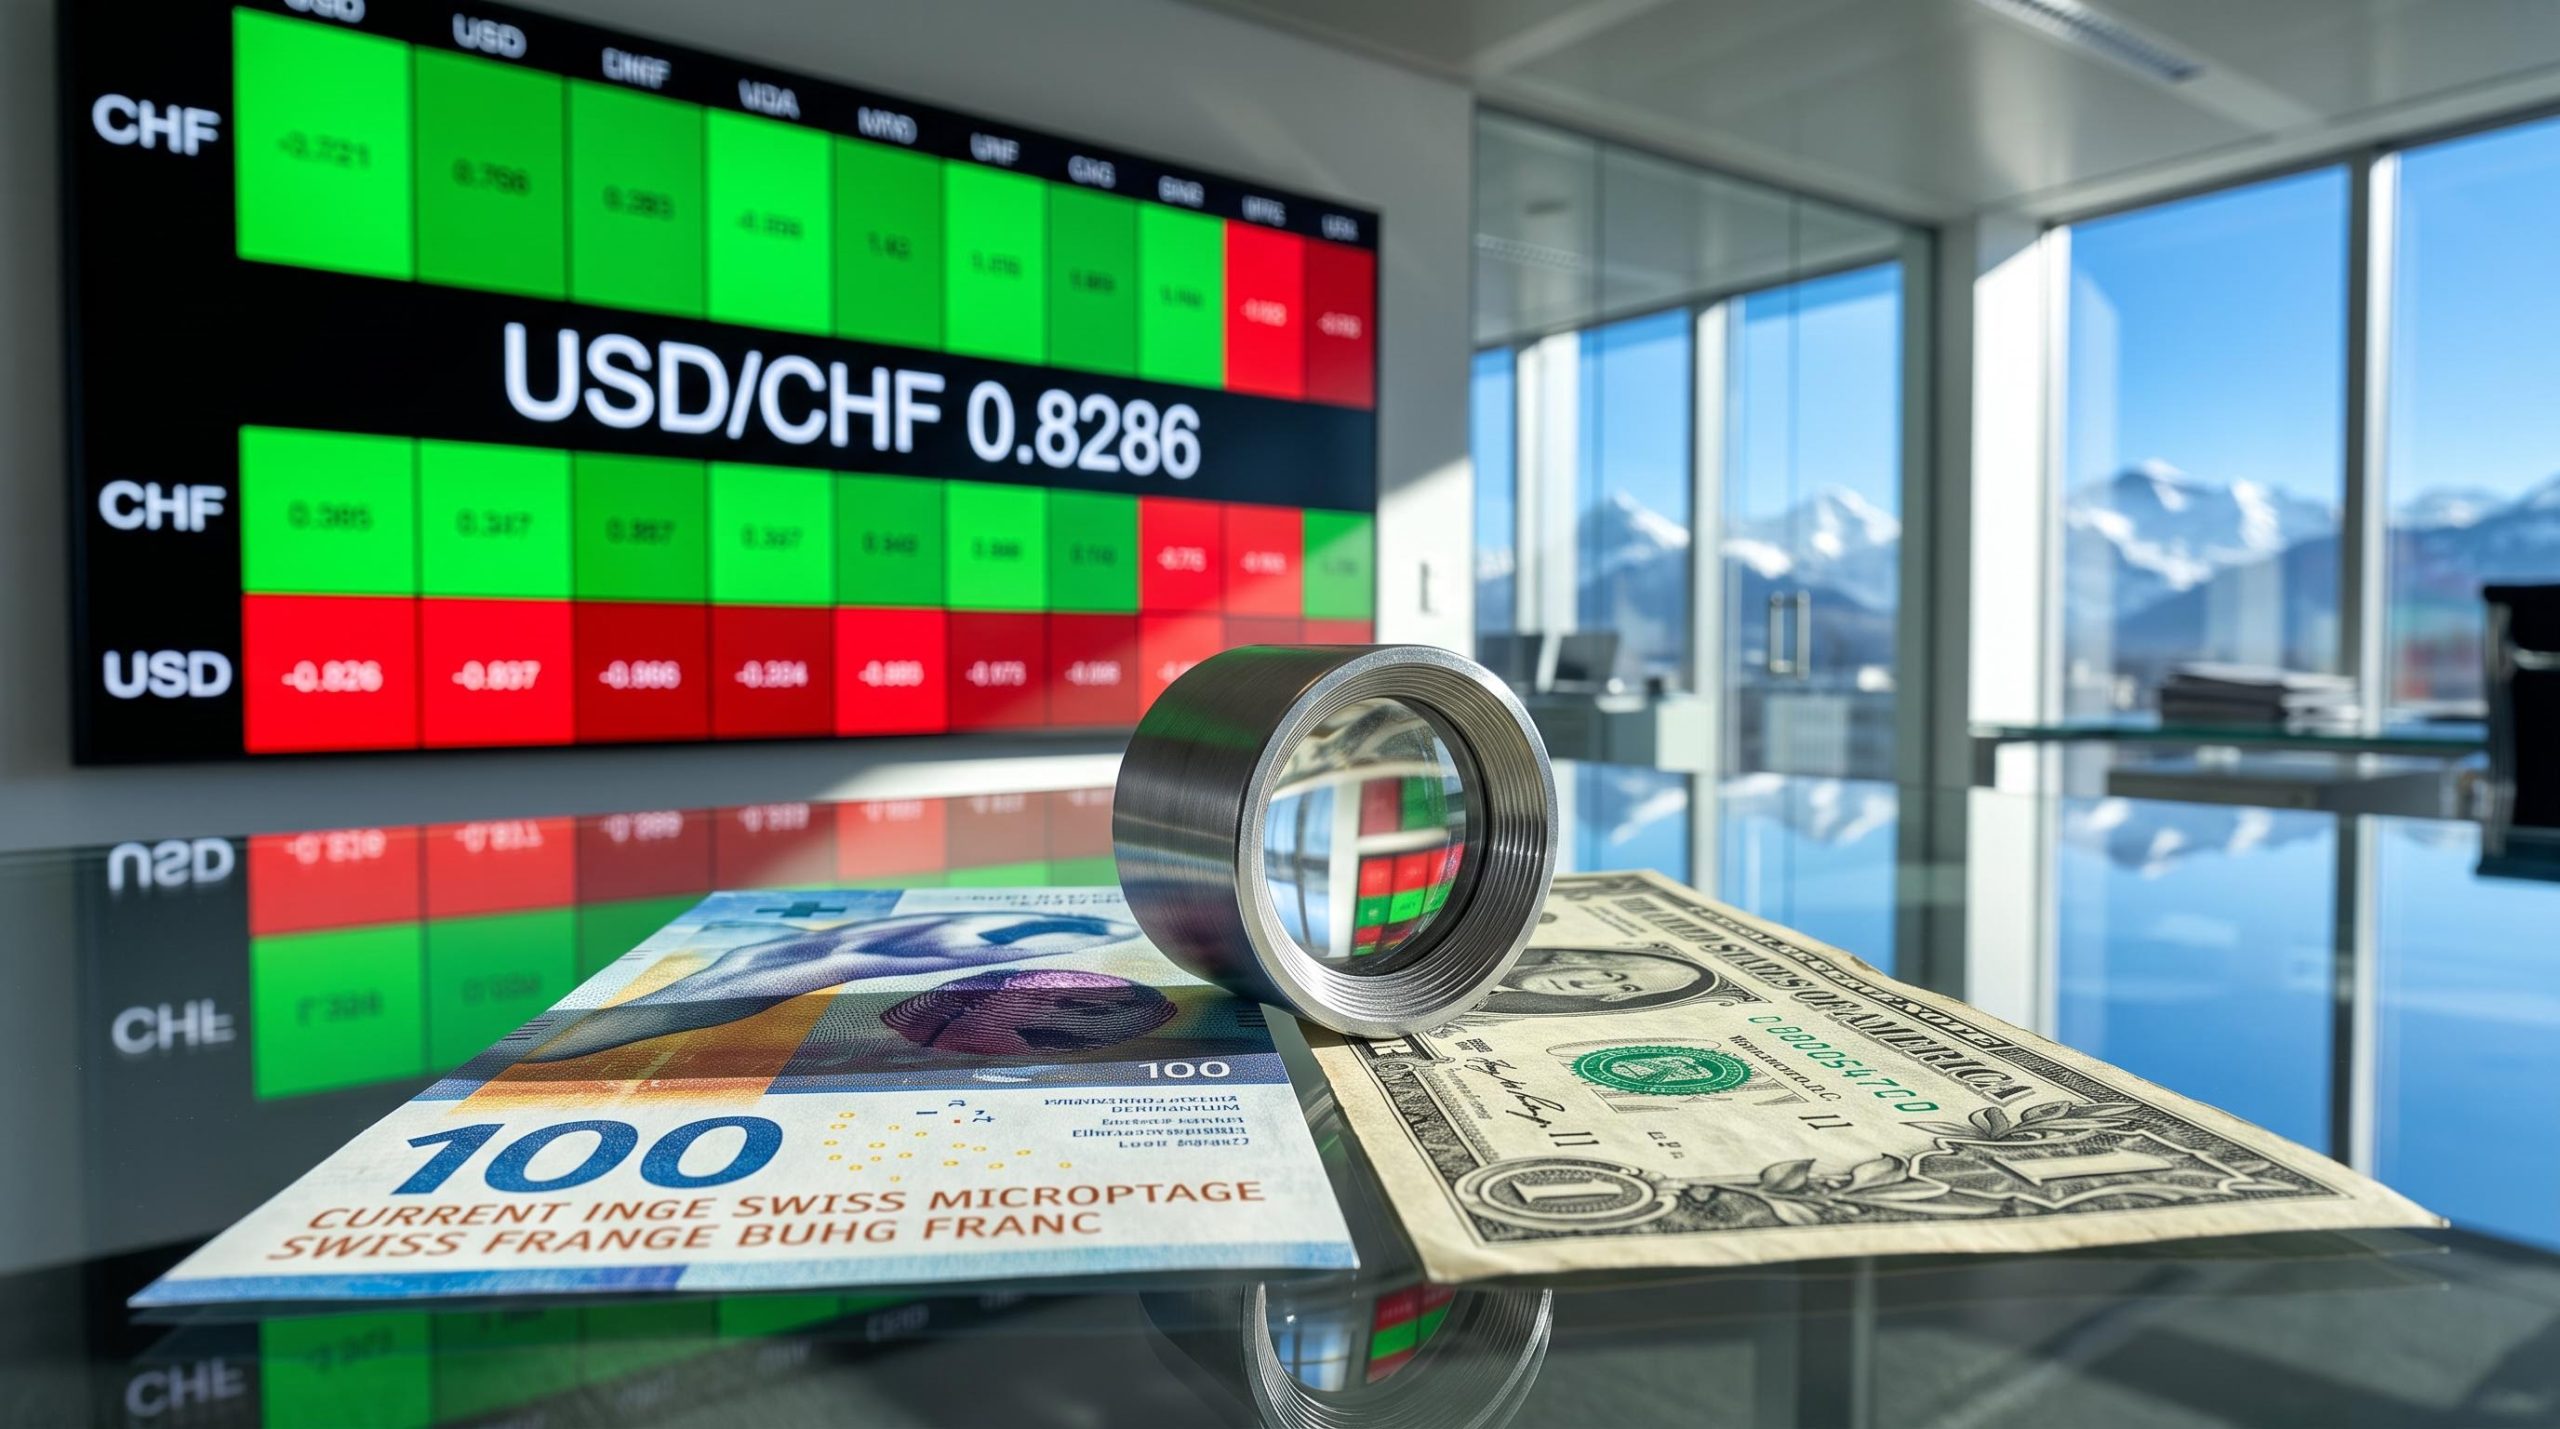
Two US inflation reports in two days came in hotter than forecast. The textbook reaction would be a stronger dollar, yet USD/CHF slid to roughly two-week lows near 0.8286 on 15 October 2026, down about 1.3% from Wednesday’s 0.8395 high, which was the pair’s strongest level since May 2025.
That gap between the data and the price is the story. If hot inflation reliably lifted the dollar, this move should not have happened.
For anyone trading the pair, hedging dollar or franc exposure, or holding assets priced in either currency, the lesson is uncomfortable. The inflation print was not the signal that moved the market.
Here is what actually drove the slide, whether the franc’s strength has staying power against a central bank sitting at zero, and how to read a currency heat map well enough to judge the next move yourself.
Why did the dollar fall when US inflation came in hot?
Start with the numbers, because they point the wrong way. The September Consumer Price Index (CPI), released on 14 October, beat forecasts on an annual basis. The Producer Price Index (PPI), which tracks prices businesses receive, followed on 15 October with a far larger upside surprise.
| Indicator | Actual | Forecast | Surprise |
|---|---|---|---|
| Headline CPI YoY | 3.7% | 3.6% | +0.1 pts |
| Core CPI YoY | 2.6% | 2.5% | +0.1 pts |
| Headline PPI MoM | 1.3% | 0.5% | +0.8 pts |
| Headline PPI YoY | 6.3% | 5.3% | +1.0 pts |
Headline monthly CPI matched expectations at 0.6%, and core PPI rose 5.0% year on year against a 4.4% forecast. PPI was the bigger shock, and it still could not hold the dollar up.
The reason sits in the bond market. Here is how the inflation surprise got overridden:
- Hot data raised expectations of further Federal Reserve tightening.
- That would normally push Treasury yields and the dollar higher.
- Instead, investors focused on growth and valuation risk from persistently high rates, particularly around the scale and financing of AI investment.
- Equities sold off, safe-haven buying pulled Treasury yields lower, and the dollar lost its yield edge.
- The franc gained as a defensive currency.
The 10-year Treasury yield fell more than 8 basis points to about 5.06%, a three-week low, from roughly 5.19% before CPI. The US Dollar Index (DXY), which measures the dollar against a basket of major currencies, peaked at 102.94 and slid toward 102.00.
The yield link Matthew Ryan of Ebury, cited by Reuters, observed that the dollar had drawn support from rising Treasury yields, and that this support faded once yields stopped climbing.
What this tells you is that yields and portfolio risk can matter more to the dollar than the inflation figure itself. Watching CPI alone gives you half the picture.
Earlier in the month, the dollar’s rise had less to do with US data than with euro selling tied to French fiscal stress, a reminder that USD/CHF often responds to cross-currents unrelated to American inflation.
When big ASX news breaks, our subscribers know first
What a currency heat map reveals about the franc’s move
If the dollar story was really a risk story, the evidence should show up beyond one pair. A currency heat map is the fastest way to check.
How to read the grid
A heat map is a grid showing how each major currency moved against every other over a set period, usually one day. The basic rules:
- Rows are the base currency; columns are the quote currency.
- Each cell shows the percentage move of the base against the quote.
- Green means the base strengthened; red means it weakened. Deeper colour signals a bigger move.
- The greenest row is usually the strongest currency, and the reddest row the weakest.
- A single cell proves only a two-currency move. Breadth across a whole row or column is what reveals a theme.
What Thursday’s franc row shows
FXStreet’s heat map on Thursday showed the franc gaining against every major currency listed.
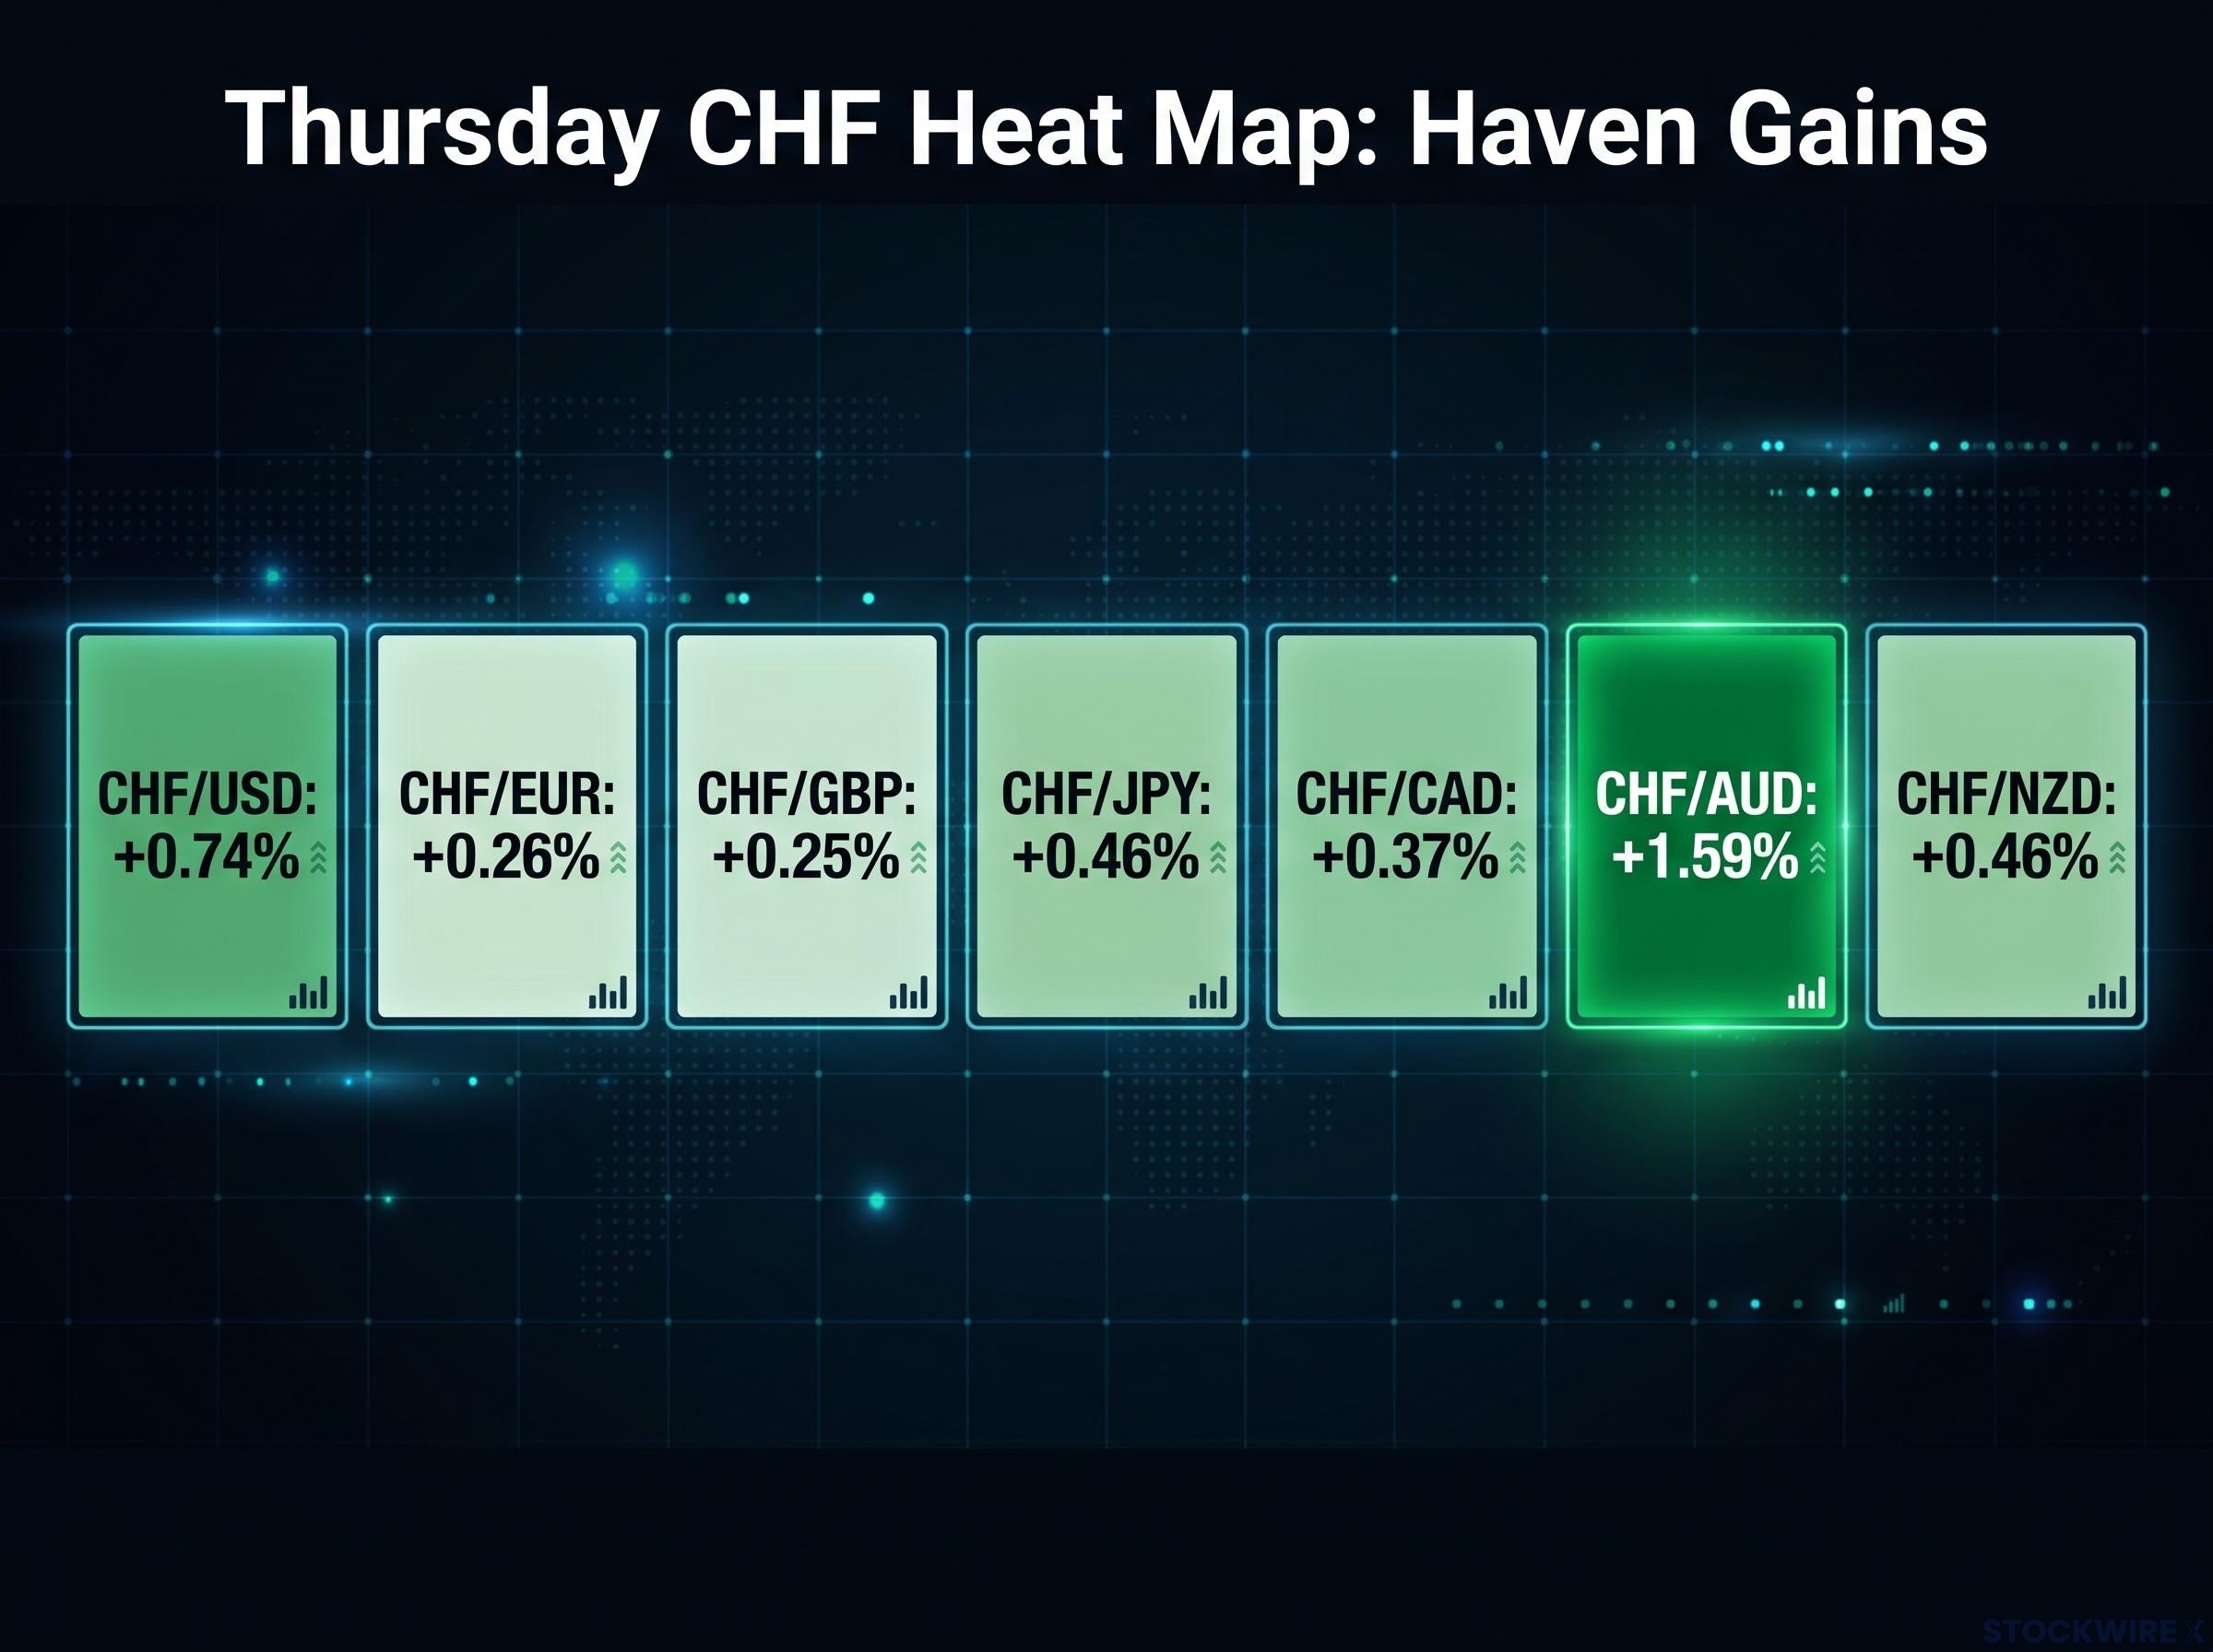
| Pair | CHF change |
|---|---|
| CHF vs USD | +0.74% |
| CHF vs EUR | +0.26% |
| CHF vs GBP | +0.25% |
| CHF vs JPY | +0.46% |
| CHF vs CAD | +0.37% |
| CHF vs AUD | +1.59% |
| CHF vs NZD | +0.46% |
The Australian dollar is the standout. It is a growth-sensitive currency that typically suffers when investors pull back from risk, so the franc’s 1.59% gain against it fits a risk-off reading.
A uniformly green franc row, with the strongest gains against cyclical currencies, points to a broad rotation into safety rather than anything specific to Switzerland. For you, that distinction matters: haven flows can reverse as quickly as sentiment does, while a fundamentals-driven move tends to last longer.
Fed hike odds against an SNB at zero: what limits USD/CHF from here?
A haven rally still has to contend with interest rates. On that front, the two central banks behind the pair are pulling in opposite directions.
The Fed path
Markets expect the Fed to hold at its 27-28 October meeting and hike by December. The October odds, however, depend on which source you check:
- CNBC: 53.7% odds of a 25 basis point hike, immediately after the CPI release (14-15 October).
- Reuters factbox (via US News, 15 October): about 27%, which is more recent and suggests a hold as the base case.
December is far clearer. CME FedWatch shows roughly 90% odds of a hike by then, with Reuters at 89.5% and earlier TMGM coverage at about 95%. The honest read is that an October move remains a live risk, not a settled outcome.
The SNB ceiling
The Swiss National Bank (SNB) held its policy rate at 0% on 24 September 2026. Official inflation was 0.8% in August; Tradingpedia reported 1.0% for September, a market figure not yet matched against an official SNB release. The SNB forecasts 0.7% inflation for 2026 and 0.8% for both 2027 and 2028, inside its 0-2% target range.
| Factor | Fed | SNB |
|---|---|---|
| Policy direction | Hike expected by December | Held at 0% |
| Inflation | CPI 3.7% vs 2% target | 0.8% (August, official) |
| FX stance | No intervention signalled | Willing to intervene as needed |
HSBC Global Private Banking noted on 12 October that the SNB dropped its “increased willingness” to intervene wording and its explicit bias against franc strength. The tool remains available, but the tone has softened.
The rate gap tells you the dollar still holds a structural yield advantage. Any pause in risk aversion could pull USD/CHF back up quickly.
The rate gap between a hiking Fed and a 0% SNB is large enough that it anchors USD/CHF direction in calmer markets, which is why any pause in risk aversion tends to pull the pair back toward the dollar.
Is the franc rally durable, or does it have a ceiling?
The franc has a credible case for further strength, and it deserves a fair hearing before the counterweights arrive.
Some analysts argue the franc can hold gains even at zero rates because of Swiss fiscal credibility, with central government debt near 14% of GDP against 122% for the US, a structural pull that yield logic alone does not capture.
Supports franc strength:
- Ongoing concern about the scale and financing of AI investment.
- Risk of a deeper equity correction feeding haven demand.
- Falling US yields eroding the dollar’s carry appeal.
- Softer SNB intervention language, which HSBC suggests could make this rally longer-lived than earlier ones.
Limits it:
- A 0% SNB rate that makes the franc a low-yielding currency.
- SNB intervention as a backstop against disorderly appreciation.
- A rebound in Treasury yields or firmer Fed-hike pricing.
UOB Group placed USD/CHF in a range of about 0.8245-0.8365 on 2 October. Wednesday’s 0.8395 high briefly broke above that band, and 0.8286 sits back inside it. UOB flagged that rebounding yields, stronger hike pricing or easing risk aversion could reverse the franc’s gains.
History offers a similar warning. Lombard Odier attributed franc strength in June 2026 to safe-haven demand that calmer markets could unwind, while OCBC, via Reuters, noted that rate volatility tends to pressure carry trades and support havens such as the franc and the dollar.
The conditional view The franc’s rally can hold while risk aversion and falling US yields persist. It is not a one-way trend.
Three signposts will confirm or break it:
- The direction of the US 10-year yield.
- October and December Fed pricing.
- Any SNB intervention signals.
Your practical task is to watch those inputs rather than the inflation calendar alone. These views are speculative and subject to change as market conditions develop.
What this move changes, and what it leaves unresolved
The dollar’s slide was not a judgement on US inflation. Falling yields and a retreat from risk overrode a clear inflation surprise, and the franc’s gains were broad and haven-driven rather than rooted in Swiss fundamentals.
What remains open is whether the franc can hold that ground against a 0% SNB rate and a Fed that markets expect to hike by December.
Your decision points are concrete. Track Treasury yields, the 27-28 October Fed meeting and any SNB intervention signals. When the next move comes, check the heat map’s breadth: a franc row green across the board signals another haven rotation, while a lone cell suggests something specific to the pair.
This article is for informational purposes only and should not be considered financial advice. Investors should conduct their own research and consult with financial professionals before making investment decisions. Past performance does not guarantee future results. Financial projections are subject to market conditions and various risk factors.