Oil is climbing, yet US Treasury yields remain below the 5.31% close on 5 October, the highest 10-year finish since May 2002. The dollar has softened, and chip stocks are being sold hard. Many readers will see this as a war-inflation story, but the cross-asset signals are pointing somewhere else.
If oil were driving the market, bonds would be falling and yields would be rising. Instead, bond markets have been rallying on news about artificial intelligence (AI) revenue and Chinese memory chips.
That matters because the September Consumer Price Index (CPI), the main US measure of consumer inflation, is due later today. Consensus sits near +0.6% for the month and 3.6%-3.7% for the year. The read-through from OpenAI and CXMT may move bonds as much as the inflation print does.
Here is how to tell a growth and AI-valuation shock apart from an oil-driven inflation shock. You will also get a short checklist for reading bonds, oil, gold and the dollar together.
What actually hit the AI trade, and why was the Korean reaction so large?
The headline fear was simple: AI demand is cracking, and Chinese competition is arriving early. Look more closely and the two shocks are very different. One was mostly accounting. The other is a claim that nobody has yet proven.
OpenAI: a definitional gap, not a sales collapse
The Financial Times and Bloomberg reported that OpenAI’s annualised revenue was about $50B at the end of September. A figure of $68-70B had been circulating before that.
The gap appears to come from method rather than lost sales. The higher estimate reportedly counted gross revenue linked to partner companies. Some of that work came from investors trying to make OpenAI comparable with Anthropic. OpenAI’s own figure counts only its net share.
The underlying growth is still steep. According to CNBC, OpenAI’s investor presentation showed run-rate revenue rising from about $30B in July, with 77% third-quarter growth and 107% enterprise growth. The company has reportedly told investors it expects $70B+ by the end of 2026.
CXMT: a claim, not yet a product
CXMT President Cao Kanyu said the company plans to launch server memory before the end of 2026. The product would use a 4F² DRAM architecture, a denser layout for the dynamic memory chips that data centres rely on. The technical detail released so far is limited.
Before this becomes a real threat, CXMT still has to prove three things. It needs volume production at competitive yields, it needs customers to qualify the product, and it has to work within export-control limits.
| Asset | 13 October move | Note |
|---|---|---|
| SK Hynix | -10.09% | Foreign net selling of about 2.361 trillion won |
| Samsung Electronics | about -7.4% | Foreign net selling of about 1.3595 trillion won |
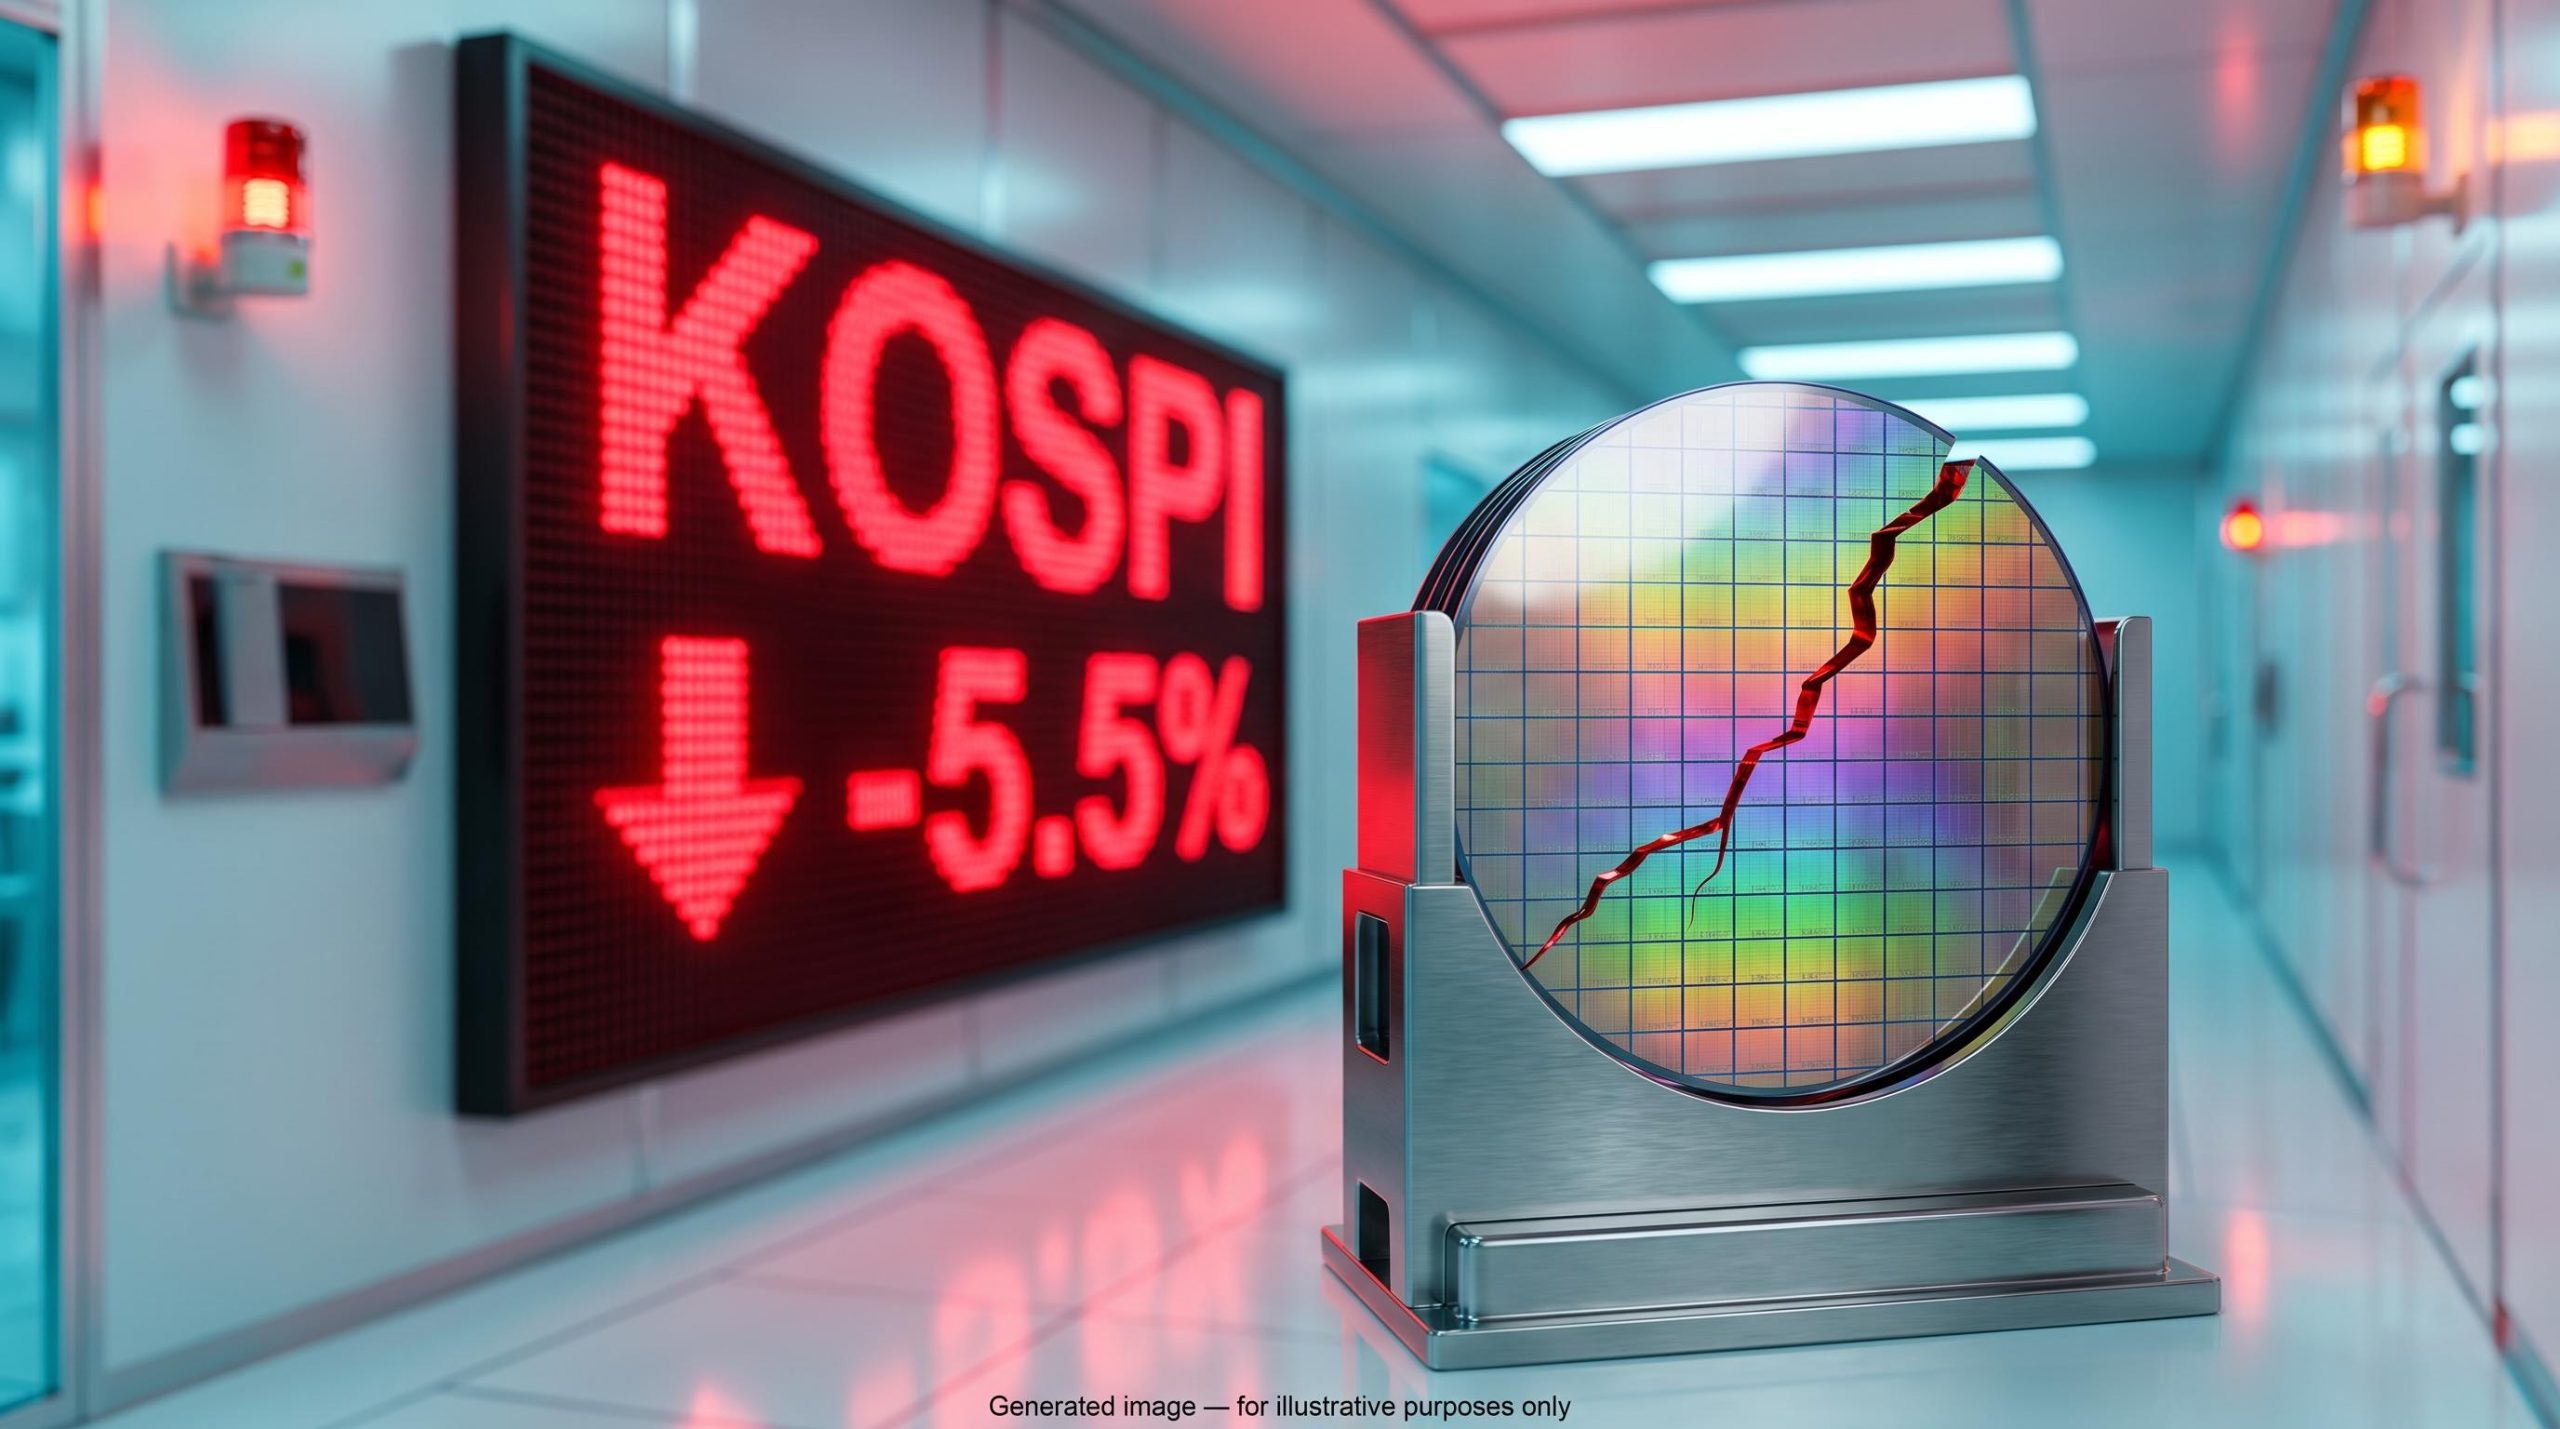
| KOSPI | about -5.5% | Followed a prolonged AI and memory rally |
Korea fell hard because investors were crowded into a long rally, and foreign selling made the drop bigger. In the US, the S&P 500 stayed range-bound. The Nasdaq looked weaker but has still made higher highs and higher lows since its late-July bottom. Reliable closing figures for the Nasdaq and the chip index were not available.
A crowded AI trade can reprice sharply without a fundamental break: the Philadelphia Semiconductor Index fell about 20.6% in July while the S&P 500 finished roughly flat, even as record inflows had poured into chip ETFs.
What this tells you is that markets sold the possibility of weaker AI demand and thinner memory margins. When prices assume perfection, even a partly definitional “miss” can move assets.
When big ASX news breaks, our subscribers know first
Why would yields fall while oil rises? Six ways to read the divergence
The usual assumption is that higher oil means higher inflation, and higher inflation means higher yields. That holds when strong demand pushes oil up. October’s oil move looks different. It has been driven by tanker attacks and risk around the Strait of Hormuz, and that kind of supply shock tends to hurt growth while it lifts prices.
Oil supply shocks tend to show up first in headline inflation, with core prices and wages signalling whether the pressure is spreading; that is why long yields can stay high even if crude eases.
| Asset | Latest level | Reference point | Source |
|---|---|---|---|
| US 10-year yield | about 5.223% (up ~6 basis points in that snapshot) | 5.24% prior Friday; 5.31% on 5 October | TradingKey, Investing.com |
| US 30-year yield | about 5.60% | about 5.67% on 7 October | Investing.com |
| Brent crude | about $103.70 | Briefly above $105.50 | Saxo Bank |
| WTI crude | about $94.20 | Up more than 1% | TradingKey |
| Dollar Index | about 102.24 | Down more than 0.32% | TradingKey |
A basis point is one hundredth of a percentage point. The sources captured different intraday windows, which is why one snapshot shows yields rising even though the broader trend sits below the peak.
Here are six possible explanations, ranked from best to least supported:
- Supply-driven oil: this fits if shipping disruption, not demand, keeps leading the oil headlines.
- Growth fear: this fits if defensive buying of Treasuries continues while chip stocks fall.
- AI-trade unwinding: this fits if selling spreads from AI equities into related credit.
- Safe-haven demand: this fits if bonds rally on geopolitical headlines rather than on data.
- Fed expectations: this fits if softer data keeps cutting the odds of a rate hike. Coverage on 6 October said a softer payrolls report had already done this.
- Positioning and technicals: this fits if the bond rally fades once short positions have been covered.
A caution on single sessions On 8 October, yields rose alongside oil early in the day, then reversed after a strong 30-year Treasury auction. One close proves very little.
When oil and yields diverge, ask which shock the bond market is pricing: inflation or growth. The answer tells you whether your bonds are working as a hedge or adding risk.
How do governments and AI hyperscalers compete for the same capital?
Start with a simple picture. There is a limited pool of global savings, and every borrower draws from it.
A long-term yield reflects two things. The first is expected inflation persistence. The second is the term premium, which is the extra return investors demand for locking money away for longer. Heavy borrowing from both governments and companies raises that extra return.
Hyperscalers are the giant cloud companies building AI data centres. According to Reuters, citing LSEG data, Amazon, Alphabet, Meta and Oracle issued about $194B of bonds through 7 July. That compares with roughly $108B in all of 2025. Increasingly, these companies are funding investment with debt rather than cash flow. The main institutional views:
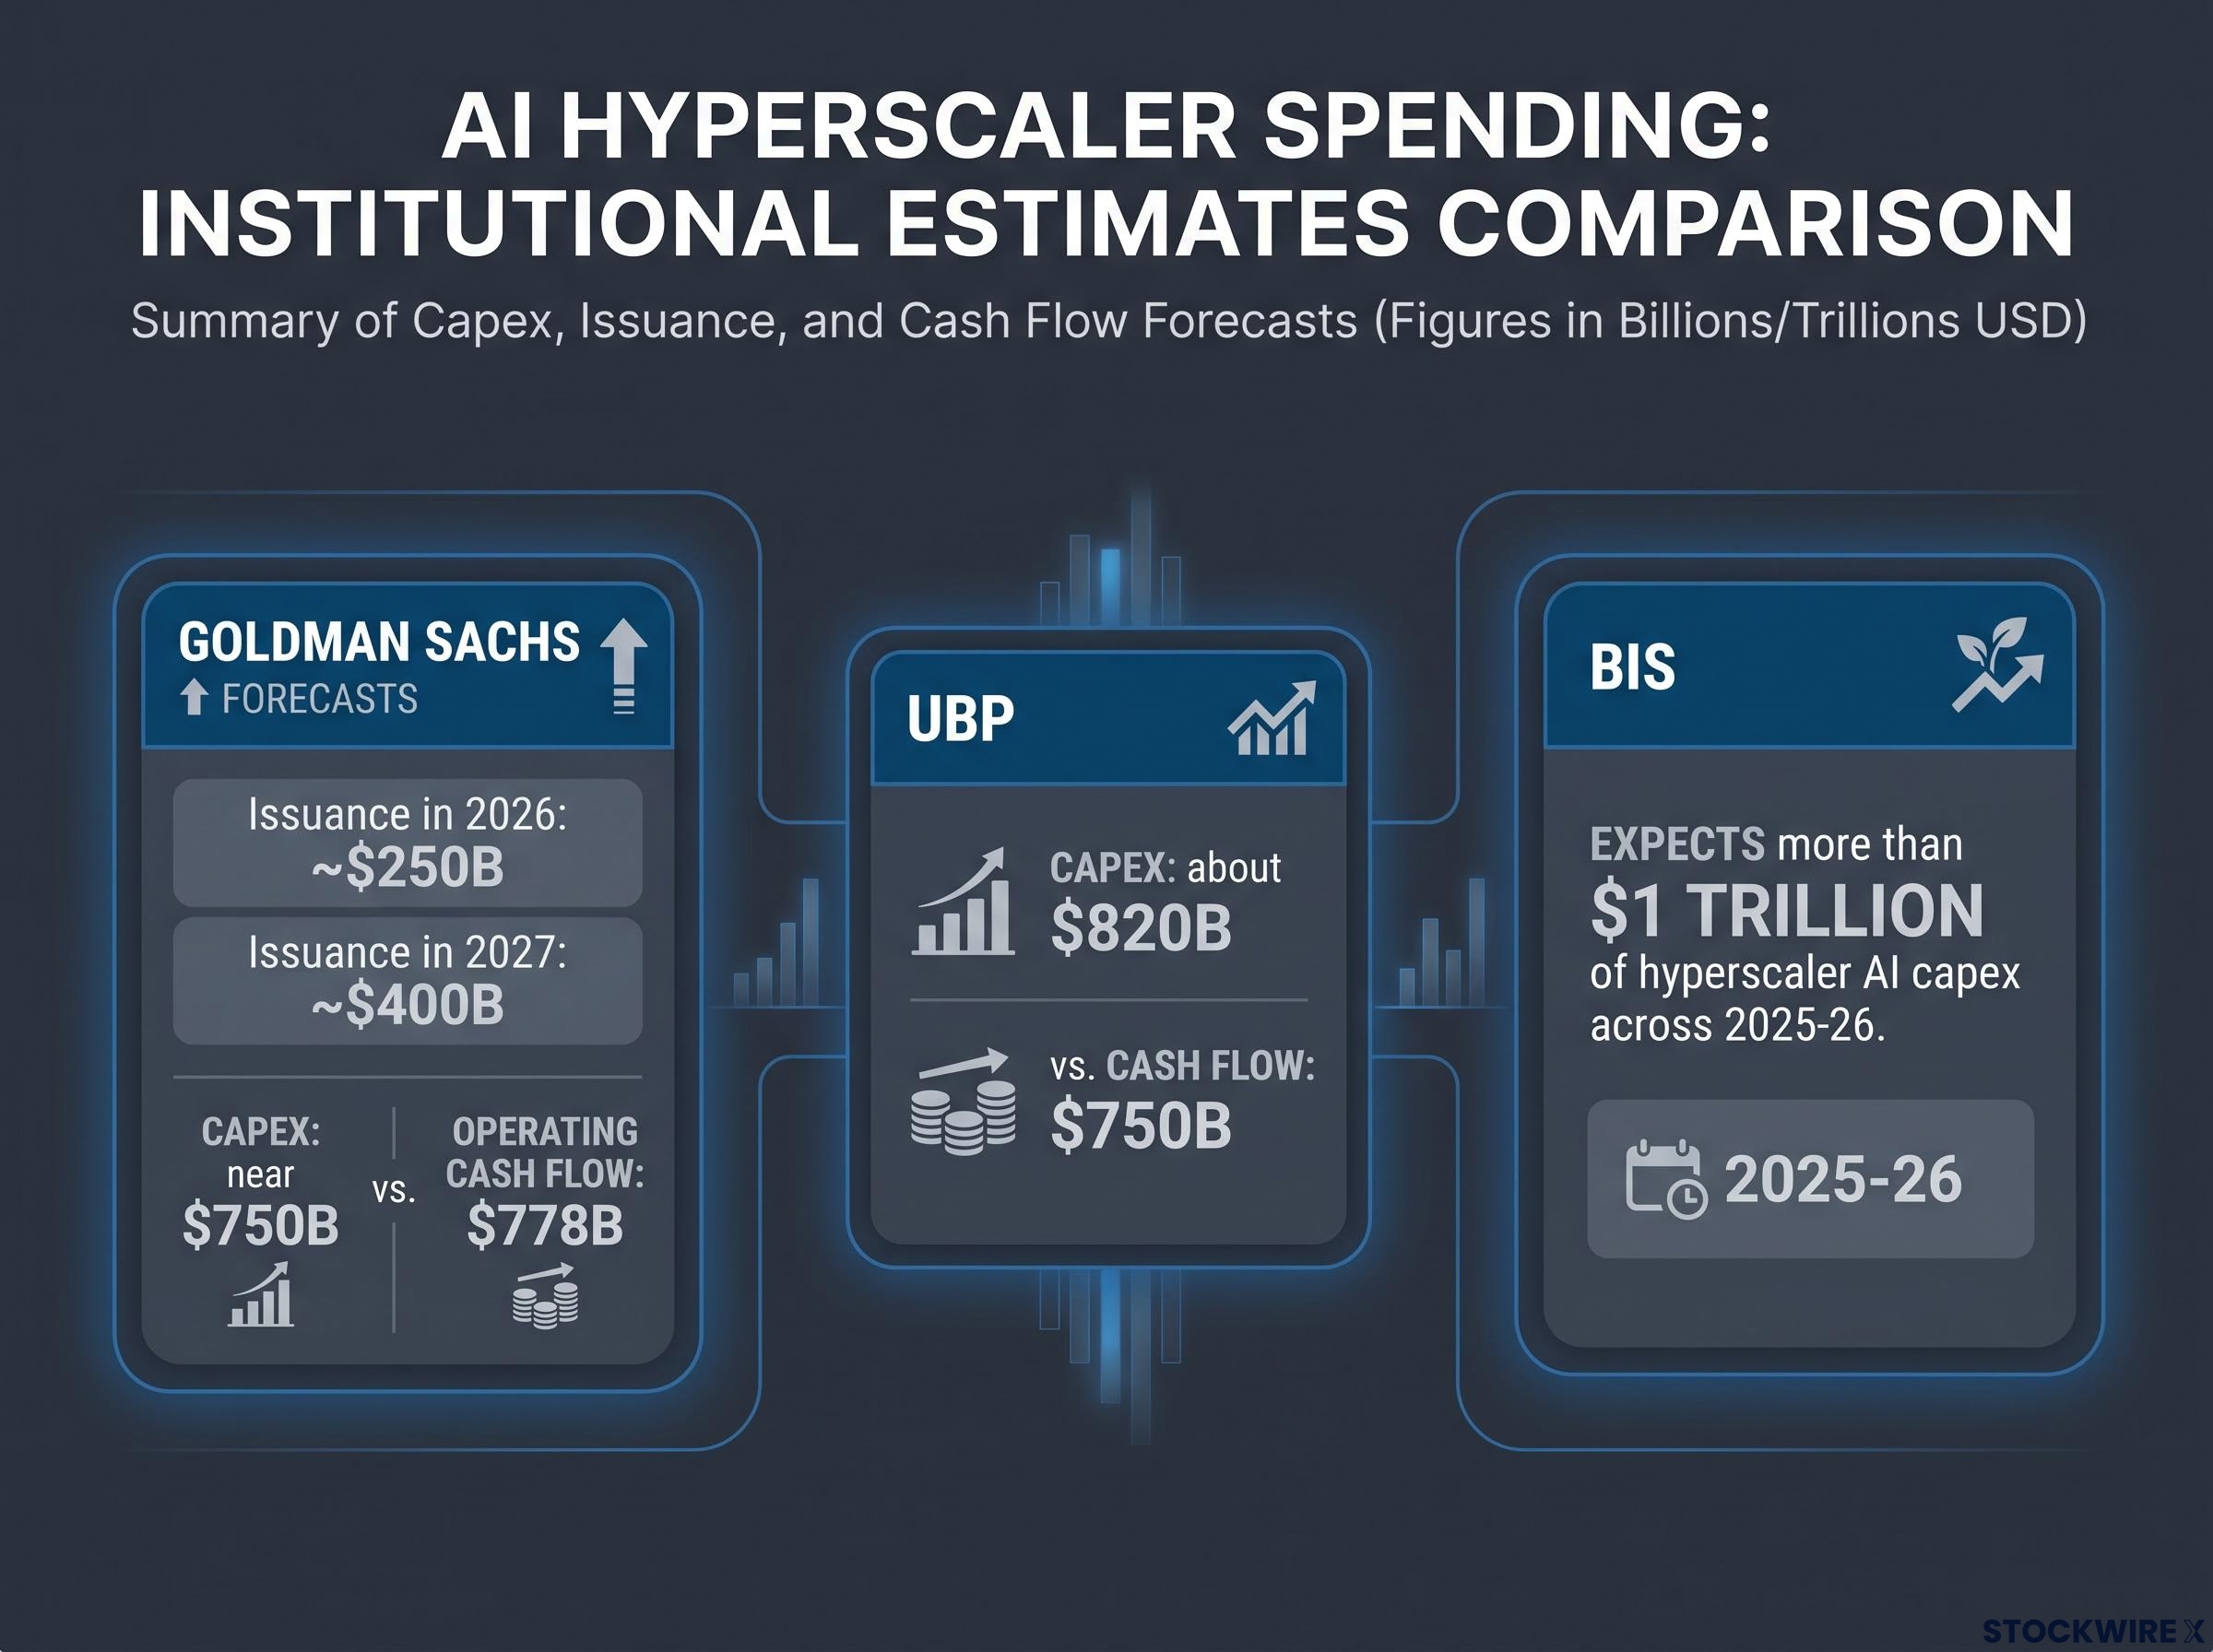
- Goldman Sachs: forecasts about $250B of issuance in 2026 and $400B in 2027, with capex near $750B against $778B of operating cash flow.
- UBP: puts capex at about $820B against $750B of cash flow. These estimates differ and should not be added together.
- Goldman Sachs Asset Management: says global AI-related debt is approaching $600B year to date, with about 40% from high-grade hyperscalers.
- BIS: expects more than $1 trillion of hyperscaler AI capex across 2025-26 and flags the debt as a financial-stability risk.
- Sceptics: argue the overlap with government bonds is smaller than the headline figures suggest.
The duration estimate Nuveen cites a Dallas Fed estimate that $300B of AI-related investment-grade issuance could create up to $360B of 10-year Treasury-equivalent duration supply in 2026.
Duration means sensitivity to interest-rate changes. Long-dated corporate debt therefore adds rate risk that investors must absorb, much as government bonds do.
The sceptic’s case
Corporate bonds are imperfect substitutes for Treasuries, and they often attract different buyers. Some issuance simply refinances debt that is maturing, and some of it is in euros or other currencies. Stronger productivity could also lift real yields for healthy reasons. The well-received 30-year auction on 8 October showed that strong demand can override the supply story, at least for a while.
For you, the key point is this. An AI slowdown could ease supply pressure at the long end and pull yields down. A healthy build-out could keep term premia high. Falling yields can be a warning about growth rather than a reward.
What to watch around CPI: reading bonds, oil, gold and the dollar together
Diagnosis only matters if you can test it. Today’s CPI print offers that test.
A hot headline number would support the oil-inflation story. Consensus is +0.6% monthly, compared with +0.4% in August, and 3.6%-3.7% annually, compared with 3.4%. A benign core figure would leave the growth-and-AI story in charge. Core is expected near 2.5% annually and about +0.2% monthly.
| Signal | Growth-fear reading | Inflation reading |
|---|---|---|
| Yields | Drift lower, stay below 5.31% | Retest the October peak |
| Dollar | Softer against the euro, Aussie and pound | Firms on hike expectations |
| Gold | Builds a base, tests $4,200 | Pressured by higher real yields |
| Oil | Rises without lifting yields | Rises alongside yields |
Gold, at about $4,154.99, keeps failing below $4,200. A breakout alongside a weaker dollar would support the bond signal. The original source commentator, Spac of Tasty Live, was long gold, bonds and oil (via options) and short the dollar against the Aussie, pound and euro. That is one trader’s view, not a recommendation.
Gold and the dollar often act as leading indicators for long-bond direction: a gold breakout combined with a softening dollar typically signals lower real-rate expectations ahead of Treasury price confirmation.
History shows how normal relationships between assets can break down. In the late-1990s tech and telecom cycle, credit and equities fell together. In the 2022 UK gilt episode, supply pressure and leveraged positioning overwhelmed the usual correlations.
Use this checklist on any data day:
- Identify whether oil is moving on supply or on demand.
- Check whether yields confirm or contradict the inflation story.
- Test that read against gold and the dollar.
- Wait for confirmation across several sessions before acting.
Where the evidence is thin
The intraday snapshots conflict with each other, and CXMT’s product is still unverified. The issuance totals cover different windows and are not additive. Oil also briefly topped $105 before easing, which shows how quickly a geopolitical premium can fade.
When several assets confirm the same story over several sessions, that is a stronger signal than any single close. When one asset disagrees, treat it as a prompt to question the dominant story.
What the divergence does and does not prove
The evidence suggests that growth and AI-financing concerns are competing with the war-inflation story. It does not prove crowding-out, and it does not confirm a lasting trend.
Three variables will decide which story wins. The first is the CPI core print. The second is the next round of hyperscaler issuance and capex updates. The third is any hard evidence that CXMT can produce at volume.
Your decision is not about predicting the next close. It is about whether your bond exposure is behaving as a hedge or as a risk. The positioning examples above are illustrative only.
For readers wanting the policy angle, our detailed coverage of Treasury yields and Fed policy explains why market-driven tightening reduces pressure for immediate hikes.
This article is for informational purposes only and should not be considered financial advice. Investors should conduct their own research and consult with financial professionals before making investment decisions. Past performance does not guarantee future results. Financial projections are subject to market conditions and various risk factors.