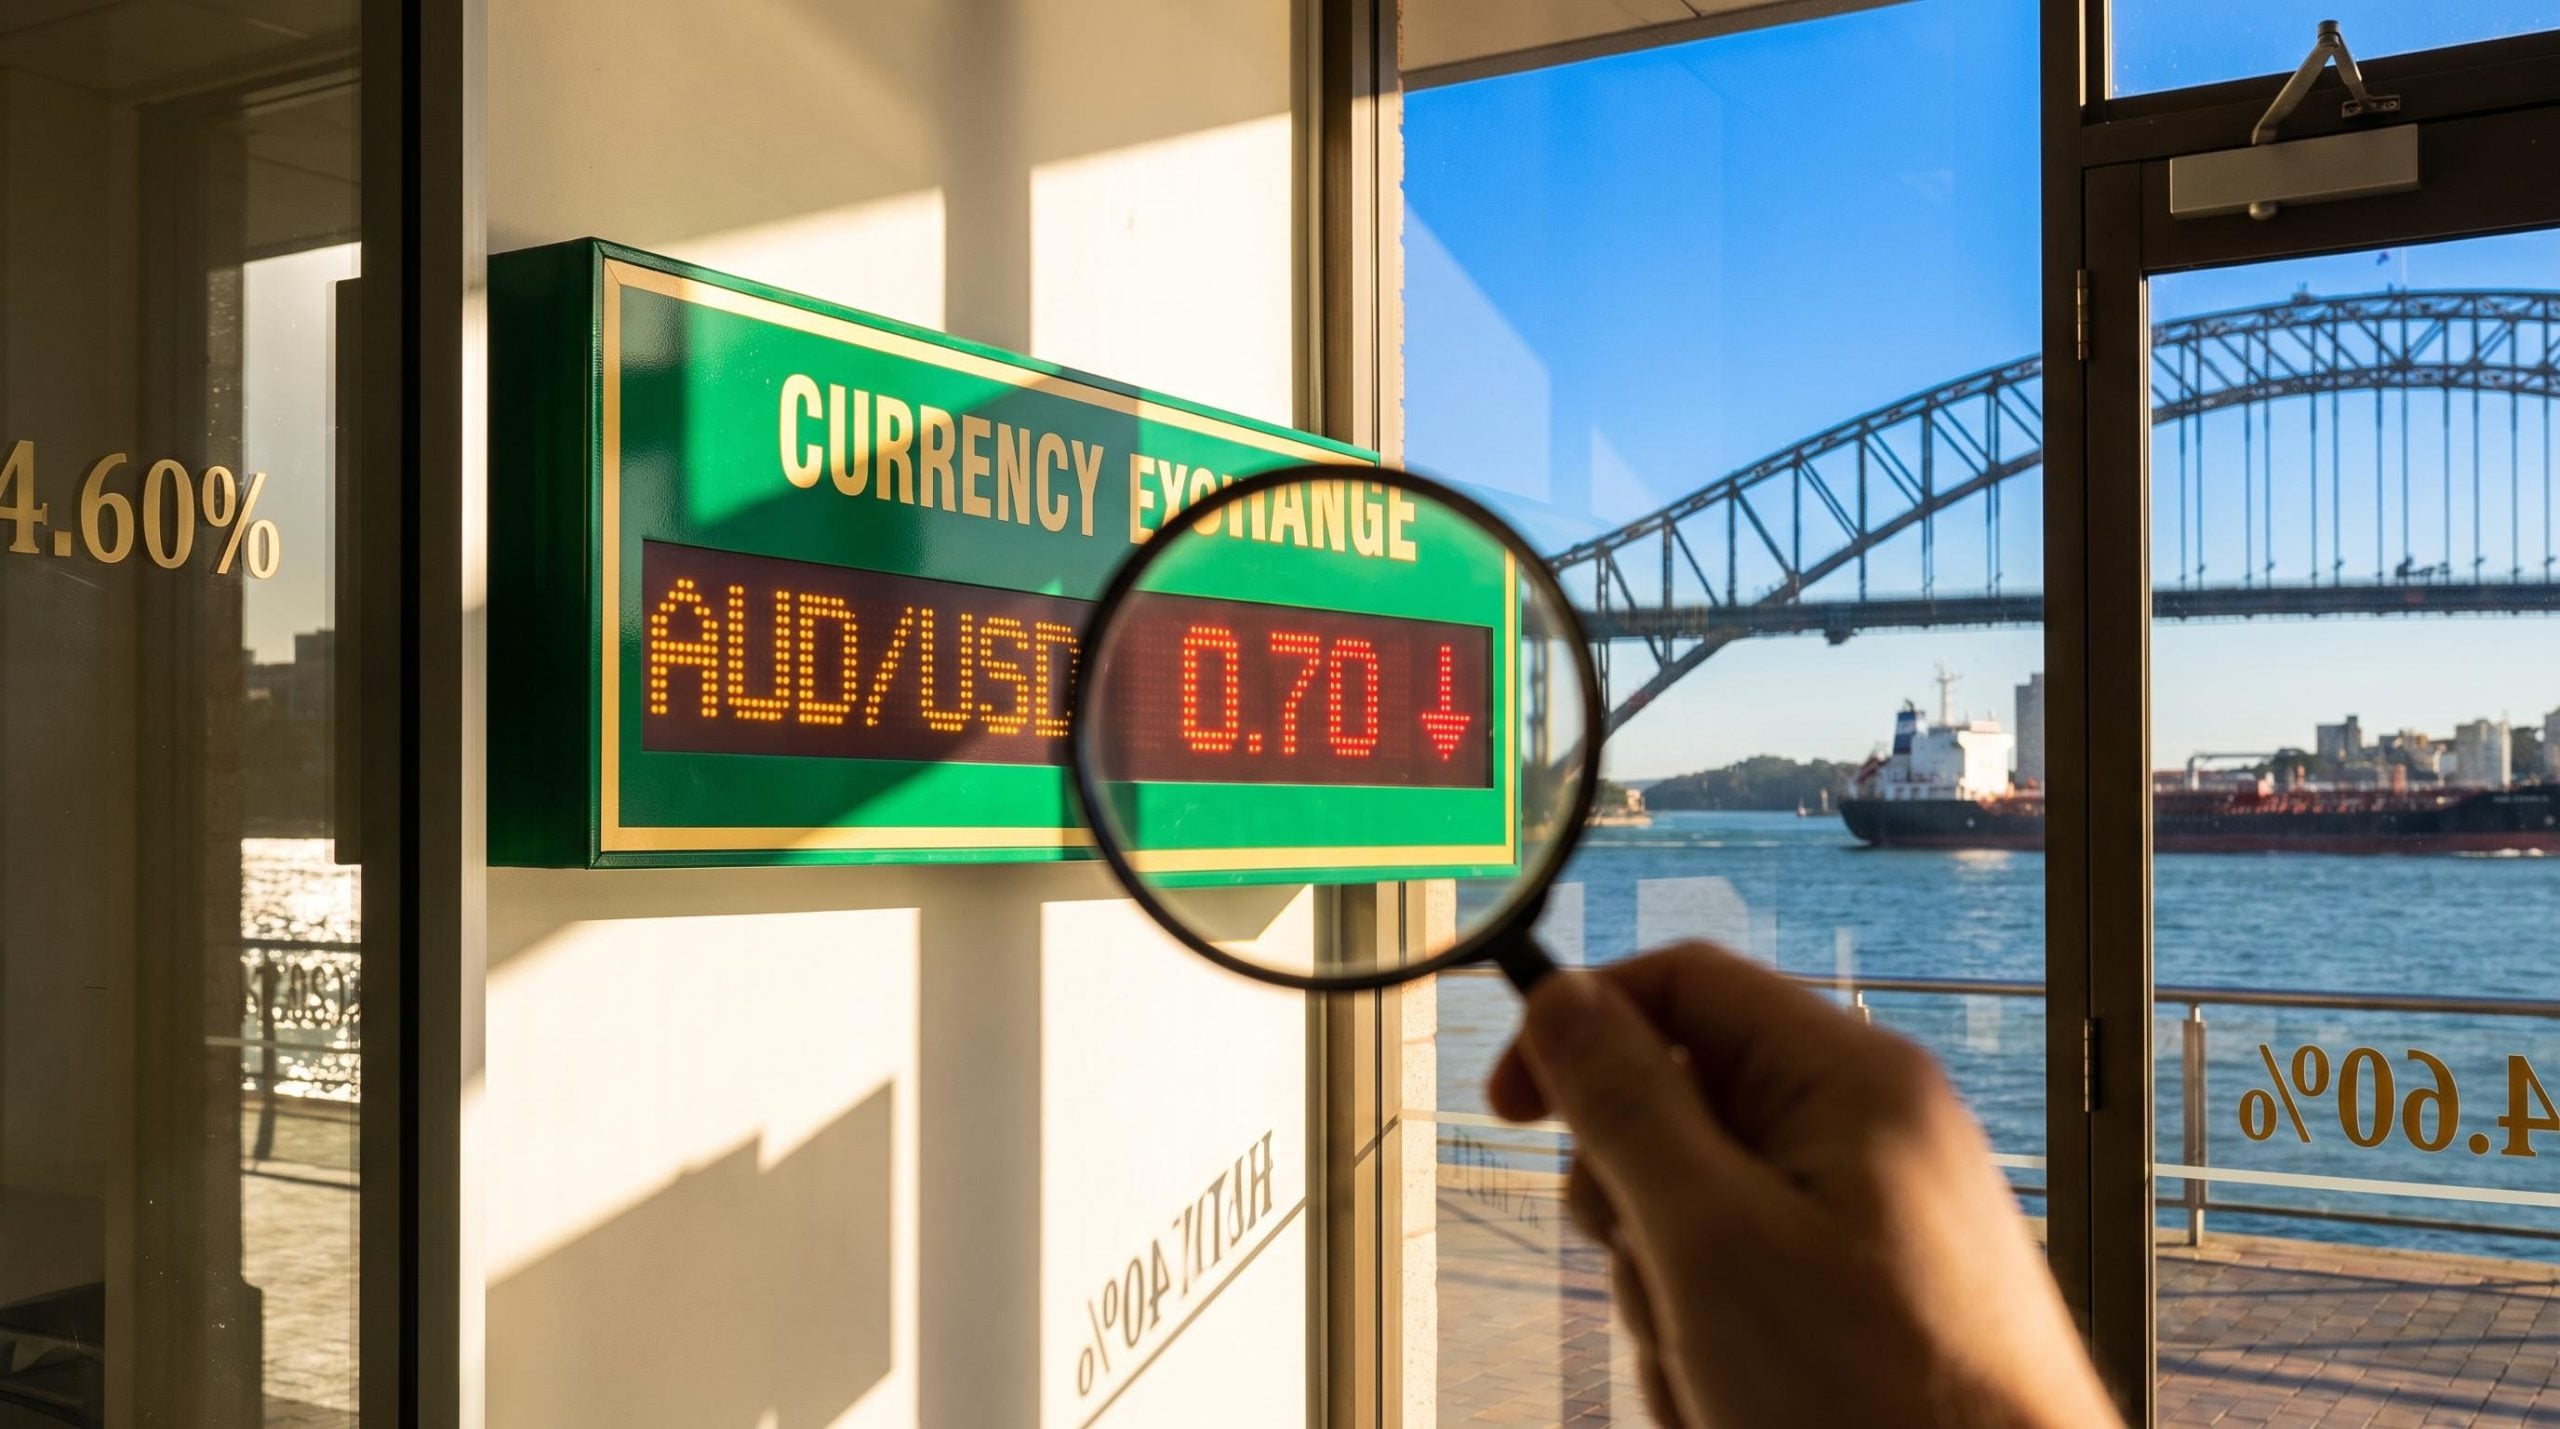
The US Dollar Index (DXY) touched 102.61 on 12 October, its highest level since April 2025. A reading like that usually gets filed as proof that the trend is intact. Yet by 13 October the index had slipped to 102.29 as oil eased, which suggests the rally rests on a chain of headlines more than on settled conviction, and that matters for any US dollar forecast you build from here.
Three forces are pulling on the greenback at once. Middle East escalation is driving safe-haven demand, the Federal Reserve raised its target range to 3.75%-4.00% in September, and energy-linked inflation is keeping further tightening on the table.
Elsewhere, the Reserve Bank of Australia (RBA) at 4.60% and the Bank of Japan (BOJ) at 1.25% are fighting very different battles. If you hold currency exposure and treat the dollar as a one-way trade, those differences can catch you out.
Here is a framework for telling the dollar’s cyclical drivers apart from its structural ones, plus the dates and triggers most likely to change the picture.
Why is the dollar holding at 18-month highs?
Start with the number on the screen. Reuters tied the 12 October high directly to weekend attacks in the Middle East, including Iran-backed Houthi attacks on Saudi Arabia and strikes on two oil tankers, and to the caution that followed among investors.
One day, two readings DXY hit 102.61 on 12 October, then eased to 102.29 on 13 October as oil and bond yields retreated (Reuters; research-reported figures).
That one-day swing is the clue. Underneath the headline level sit four separate mechanisms, and they do not share the same staying power:
- Safe-haven flows: Driven by geopolitical stress. Cyclical.
- Rate differentials: Driven by the Fed’s hike bias versus other central banks. Cyclical.
- Energy-driven inflation: Driven by oil prices feeding inflation expectations. Cyclical.
- Dollar liquidity and infrastructure: Driven by the dollar’s role in trade, debt and hedging. Structural.
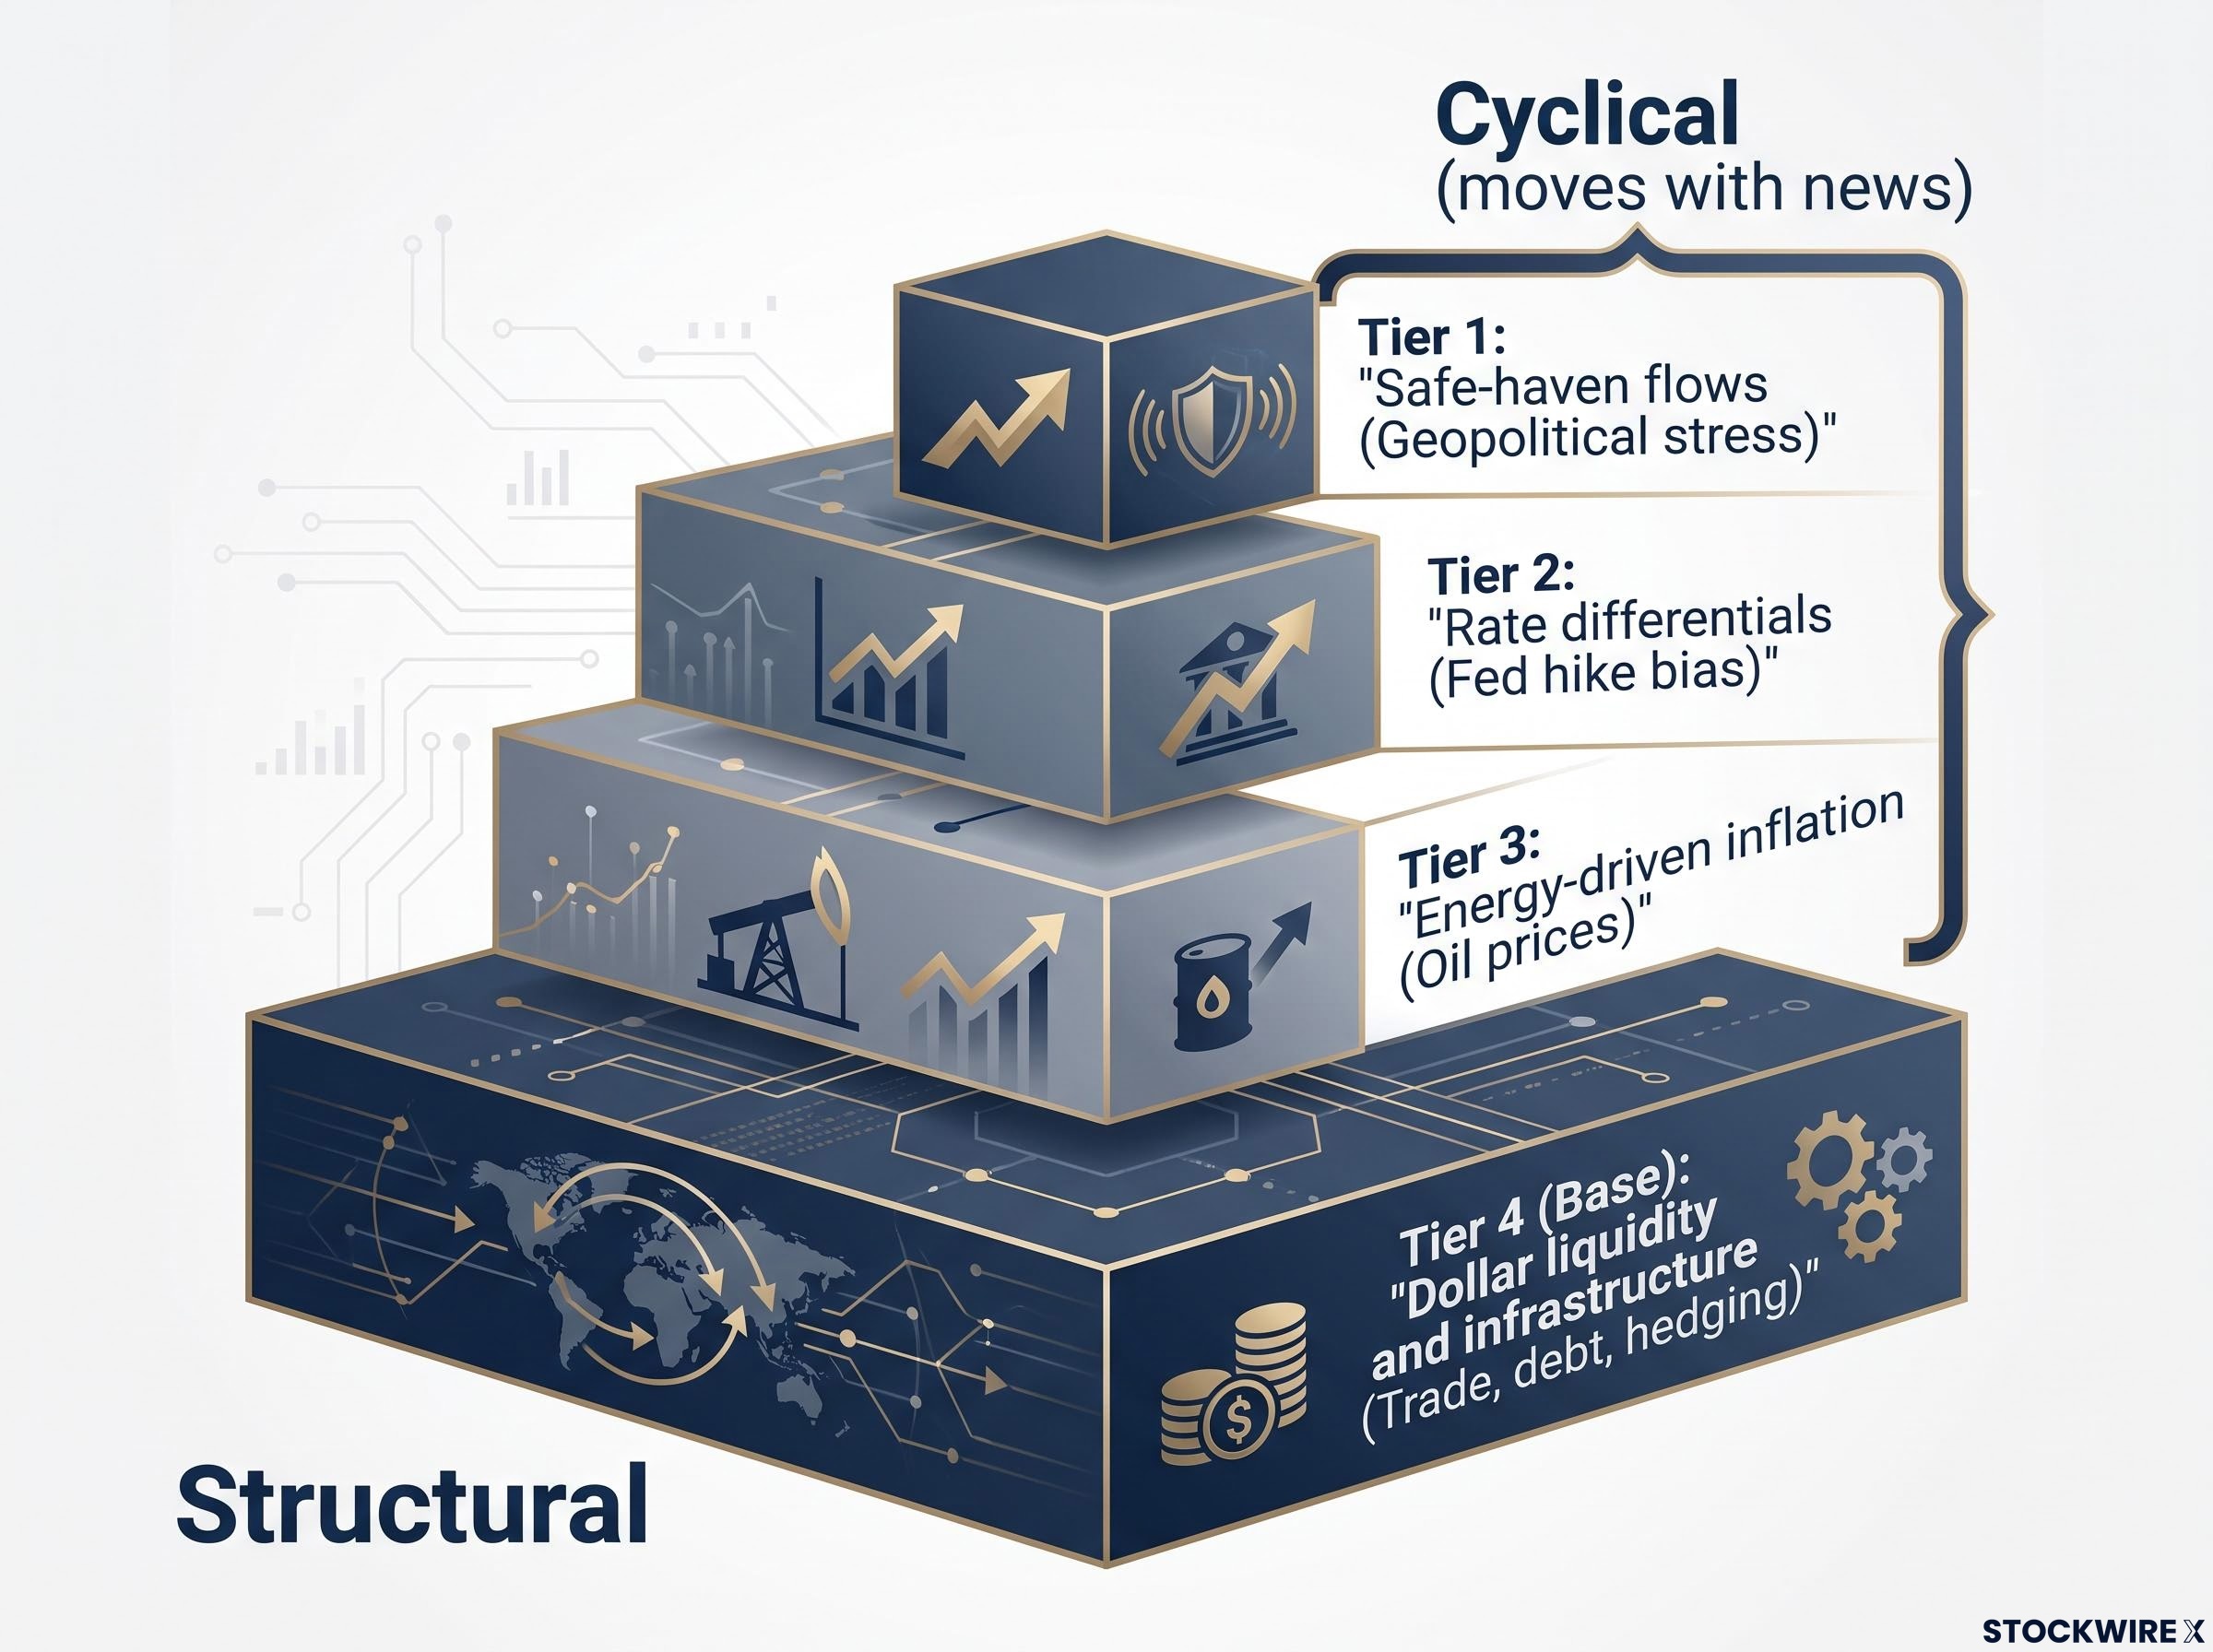
Cyclical drivers
The first three layers move with the news. The Fed lifted rates by 25 basis points at its 15-16 September meeting, with August personal consumption expenditures (PCE) inflation, a measure of price changes in consumer spending, running at 3.4% headline and 3.0% core. Brent crude rose to about $107.17 on 12 October.
According to FXStreet, the dollar’s defensive appeal and expectations of tighter US policy tied to energy-linked inflation kept supporting the greenback. Each of those supports can weaken within a single session if oil falls or the Fed sounds less hawkish.
The current rally traces back to the moment three forces converge in September: a unanimous Fed hike, a sharply higher dot plot, and Middle East tanker strikes that layered safe-haven demand onto a yield-driven move.
Structural supports
The fourth layer is slower. The Bank for International Settlements (BIS) points to network effects, invoicing practices, dollar borrowing and hedging infrastructure as reasons the dollar stays the anchor currency.
The read you should take from this is that the rally is cyclical strength sitting on a structural floor. When a headline lands, ask which layer it hits: a tanker attack moves the top layer, not the foundation.
When big ASX news breaks, our subscribers know first
How do dollar structure and reserve trends shape any US dollar forecast?
Many readers hold one of two views: the dollar’s dominance is permanent, or it is about to collapse. The evidence supports neither extreme.
The dollar can rise even when US economic data looks uneven, because so much of the world runs on it. The BIS highlights several supports:
- Invoicing: A large share of global trade is priced in dollars.
- Dollar funding: Many foreign companies and governments borrow in dollars.
- Hedging: Currency risk is commonly managed through dollar-based contracts.
- Reserve management: Central banks hold dollars as a store of value.
Network effects tie these together. A network effect means something becomes more useful the more people use it, so each new user reinforces the dollar’s role.
The dollar’s global dominance is visible in currency trading itself: it sits on one side of roughly 89% of all FX trades, far above its share of world trade, which helps explain why it can rally even on uneven US data.
Consider a foreign company that borrowed in dollars. When a geopolitical shock hits and lenders pull back, that company still has to repay in dollars, so it buys them regardless of how US growth looks. The BIS flags exactly this risk for dollar borrowers during geopolitical shocks, and that scramble for dollars can lift the currency in the middle of a crisis.
Reserve share, per the BIS The dollar’s share of global foreign exchange reserves fell from 62% in 2012 to 57% in 2025.
That is real erosion, but it is gradual diversification rather than abrupt replacement. IMF monitoring work, as cited by the BIS, found that network externalities make the system durable and slow to change, even as the falling share signals pressure on dominance.
A five-point decline over 13 years tells you structural change is happening at a pace measured in years. It should not drive your trading horizon the way an oil spike or a Fed decision does.
What is the RBA doing differently, and what does it mean for AUD/USD?
Here is the paradox. The RBA raised its cash rate by 25 basis points to 4.60% on 30 September, yet the Australian dollar sat around 0.6960 against the greenback on 12 October after failing to hold 0.7000.
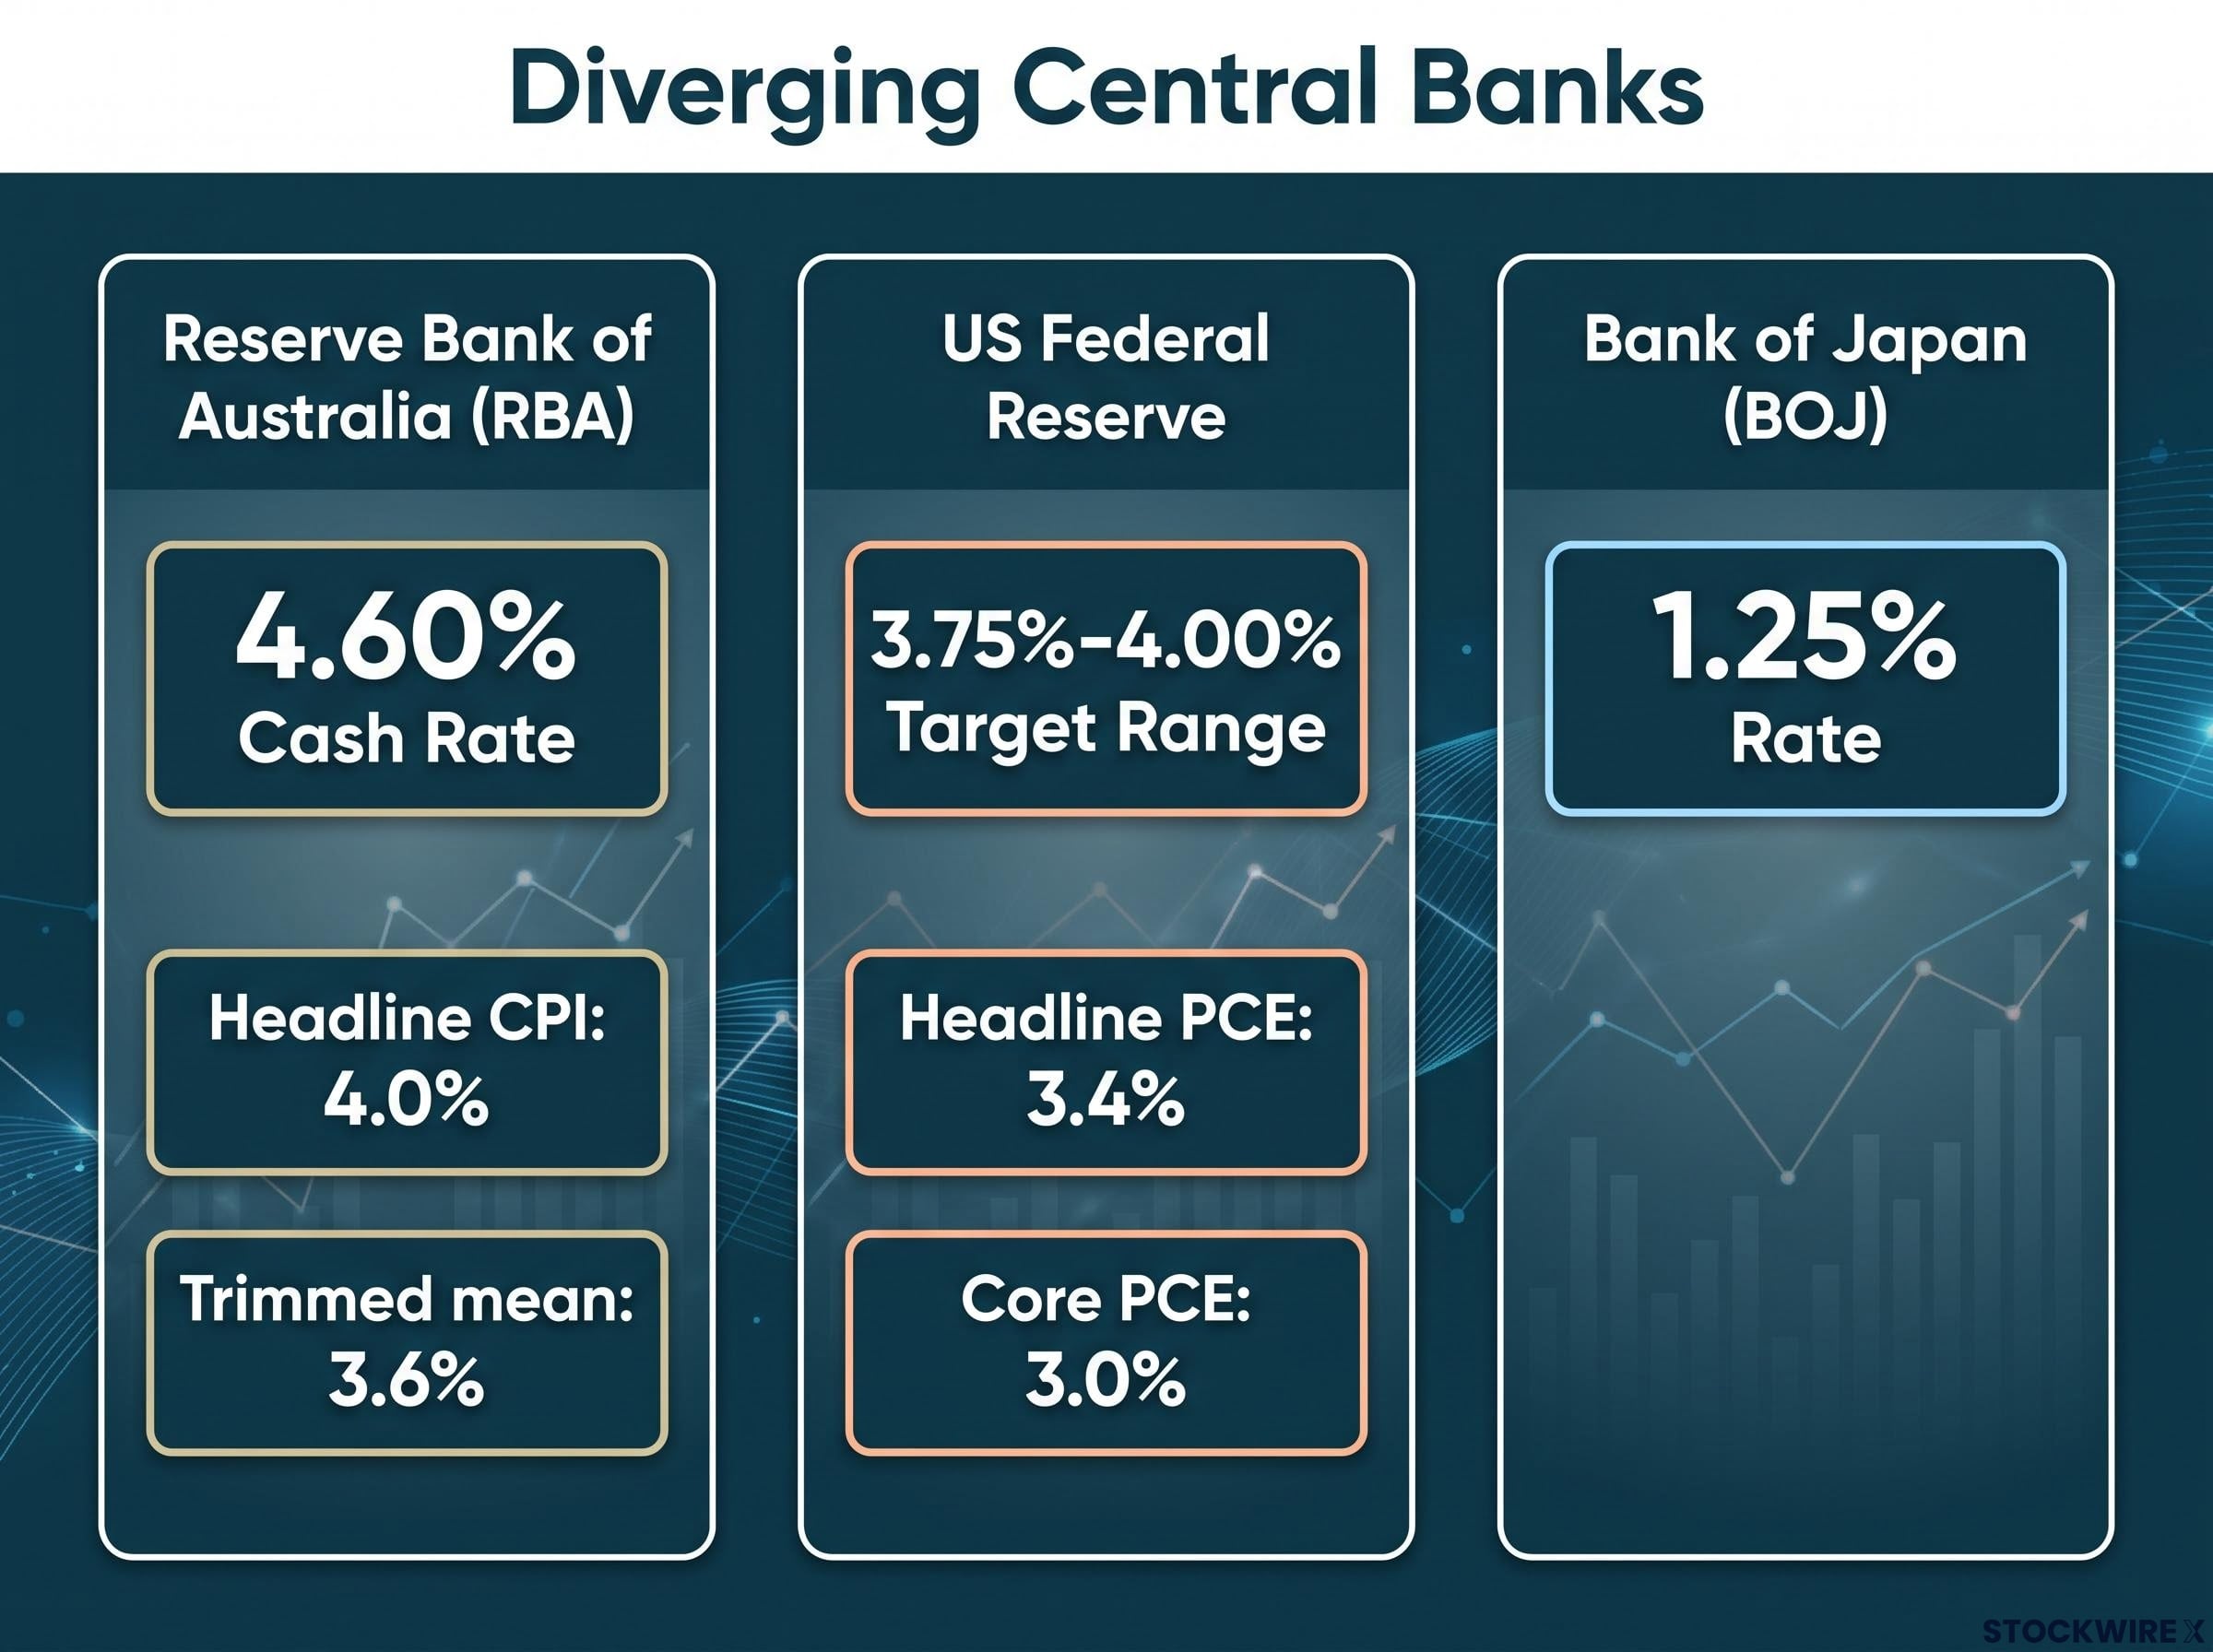
The inflation data explains why the RBA moved. Headline CPI rose to 4.0% year-on-year in August from 3.5%, while the trimmed mean, a measure that strips out the most extreme price moves, held at 3.6%. The ABS said fuel and electricity accounted for much of the gap, and underlying inflation has stayed above the 2-3% target band for more than 12 months.
Commerzbank’s Volkmar Baur pointed to RBA concern that a weaker currency could accelerate imported inflation, particularly if overseas borrowing costs rise faster than domestic ones. That fear helps explain the RBA’s readiness to keep tightening.
Institutional views have moved around considerably. They were made at different times and are not directly comparable:
| Institution | Date of view | Stance | AUD/USD forecast |
|---|---|---|---|
| RBA | August 2026 | Cash rate rising modestly, then easing toward about 4.4% (since overtaken) | Not specified |
| NAB | September 2026 | Upside inflation risks crystallised; November hike possible | About 0.70 by end-2026 |
| NAB | February 2026 | AUD supported by rate differential, commodities and a weak dollar | As high as 0.73 by end-2026 |
| Westpac | December 2025 | More cautious on tightening; room for cuts if jobs weakened sharply | Not specified |
NAB trimming its target from 0.73 to about 0.70 in seven months shows how fast forecasts shift. Rate support alone has not been enough to overpower renewed dollar strength.
The next tests:
- 28 October 2026: Australian CPI release
- 3 November 2026: RBA policy decision
If you hold AUD exposure, those two dates will tell you more than the headline cash rate does.
Could the yen force the next dollar reversal?
USD/JPY traded around 158.20 on 13 October, after consolidating near 158.50 the day before (sources differ slightly on timing). That leaves the pair close to the level Tokyo appears to care about most.
A caveat on ¥160 Markets watch roughly ¥160 per dollar as an intervention trigger, but Japanese authorities have never formally announced it.
The signals have been escalating in steps:
- Verbal warnings: The finance minister warned in June of “decisive action” against excessive volatility, and senior currency diplomat Mimura urged markets in September to heed a “very clear” warning.
- Rate checks: Reuters reported officials contacted dealers to check prices, often read as a precursor to action.
- Intervention: Reuters reported a large yen-buying operation on 30 July 2026, later linked to Japan-US coordination. Finance Minister Katayama said on 24 September that the principles behind that coordination remain in force.
The BOJ’s rise to 1.25% should help the yen in principle, but its guidance was not hawkish enough to draw buyers. The US-Japan yield gap stays wide, which is why intervention can trigger a sharp rally without changing the trend.
There is also a constraint. Japan funds intervention partly by selling US Treasuries, which can push US yields higher and, paradoxically, support the dollar.
If you hold yen exposure or import into Japan, the risk near ¥160 is a sudden, violent move against the trend. Plan for volatility rather than direction.
Investors exploring how Tokyo decides when to act will find our deep-dive into USD/JPY intervention triggers, which explains why the speed of the move toward 160 matters more than the level itself.
What could break the dollar’s run, and how should you weigh it?
The bull case is clear: geopolitical risk, firm oil and a hawkish Fed. The competing case is just as well defined, and it showed up within days.
On 9 October, Brent fell to about $102.60 after President Trump said the US would not attack Iran before the US elections. Three days later, renewed attacks sent it back above $107. Then on 13 October the dollar eased again as Brent slipped to about $105.20 and yields fell. Oil and the dollar have been moving together, in both directions.
Oil and Treasury yields have been reinforcing each other, with Brent above $100 and a heavy 10-year auction pushing yields higher, while the euro’s heavy weighting in the index means much of the move is effectively a euro story.
Risks to the dollar
Some of the figures below have not been independently verified:
| Risk | Trigger | Likely effect on dollar |
|---|---|---|
| De-escalation | Contained Middle East conflict, lower oil | Unwinds safe-haven premium |
| Soft US data | US CPI on 14 October undershooting | Cuts Fed-hike expectations |
| Fed over-tightening | Weakening jobs or activity | Hike bias reverses, yield support fades |
| Technical overextension | Resistance near 103 holds (Standard Chartered) | Consolidation or pullback |
| Forecast uncertainty | Repricing of inflation or commodities | Two-way volatility |
The Fed minutes released on 7 October showed most officials saw another hike as possibly needed before year-end. Markets priced a likely pause at the 27-28 October meeting and a possible move at 8-9 December.
Ranked for the coming weeks, oil and geopolitics sit first, US inflation data second, and Fed messaging third. Because the rally rests on headlines that can reverse within a day, size any dollar position to survive a pullback toward 102 rather than assume continuation.
What it means by reader type
- Investors: Near-term bias favours the dollar, but DXY at 102-103 looks stretched.
- Australian investors: AUD near 0.6960 is caught between RBA support and dollar strength.
- Japanese importers: Waiting for a break through ¥160 risks intervention whiplash.
- US importers and dollar borrowers: A strong dollar lowers import costs but tightens conditions for foreign borrowers with dollar debts.
- Energy importers: A joint oil and dollar rally hurts most, and a joint retreat can ease pressure quickly.
Past performance does not guarantee future results, and these scenarios are speculative and subject to change as markets develop.
Reading the dollar outlook through the next two central bank meetings
The dollar’s strength is cyclical on a structural base. Geopolitics, oil and Fed expectations do the heavy lifting, while dollar infrastructure keeps a floor underneath. The RBA and the BOJ act as contrasting counterweights, one through rate support and the other through the threat of intervention.
Your watch-list:
- 14 October: US CPI
- 27-28 October: FOMC meeting
- 28 October: Australian CPI
- 3 November: RBA decision
- 8-9 December: FOMC meeting
- Ongoing: Brent crude and USD/JPY near ¥160
The near-term bias favours the dollar while these risks stay elevated. It is also extended, and de-escalation could pull it back quickly.
This article is for informational purposes only and should not be considered financial advice. Investors should conduct their own research and consult with financial professionals before making investment decisions.