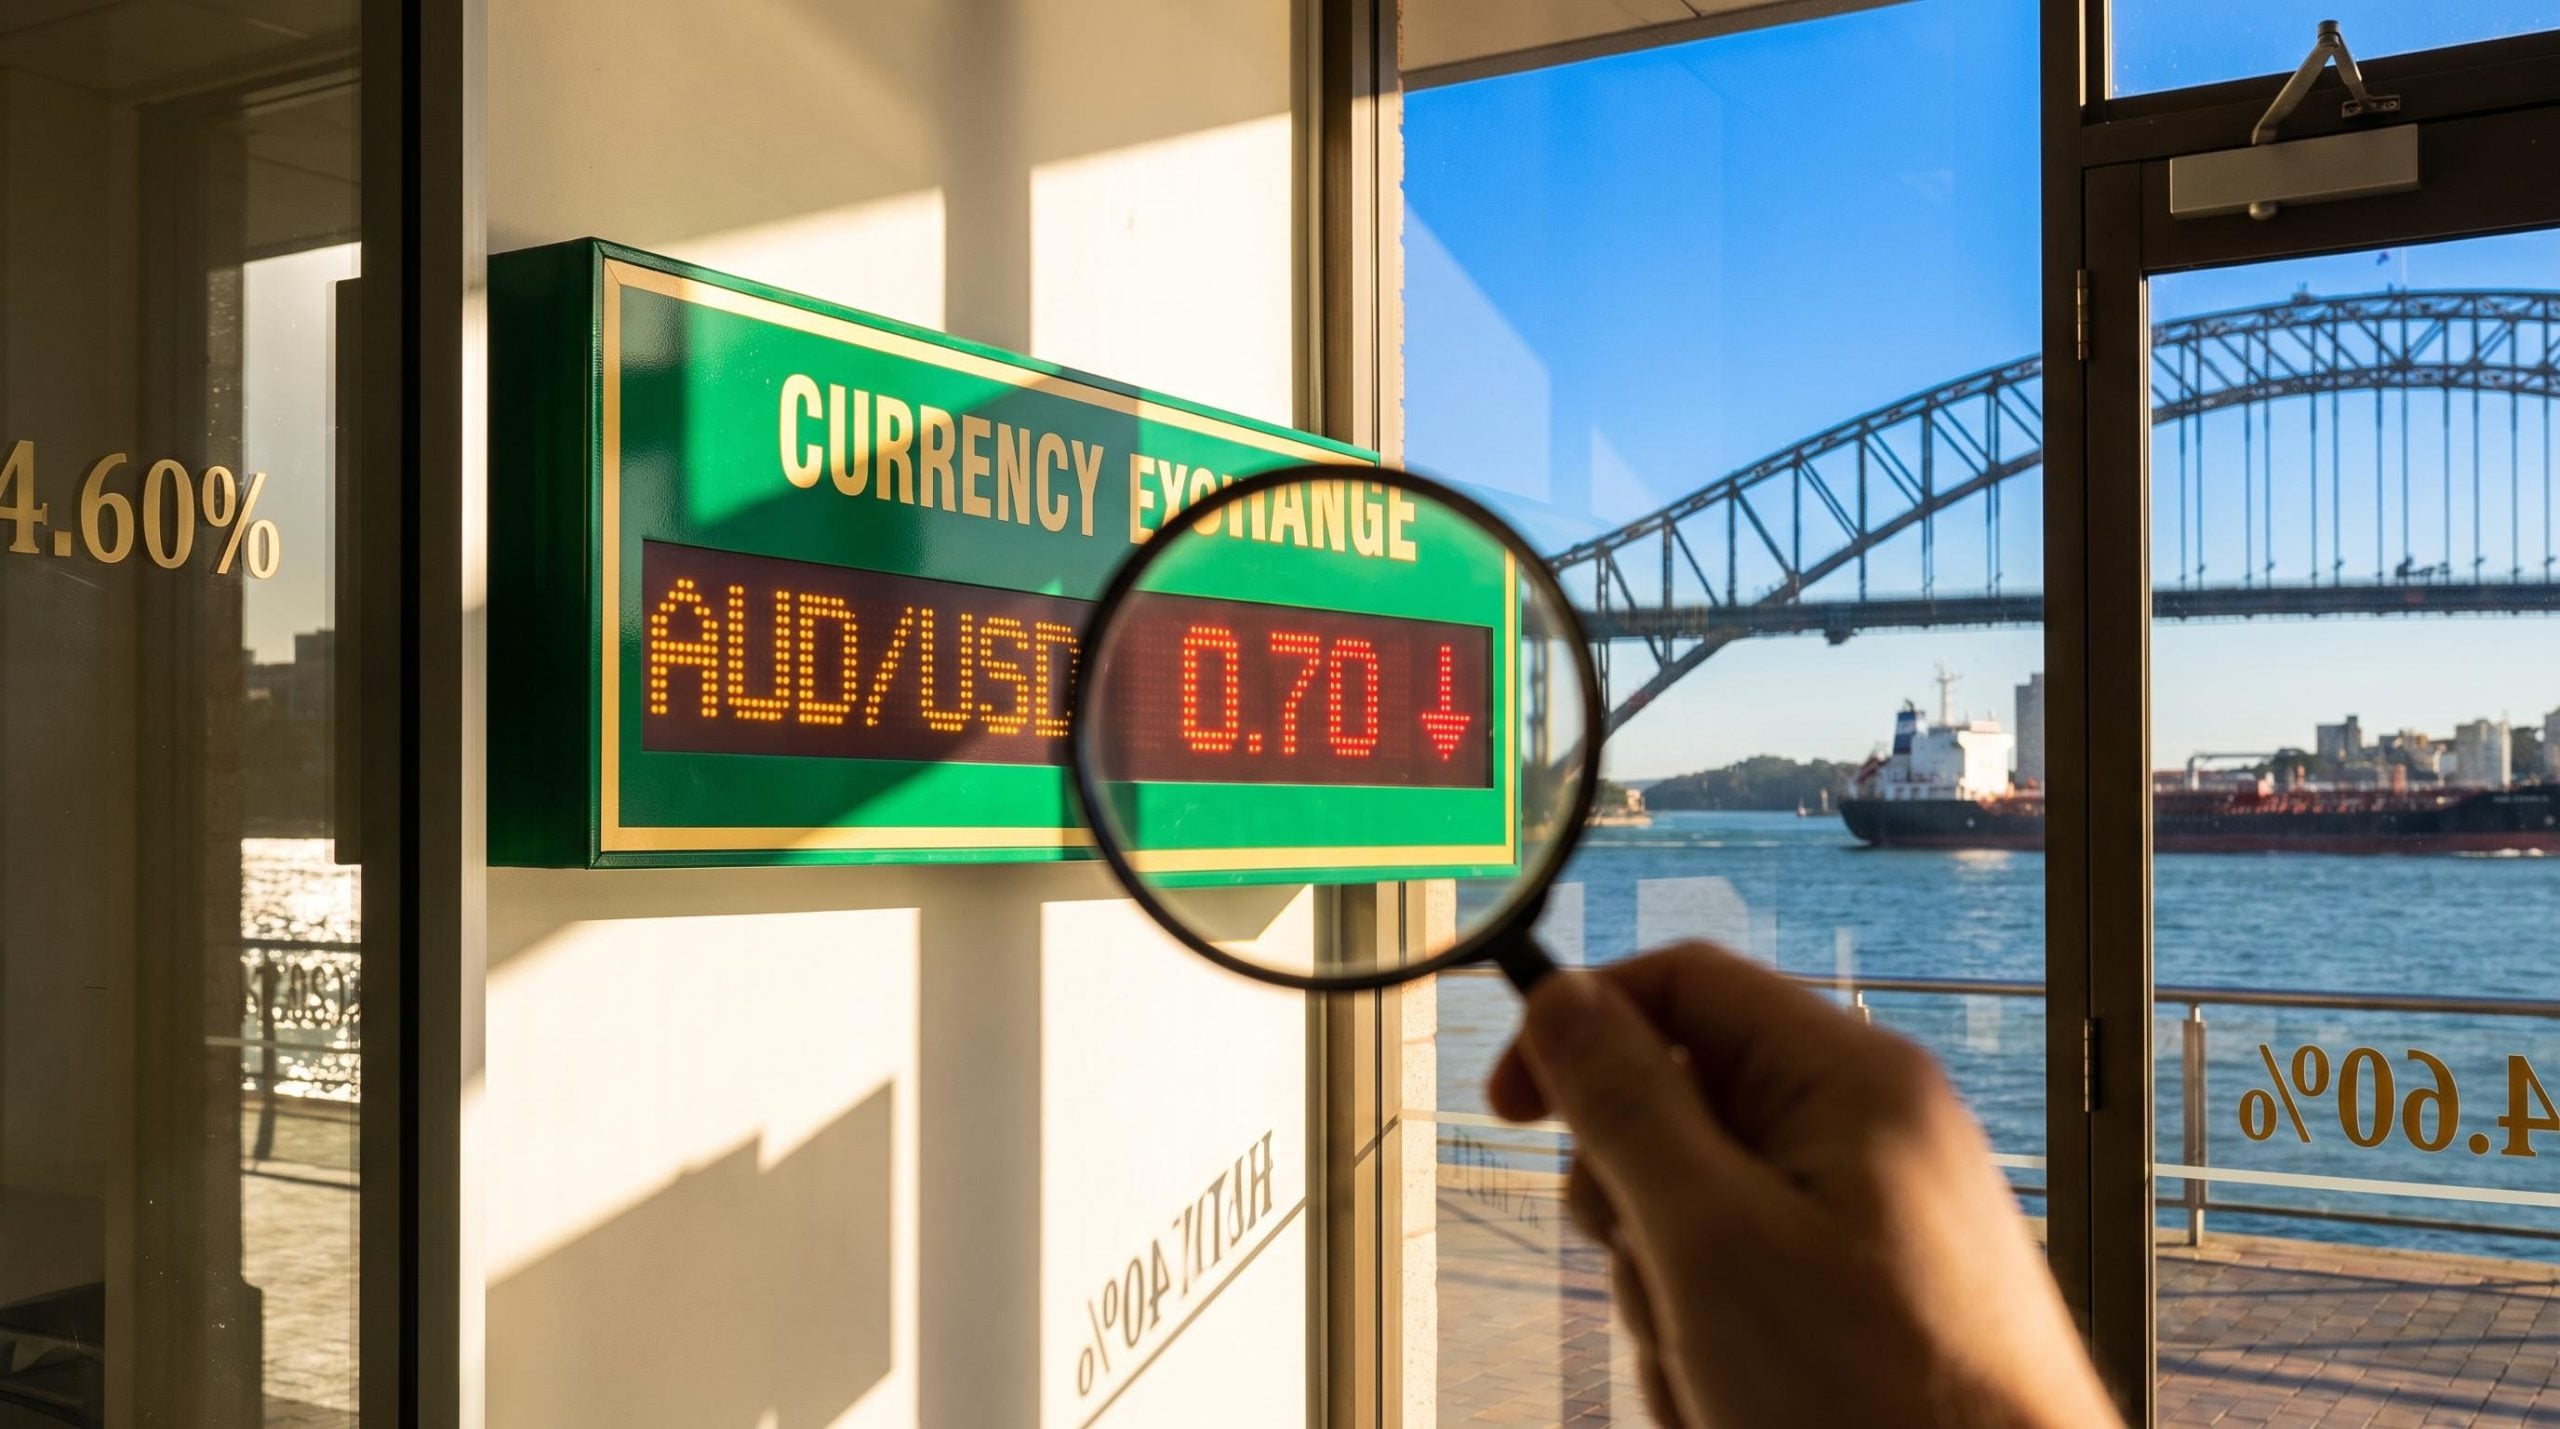
The Reserve Bank of Australia (RBA) has lifted the cash rate to 4.60%, and its minutes left the door open to further increases. Yet on Tuesday 13 October 2026, the Australian dollar slipped against the New Zealand dollar, euro, pound, yen and Swiss franc. That gap between a hawkish central bank and a soft currency sits at the centre of any honest AUD/USD forecast right now.
The pair sat at 0.6961 at the RBA’s 4:00 p.m. fix, after touching about 0.6976 in European trade. Two tier-one data releases land within the next 48 hours: US inflation tomorrow and Australian jobs on Thursday.
If you read RBA tone in isolation, you risk misjudging where the currency goes next. This analysis gives you one framework linking RBA policy, US yields, the neutral-rate debate, this week’s data and the chart levels that matter.
Why is the Australian dollar slipping when the RBA sounds hawkish?
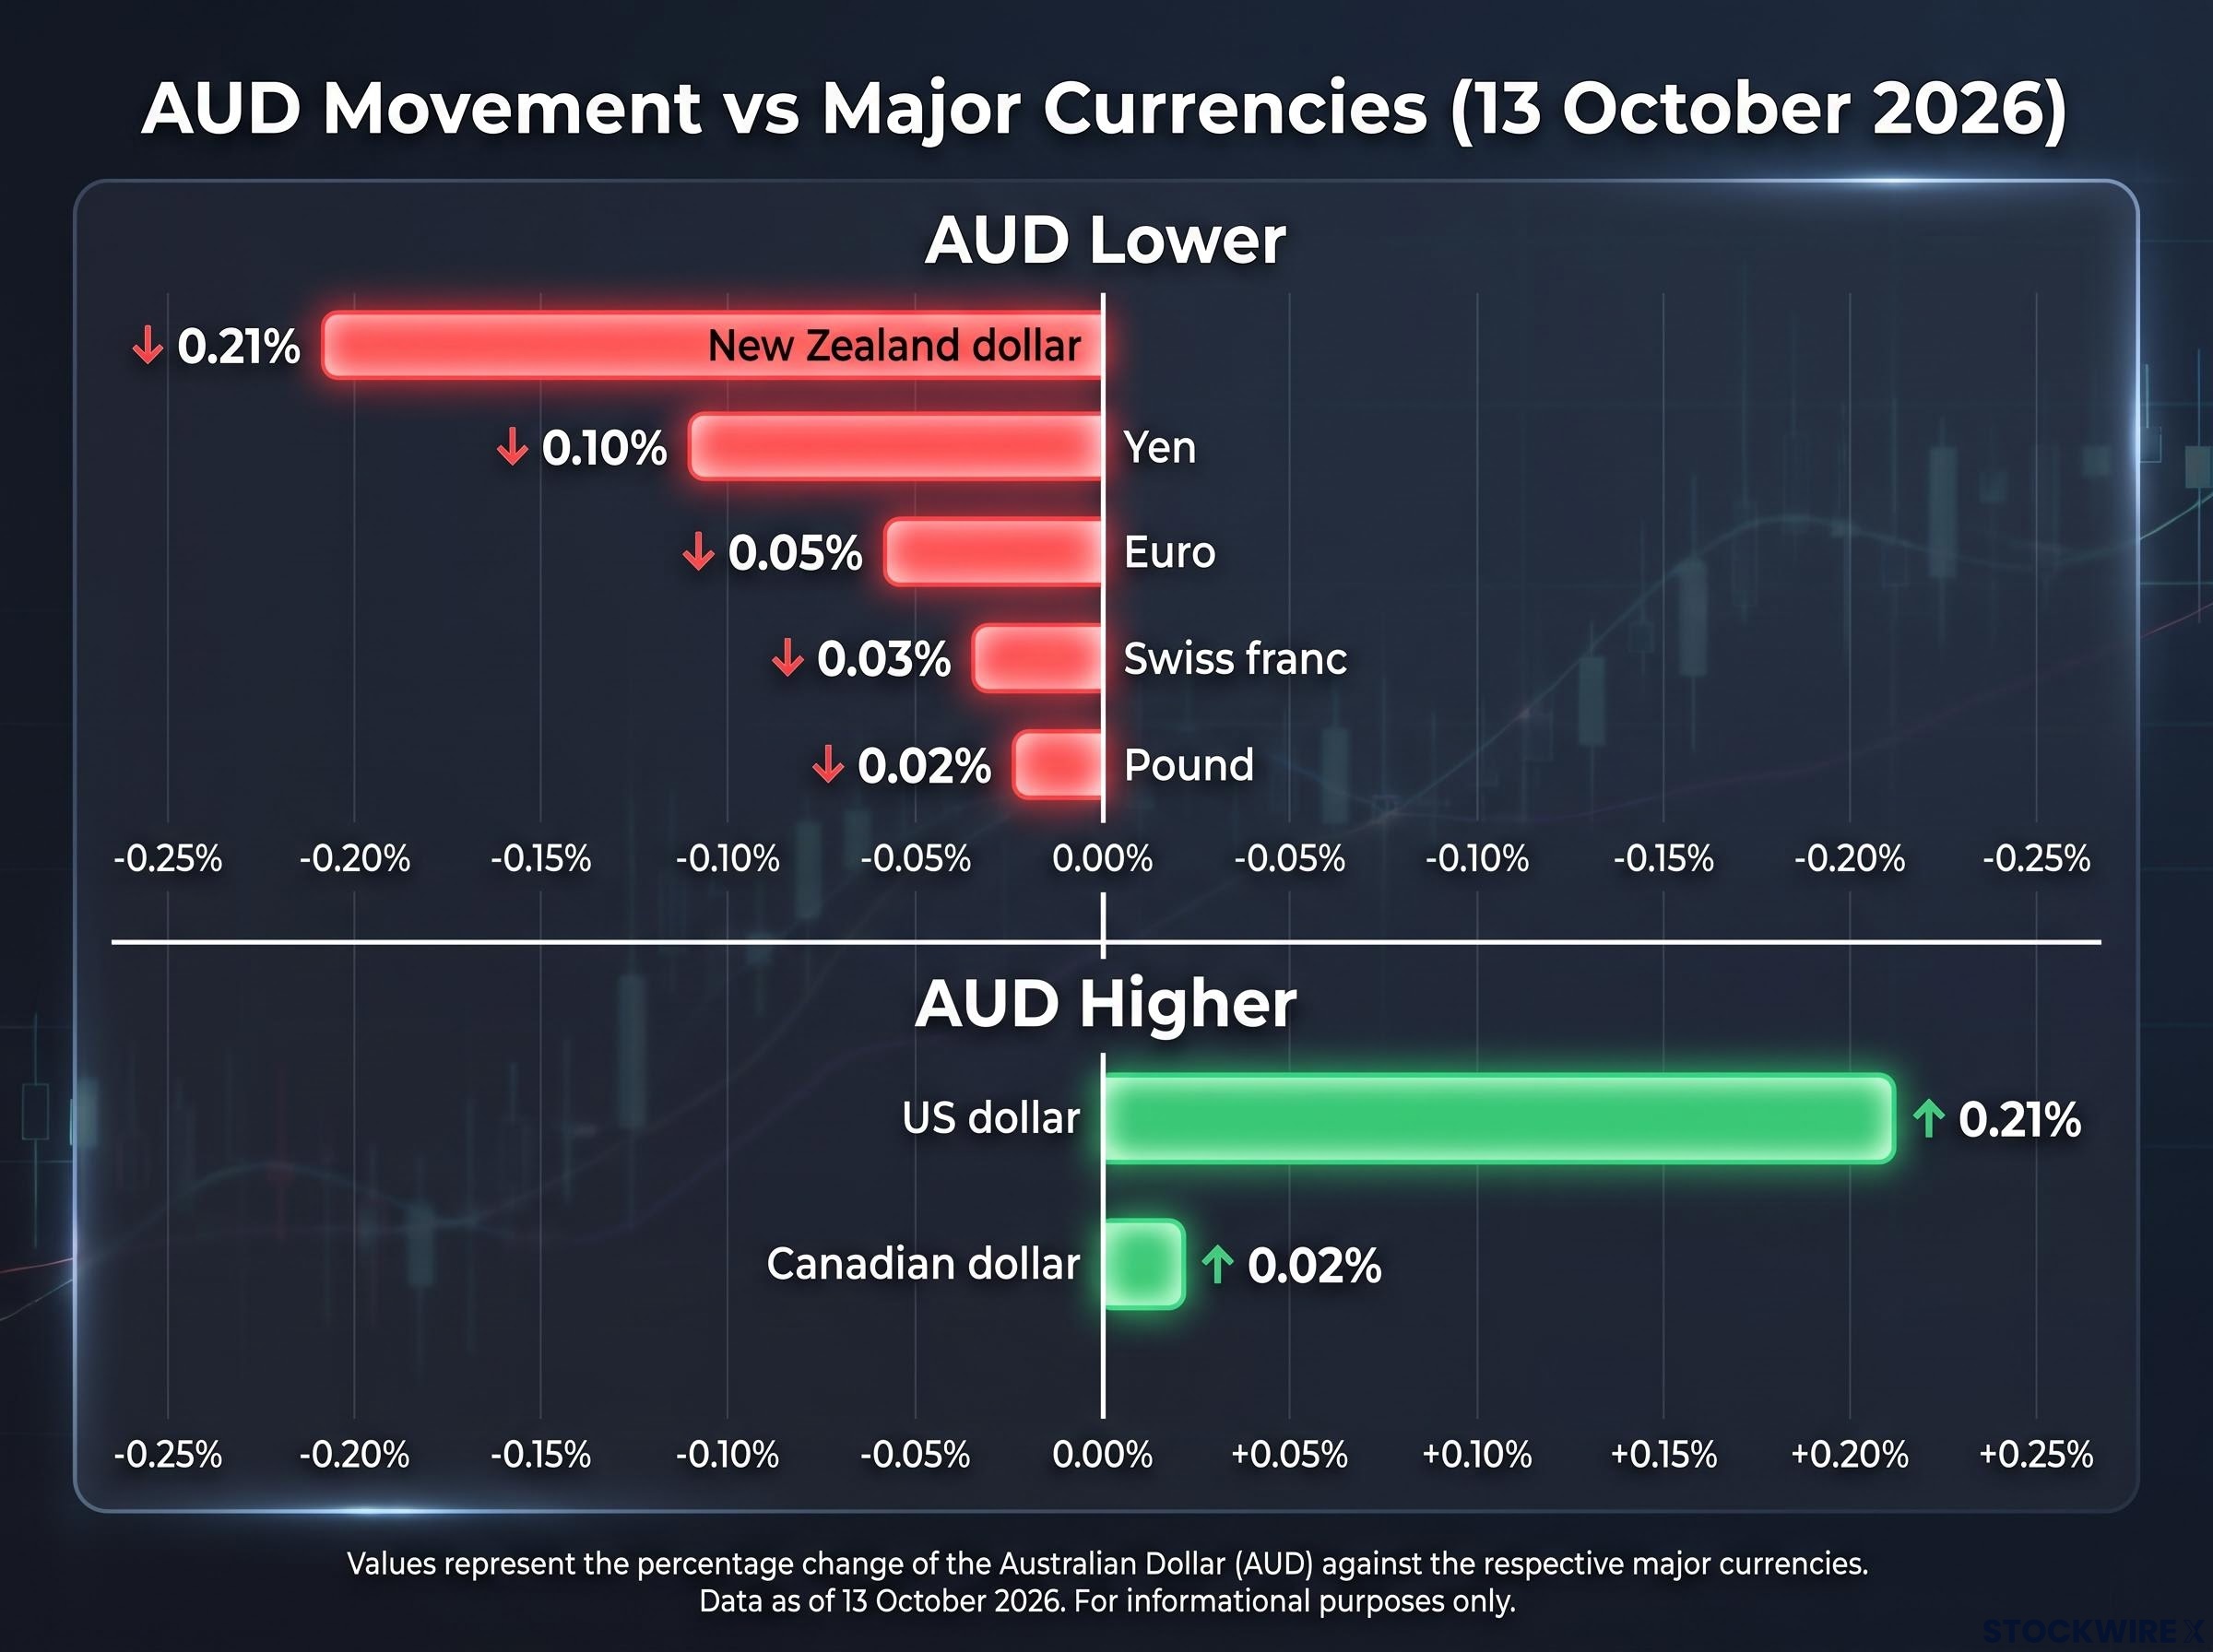
On the surface, Tuesday’s moves look contradictory. The RBA delivered a 25 basis point hike at its 28-29 September meeting, yet the currency weakened against most majors. It only gained against the Canadian dollar and the US dollar, and the USD gain came from America’s own weakness rather than Australian strength.
| Currency | AUD move | Direction |
|---|---|---|
| New Zealand dollar | 0.21% | Lower |
| Euro | 0.05% | Lower |
| Pound | 0.02% | Lower |
| Yen | 0.10% | Lower |
| Swiss franc | 0.03% | Lower |
| Canadian dollar | 0.02% | Higher |
| US dollar | 0.21% | Higher |
The RBA’s hike was partly defensive. It leaned heavily on upside inflation risks, including:
- Higher energy prices
- Higher global non-energy prices
- The risk that a softer Australian dollar pushes import costs up further
The relative-rates problem
“Hawkish” only means something relative to someone else. The RBA is hawkish against its own recent past, not against the US. The US 10-year Treasury yield climbed to roughly 5.33%, close to its highest level since 2002. When US yields sit that high, holding Australian dollars costs you more in forgone return.
Rate differentials with the US, Europe and Japan decide where mobile capital flows, so the RBA’s 4.60% cash rate matters less on its own than against the Fed’s path and US Treasury yields near 5.33%.
The US Dollar Index (DXY), which tracks the greenback against a basket of major currencies, eased about 0.3% to near 102.27 on Tuesday. That gave AUD/USD its lift. Mitrade reported the index had touched a year-to-date high of 102.60 before retreating, though sources conflict on the exact level.
Credit Agricole’s FX commentary reportedly described AUD/USD as “neutral/fully priced”, arguing that RBA hikes and Australia’s high carry are already discounted. That view has not been independently confirmed. If it is right, the hike gives your AUD exposure no automatic support, which is why RBA headlines alone make a poor guide to the pair.
What the RBA’s signalling tells you
Markets are not convinced another hike is coming. Pricing assigned only about a 24% chance of a November move, with roughly 15 basis points of tightening priced by year-end. Former RBA Board member Ian Harper called another increase “plausible” but not necessarily likely, and Capital Economics argues the cash rate has already peaked.
When big ASX news breaks, our subscribers know first
How does a softer AUD feed inflation, and what is the neutral rate debate?
The RBA’s concern about the currency is not abstract. It flows through to the fuel, goods and mortgage expectations Australian households deal with every week.
How a weaker AUD reaches prices
When the Australian dollar falls, every imported item costs more in local currency. Fuel, machinery, factory inputs and consumer goods all get dearer, a link the Bank for International Settlements also identifies. Some buyers switch to domestic alternatives, but that substitution rarely offsets the full price rise.
There is a second effect. If other central banks tighten while the RBA stands still, a weaker currency effectively loosens Australian financial conditions. A falling AUD is both a symptom and a source of inflation pressure, so the RBA’s next move depends partly on the currency itself.
Three readings of the neutral rate
The neutral rate is the cash rate setting that neither speeds up nor slows down the economy. The RBA’s September minutes considered whether the global neutral rate has risen. If so, the previous 4.35% cash rate was less restrictive than it was two years earlier.
Key point from the RBA minutes A higher global neutral rate could weaken the AUD if Australia’s own neutral rate did not rise by the same amount. The Board appeared to assume it had.
Commerzbank analysts warn that if other central banks hike more aggressively than expected, the RBA could be pushed into further tightening to avoid excessive depreciation.
| View | Core claim | AUD implication |
|---|---|---|
| RBA Board | Policy may need to stay tighter for longer | Supportive if the RBA keeps pace with offshore hikes |
| RBA staff (August SMP) | Cash rate at the top of the estimated neutral range; conditions somewhat restrictive | Limited room for further hikes, softer support |
| Market | The relative path of Australian and US rates matters most | A higher Australian neutral rate can coexist with a weaker AUD |
The market reading is the one that has dominated price action. That tells you to watch the gap, not the level.
The neutral rate debate is not unique to Australia; the ECB faces the same uncertainty over whether its deposit rate is restrictive at all, a useful comparison when judging how far the RBA can lean on its own estimates.
What do US CPI and Australian jobs data mean for the pair this week?
Those relative-rate dynamics face a direct test this week. Two releases could push the pair in opposite directions within 48 hours.
US September consumer price index (CPI) data arrives on Wednesday 14 October. Consensus has core CPI rising 0.2% month-on-month, about 2.5% annually. Headline forecasts conflict: Bloomberg’s median survey implies a 0.6% monthly rise, with coverage citing 3.6% annually, while other previews cite 3.7%. Truflation’s unverified estimate sits at 3.6% year-on-year.
The Australian Bureau of Statistics releases September labour force data on Thursday 15 October. Forecasts range from +10,000 jobs (Commonwealth Bank) to +15,000 (ANZ) and +20,000 (Westpac consensus), against 39,500 previously. All expect unemployment to hold at 4.6%.
| Release | Date | Consensus | AUD-positive outcome | AUD-negative outcome |
|---|---|---|---|---|
| US September CPI | 14 October | Core 0.2% m/m; headline 3.6-3.7% y/y | Softer print caps US yields | Hot print revives Fed hike bets, lifts DXY |
| Australian labour force | 15 October | +10,000 to +20,000; 4.6% unemployment | Stronger hiring keeps a November hike alive | Weak jobs cut November hike odds |
Institutional views remain split on direction:
- UOB: Neutral near-term stance, expecting AUD/USD between 0.6935 and 0.7020 over one to three weeks
- Westpac: Base case includes one more RBA hike by year-end
- Capital Economics: Cash rate has already peaked
Two prints can reset the rate-differential story, so positioning ahead of them carries event risk the cash rate alone does not capture.
Where are the AUD/USD support and resistance levels, and which scenario is most likely?
The chart reflects that indecision, with a mild lean to the downside.
Reading the chart
Price trades below the 20-day exponential moving average (EMA), an average of recent closing prices that gives more weight to the latest days. Readings vary: about 0.7011 in the initial report, 0.7009 per Mitrade and 0.6978 per Investing.com. The relative strength index (RSI), a momentum gauge where readings under 30 signal oversold conditions, sits between 37.6 and 40: bearish-leaning, but with room for a relief bounce.
Published levels differ by source and timing, and several are unverified.
| Source | Support | Resistance |
|---|---|---|
| Swing lows (1 October, 30 June) | 0.6904, 0.6865 | n/a |
| TMGM (unverified) | 0.6900, 0.6865 | 0.7015 |
| DailyForex (unverified) | 0.6935, 0.6905 | 0.6980, 0.7005 |
| DailyForex second analysis (unverified) | 0.6900, 0.6850 | 0.7000, 0.7050 |
| FXEmpire short-term (unverified) | 0.6964 | 0.6980 |
Five scenarios and what triggers each
- Bearish: Hot US CPI and weak jobs drive a sustained break of 0.6900, exposing 0.6865.
- Moderately bearish: One negative surprise keeps price pinned below the EMA, testing 0.6900-0.6905.
- Range-bound: In-line data holds the pair broadly within UOB’s 0.6935-0.7020 band.
- Bullish: Softer US CPI caps yields and solid jobs data lift the pair through the 0.7000-0.7040 block.
- Strongly bullish: Both prints favour the AUD, alongside credible Chinese stimulus and a convincing daily close above the EMA.
Risks cut across all five: persistent US inflation, Chinese demand, a deeper Australian housing correction and shifting RBA signalling. The read you should take from this is that a sustained break below 0.6900, or back above 0.7000-0.7050, is the signal worth acting on, not intraday noise around 0.6970.
Past performance does not guarantee future results. These scenarios are speculative and subject to change based on market developments.
What the hawkish RBA does and does not change for the pair
The 4.60% cash rate shores up the RBA’s inflation credibility. It does not set the currency’s direction. US yields, Chinese demand and relative rate paths still do that work.
Three variables deserve your attention:
- US Treasury yields after Wednesday’s CPI
- Thursday’s jobs print, then the September-quarter CPI
- Chinese trade and demand signals
If these line up in one direction, the chart levels above tell you whether the move has conviction. All figures are as of 13 October 2026, and currency conditions can shift quickly.
This article is for informational purposes only and should not be considered financial advice. Investors should conduct their own research and consult with financial professionals before making investment decisions.