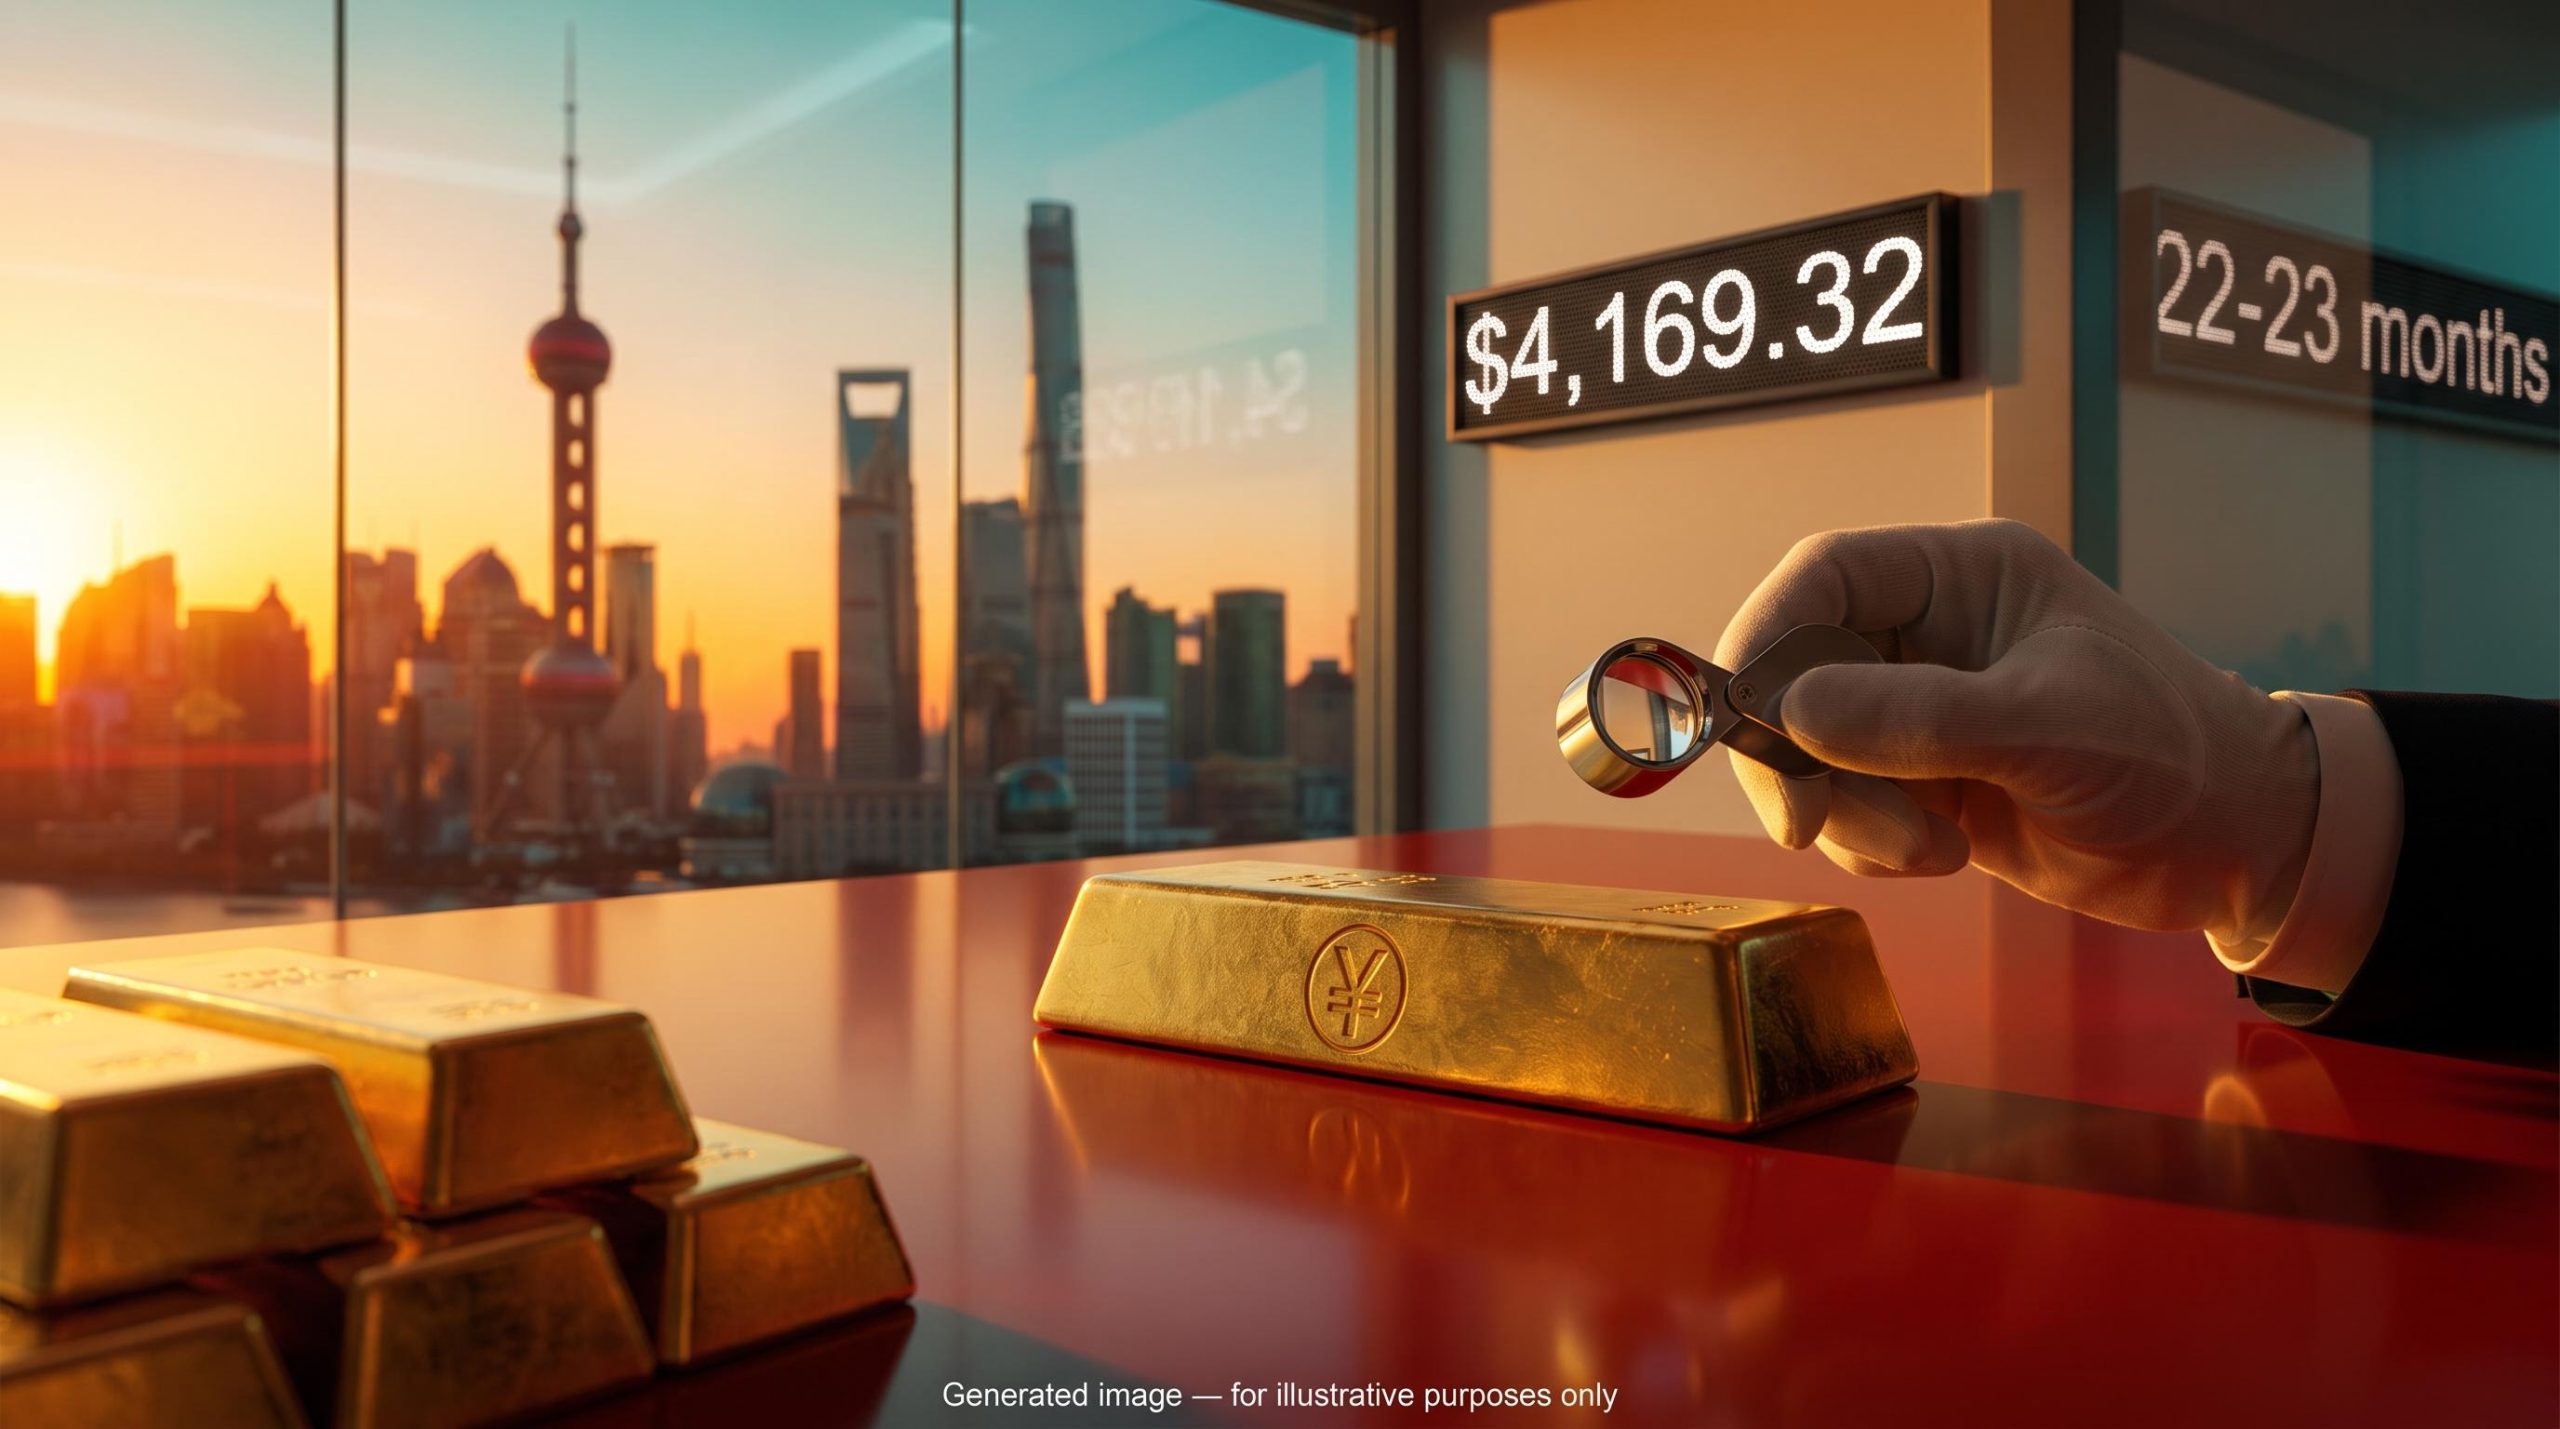
Spot gold has spent October trading between $4,100 and $4,200 an ounce, and most market coverage credits the usual suspects: the US dollar, Treasury yields, Federal Reserve expectations and geopolitical risk. Michael Howell sees a different engine. In his view, the gold price is being driven by China’s debt problem, specifically a slow-growing, heavily indebted economy that is quietly monetising what it owes.
That argument matters now for two reasons. The People’s Bank of China (PBOC) has added gold to its reserves for 22-23 consecutive months. Howell also extends his thesis well beyond bullion, using it to arrive at a call for oil near $200 a barrel.
If you hold gold, energy or broader commodity exposure, the difference between a real China channel and an overstated one changes how you read every price move.
Here is what the data confirms, which figures are Howell’s own estimates, and the signals worth tracking from here.
What does Howell actually claim about China, debt and gold?
Howell’s thesis is a chain, and each link depends on the one before it. It starts with China’s growth and ends with gold’s price, which means a weak link anywhere loosens the whole argument.
According to Howell:
- China’s official growth rate of 4-5% overstates reality, and real growth sits nearer 1-2%.
- Chinese bond yields trade far below US yields, which he reads as a signal of very weak growth.
- Heavy debt has crushed the marginal return on capital since the global financial crisis.
- Beijing is likely monetising that debt, meaning the central bank effectively funds it with newly created money.
- The PBOC balance sheet has roughly doubled since 2022.
- That liquidity flows into gold, and also correlates with the CRB index excluding oil, a broad measure of commodity prices.
The sharpest claim concerns timing.
Howell’s lead indicator Changes in PBOC liquidity lead gold price moves by almost two months, according to Howell.
That is a bolder claim than “China buys gold”. Howell is arguing that Chinese liquidity, the money flowing through its financial system, moves first and gold follows.
He also frames this as a direct challenge to the popular explanation that the Ukraine war and Western seizures of Russian assets launched gold’s rally. For Howell, China is the main catalyst.
If he is right, the implication for you is practical. You would watch Chinese liquidity data as an early warning signal for gold, rather than relying only on US real yields and the dollar.
When big ASX news breaks, our subscribers know first
How could China monetise debt without printing money openly?
The puzzle is obvious. China does not run a Western-style quantitative easing programme, so where is the printing?
The answer lies in how the system’s parts fit together. Commentators who see monetisation describe a closed loop:
- State entities, including local government financing vehicles (LGFVs, companies set up by local governments to borrow for infrastructure), issue debt.
- State-owned banks buy that debt.
- The PBOC supports those banks through relending facilities (cheap loans to banks for targeted lending) and window guidance (informal instructions on where to lend).
- Bank balance sheets expand while domestic yields stay low.
- Savers, facing weak returns, look for something that holds value.
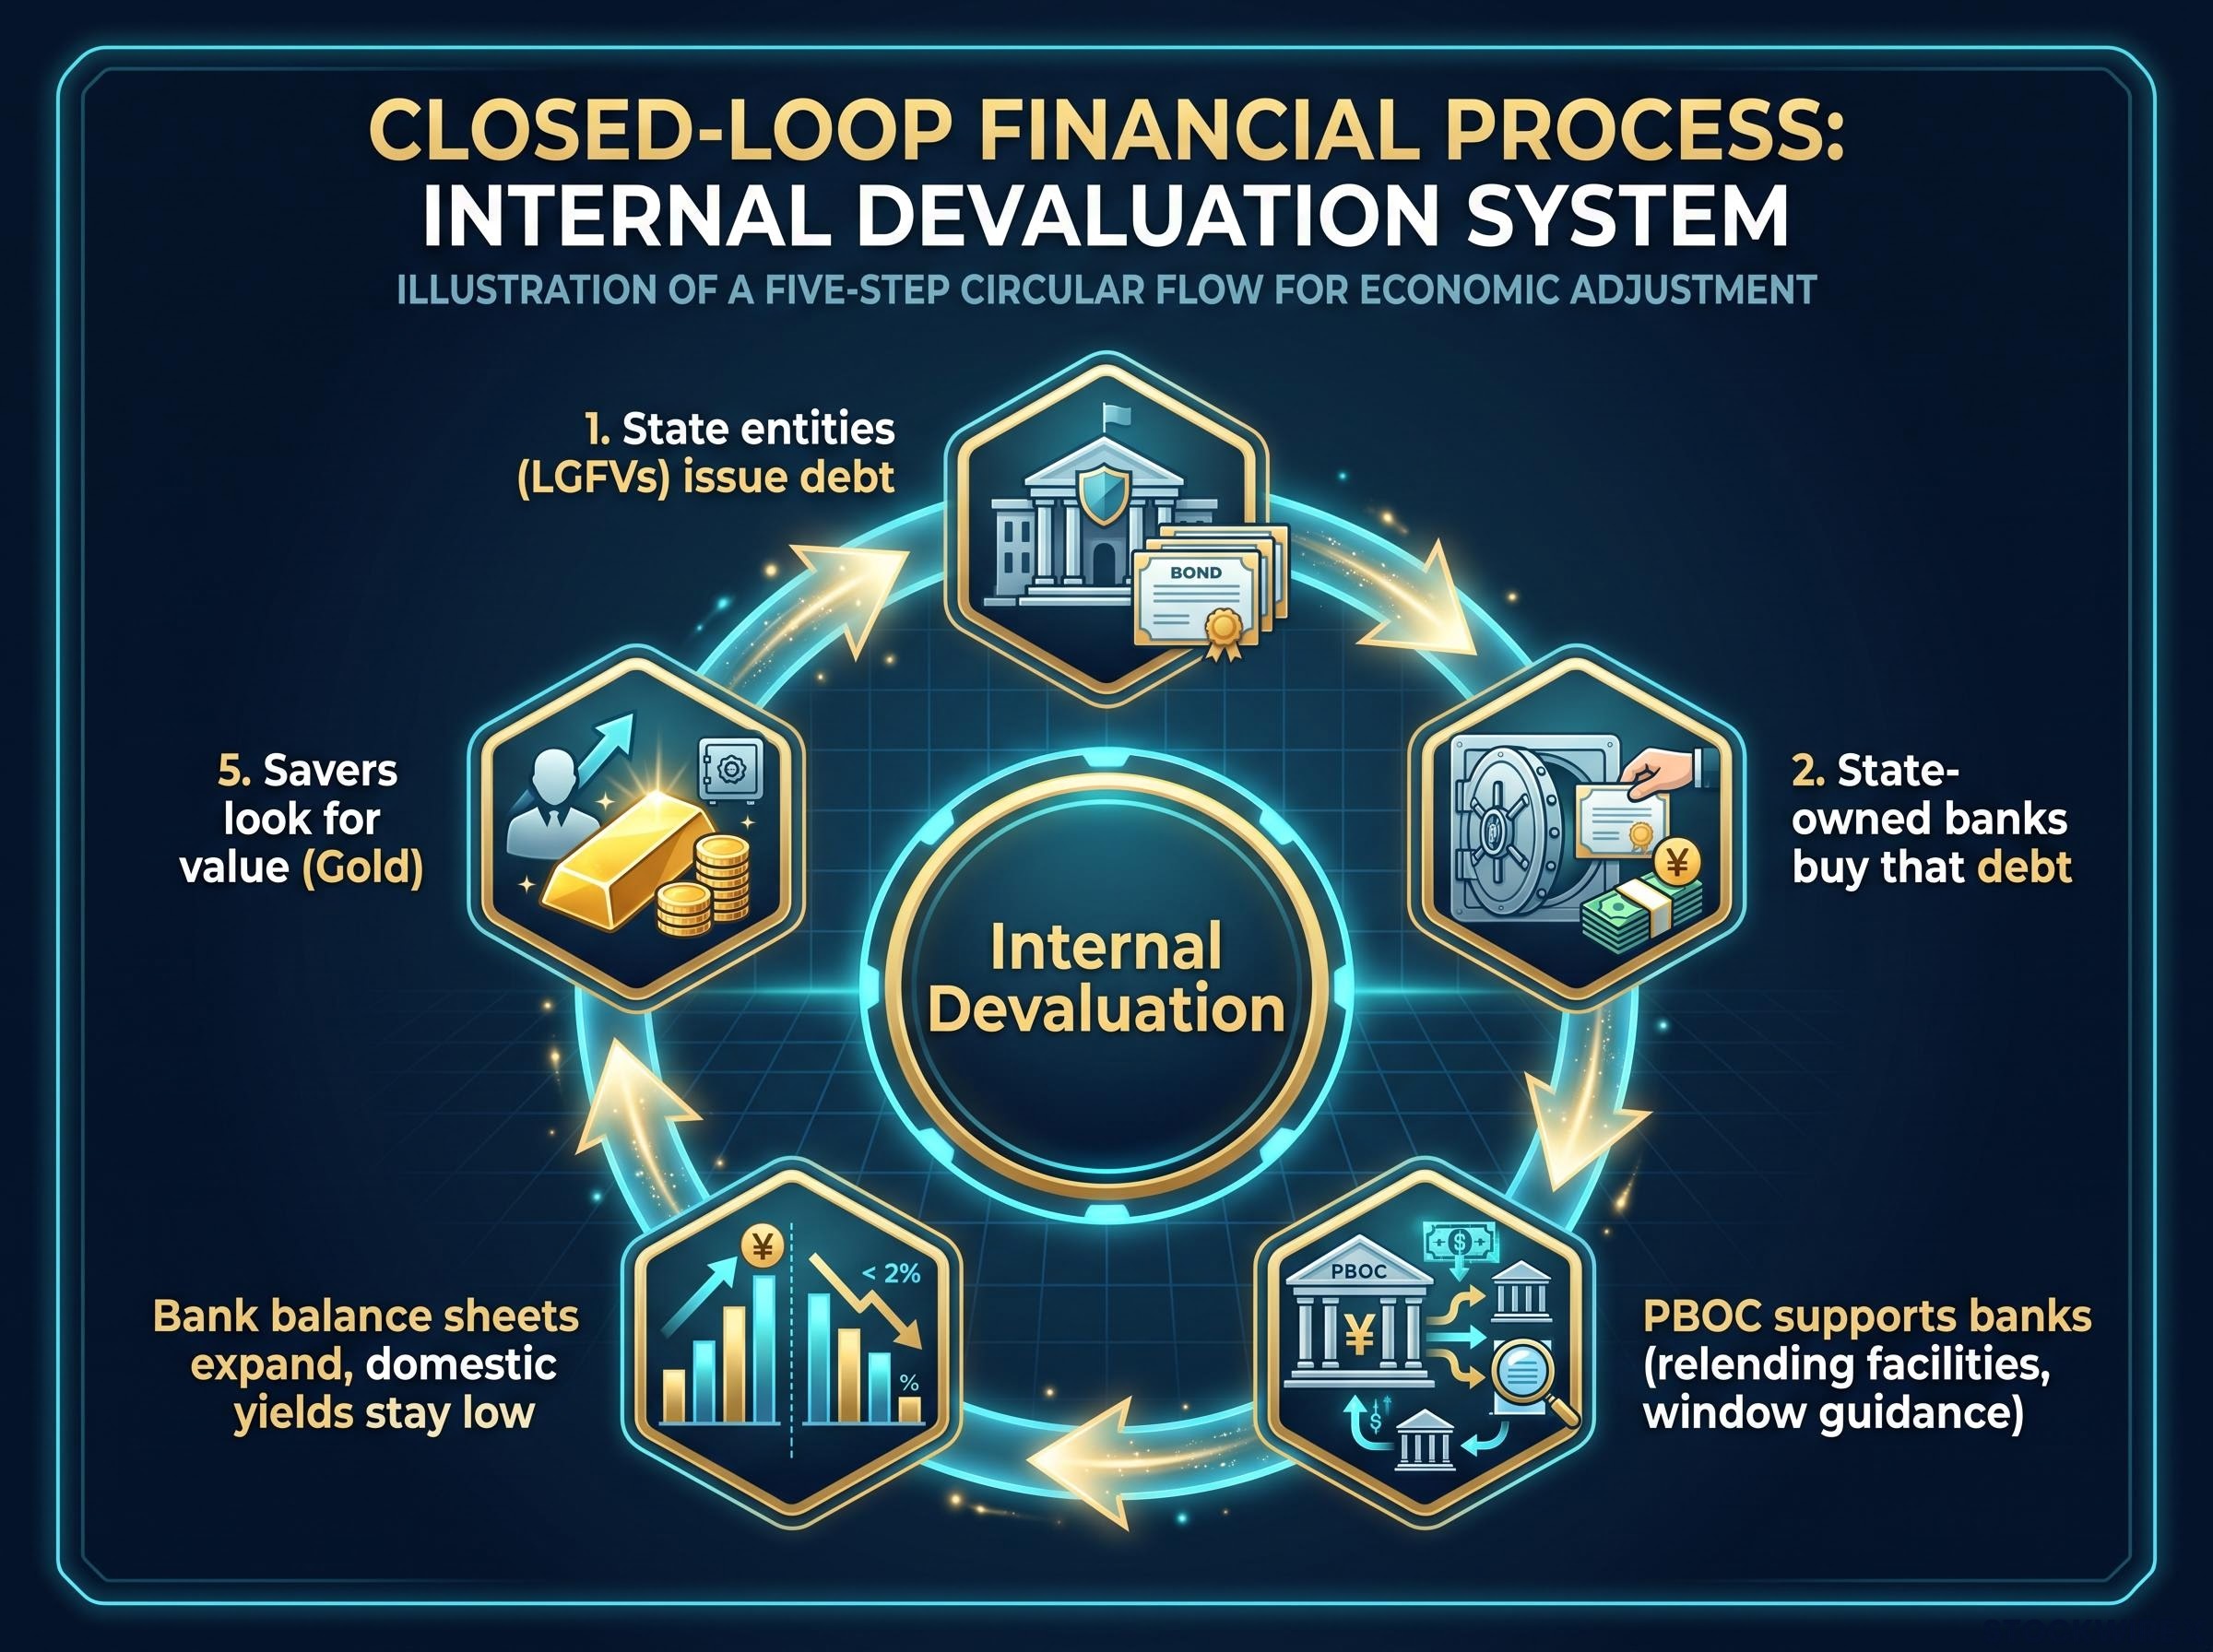
Howell calls the result an “internal devaluation”. Capital controls, large reserves, compliant state banks and a ban on crypto let Beijing hold the yuan’s external dollar rate while savings lose value at home. Gold, in his telling, becomes the outlet.
Where Chinese savers put the money
Household behaviour offers the most testable evidence. The World Gold Council (WGC) reported Chinese jewellery demand of 194 tonnes in the first half of 2025, down 28% year on year. Yet spending held at RMB 137 billion, roughly level with 2024.
Fewer grams for the same money suggests buyers treated gold as a store of value rather than adornment. Bars, coins and ETFs have drawn strong demand, and imports topped 1,000 tonnes across January to August 2026, a record US$158.8 billion. Shanghai Gold Exchange delivery and ETF flow figures were not available in the research.
Chinese import volumes support the view that gold demand is a structural, policy-driven force, with 2026 imports already exceeding the prior full-year total and suggesting buyers are less sensitive to price than a trading position would be.
Official buying forms the second leg. Together, they tell you Chinese gold demand partly reflects a lack of alternatives, so domestic financial conditions can move global gold independently of Western policy.
Is Japan’s Abenomics a fair map for China?
Howell places China 10-15 years behind Japan, and the comparison is persuasive at first glance.
Debt monetisation means a central bank buys government debt with newly created money, easing the burden on the borrower. Japan did this openly under Abenomics, Prime Minister Shinzo Abe’s programme launched in late 2012. The Bank of Japan bought government bonds on a vast scale, the yen weakened and nominal growth (growth before adjusting for inflation) eventually recovered. Japan’s nominal GDP growth is now testing about 5%, compared with negative readings in the early 2000s.
The fit loosens once you compare the machinery.
| Factor | Japan under Abenomics | China today |
|---|---|---|
| Policy tool | Explicit, large-scale government bond purchases | Credit guidance and liquidity facilities |
| Transparency | Mature, transparent financial markets | Opaque data makes comparison hazardous |
| External position | Strong external investment position | Relatively closed capital account, capital controls |
| Deflation risk | Persistent deflation at the outset | Pressures may be more severe than Japan’s at the start |
The gold record complicates the analogy further. After 2012, gold priced in yen did not surge in one direction; yen weakness, global real rates and risk sentiment shaped its path. That suggests the currency channel may matter more than domestic monetisation itself.
Use the Japan comparison as a framework for thinking about possible outcomes, not as evidence that gold will follow the same route.
What does the gold/oil ratio imply, and how far can it be trusted?
Howell’s oil call grows out of his liquidity logic. Gold is a monetary asset, he argues, so it rises early in a liquidity cycle. Oil responds to the real economy and catches up later.
The arithmetic runs in steps:
- The gold/oil ratio measures how many barrels one ounce of gold buys.
- Howell puts its average at about 20x over 50-60 years.
- He says the ratio mean-reverts, returning to that average, within about two years.
- With gold near $4,170, a 20x ratio implies oil around $200 a barrel.
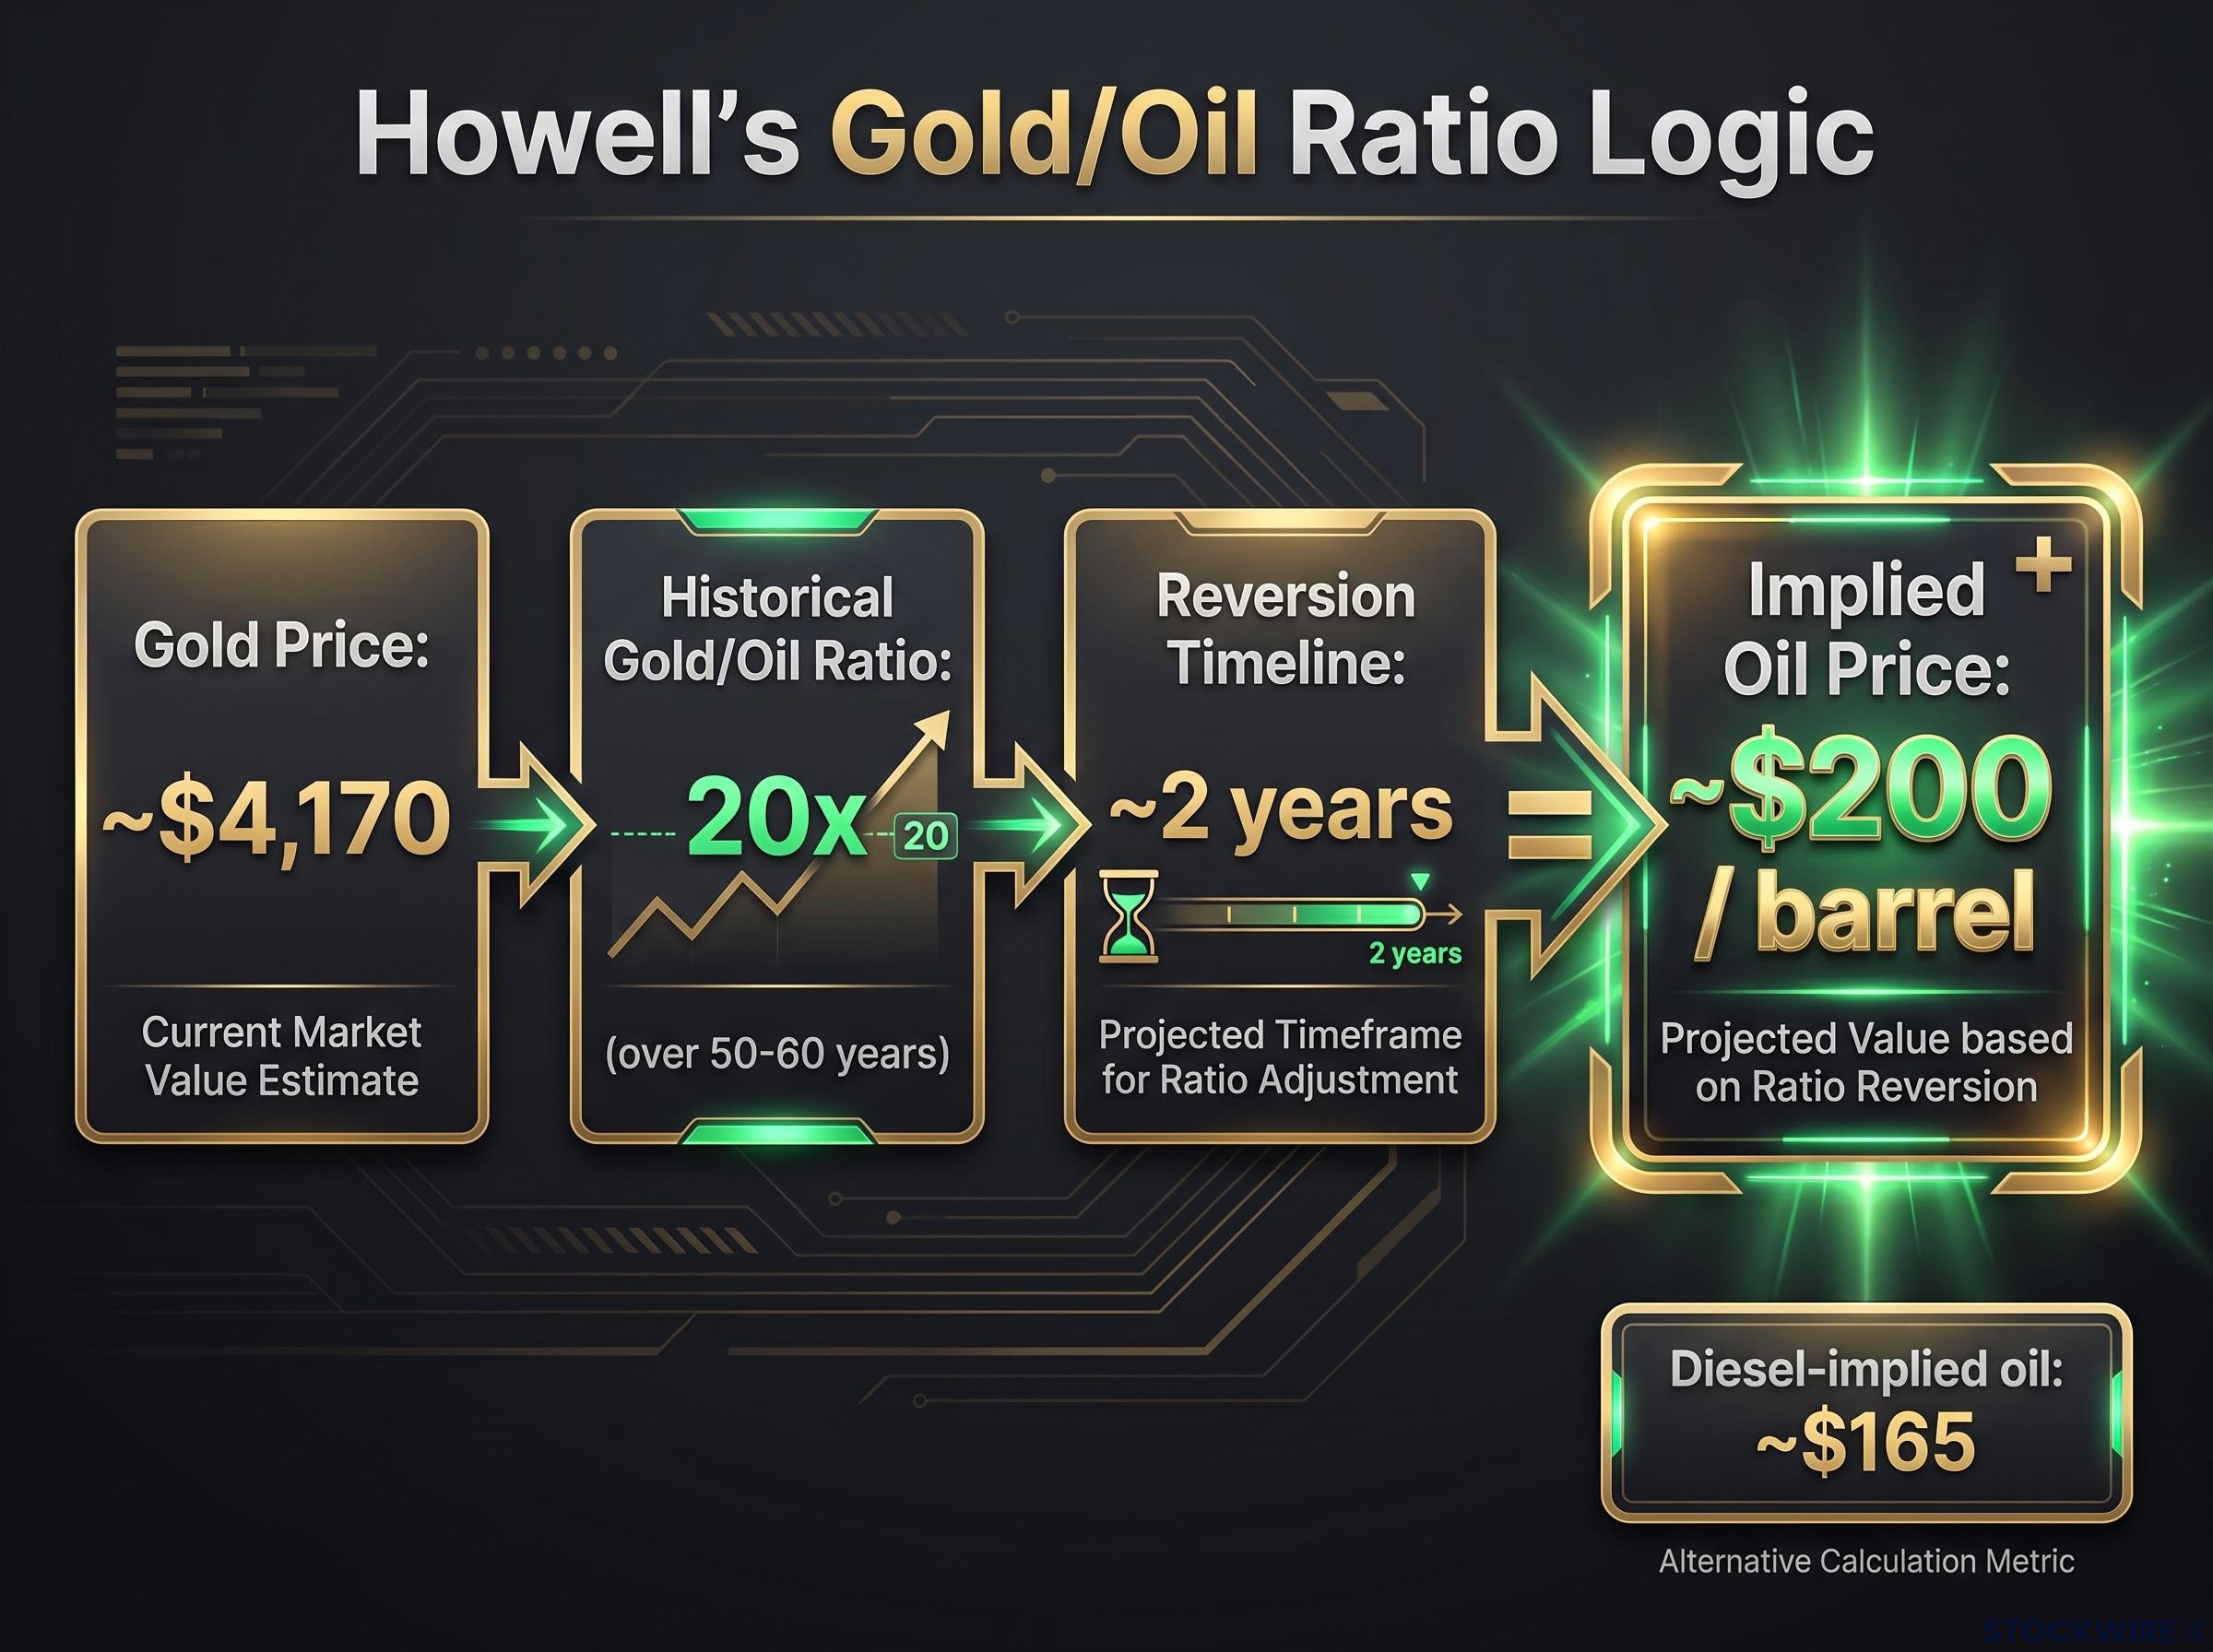
He adds supporting claims. Gold held or rose in about nine of ten past ratio adjustments, according to Howell. He estimates the oil price implied by diesel is already about $165, and argues high oil and idle tankers squeezed liquidity this year by eating into margins and removing tanker cargoes as loan collateral.
Current Brent and WTI levels were not found in the research, so the distance between today’s crude price and his target cannot be measured here.
Unverified foundations No published study found in the research confirms a 20x long-run gold/oil mean or a two-month PBOC liquidity lead on gold.
Where the ratio logic strains
Gold and oil answer to different masters. Gold reacts to monetary and financial forces; oil reacts to physical supply, OPEC policy, technology and the energy transition. Shale, renewables and electric vehicles can break historical relationships that held for decades.
Both the lead-lag and ratio models are heuristics, rules of thumb rather than proven laws. Stacking one on the other multiplies model risk.
Treat the $200 figure as a scenario built on unverified assumptions. Sizing an energy position on it alone would mean betting on two models at once.
For readers wanting the oil link in depth, our full explainer on gold and oil traces how crude shapes inflation expectations and real yields.
Where does China fit among gold’s other drivers?
Weighed fairly, China earns a place near the top of the list, but not alone on it.
Reuters frames October’s moves around the dollar, Treasury yields and Fed expectations. A stronger dollar and high yields capped early-month gains, while fading prospects of a Fed hike and cooler US inflation lent support. Spot gold reached $4,169.32 on 9 October, a one-week high after a recent two-month low.
Real interest rates, not nominal yields, set gold’s opportunity cost, which is why a high-yield backdrop can cap rallies even when Chinese liquidity is abundant and central banks keep buying.
The WGC points to broad central-bank diversification. Net official buying reached 39 tonnes in August 2026, led by China, Uzbekistan and Poland, which many read as a hedge against dollar exposure and sanctions risk.
| Driver | Evidence | Source | Confidence |
|---|---|---|---|
| PBOC gold buying | About 20 tonnes a month for 22-23 months | WGC, Kitco | High |
| PBOC liquidity lead | Almost two-month lead on gold | Howell | Low, unverified |
| Real rates and dollar | Capped early-October gains | Reuters | High |
| Central-bank diversification | 39 tonnes net buying in August | WGC | High |
Sorting the claims clarifies where the thesis stands:
- Confirmed: PBOC holdings of about 2,387 tonnes, roughly 9% of reserves, as of August, within a wider central-bank trend.
- Conflicting: September holdings figures differ across sources, and the streak has run longer than the 18 months Howell cited.
- Unverified: the two-month lead, the doubled balance sheet and 1-2% real growth.
History adds caution. Both the 1970s stagflation era and the 2000s China boom lifted gold through several forces at once. PBOC liquidity can also be sterilised (offset by other policy moves) or trapped in banks, so its pass-through to gold is unstable.
China contributes meaningfully to gold’s strength. Still, keep US real yields and the dollar on your screen, because they can cap rallies even when liquidity is plentiful.
What the China thesis explains, and what it leaves open
China’s role in gold is real where the data is hard. PBOC buying is confirmed, month after month. Howell’s two-month lead, 20x ratio, $200 oil, doubled balance sheet and 1-2% growth estimate remain his own, without independent support in the research.
Three things deserve your attention from here:
- Monthly PBOC and WGC central-bank buying data
- Chinese liquidity conditions and any signs of renewed easing
- US real yields and the dollar
The sensible read is to treat China as one important driver of gold, not the only one. If Chinese liquidity and Western rates point the same way, your conviction can rise; if they diverge, the US side has a track record of capping rallies.
Past performance does not guarantee future results. Financial projections are subject to market conditions and various risk factors. Forward-looking statements attributed to Michael Howell are speculative and subject to change based on market developments.
This article is for informational purposes only and should not be considered financial advice. Investors should conduct their own research and consult with financial professionals before making investment decisions.