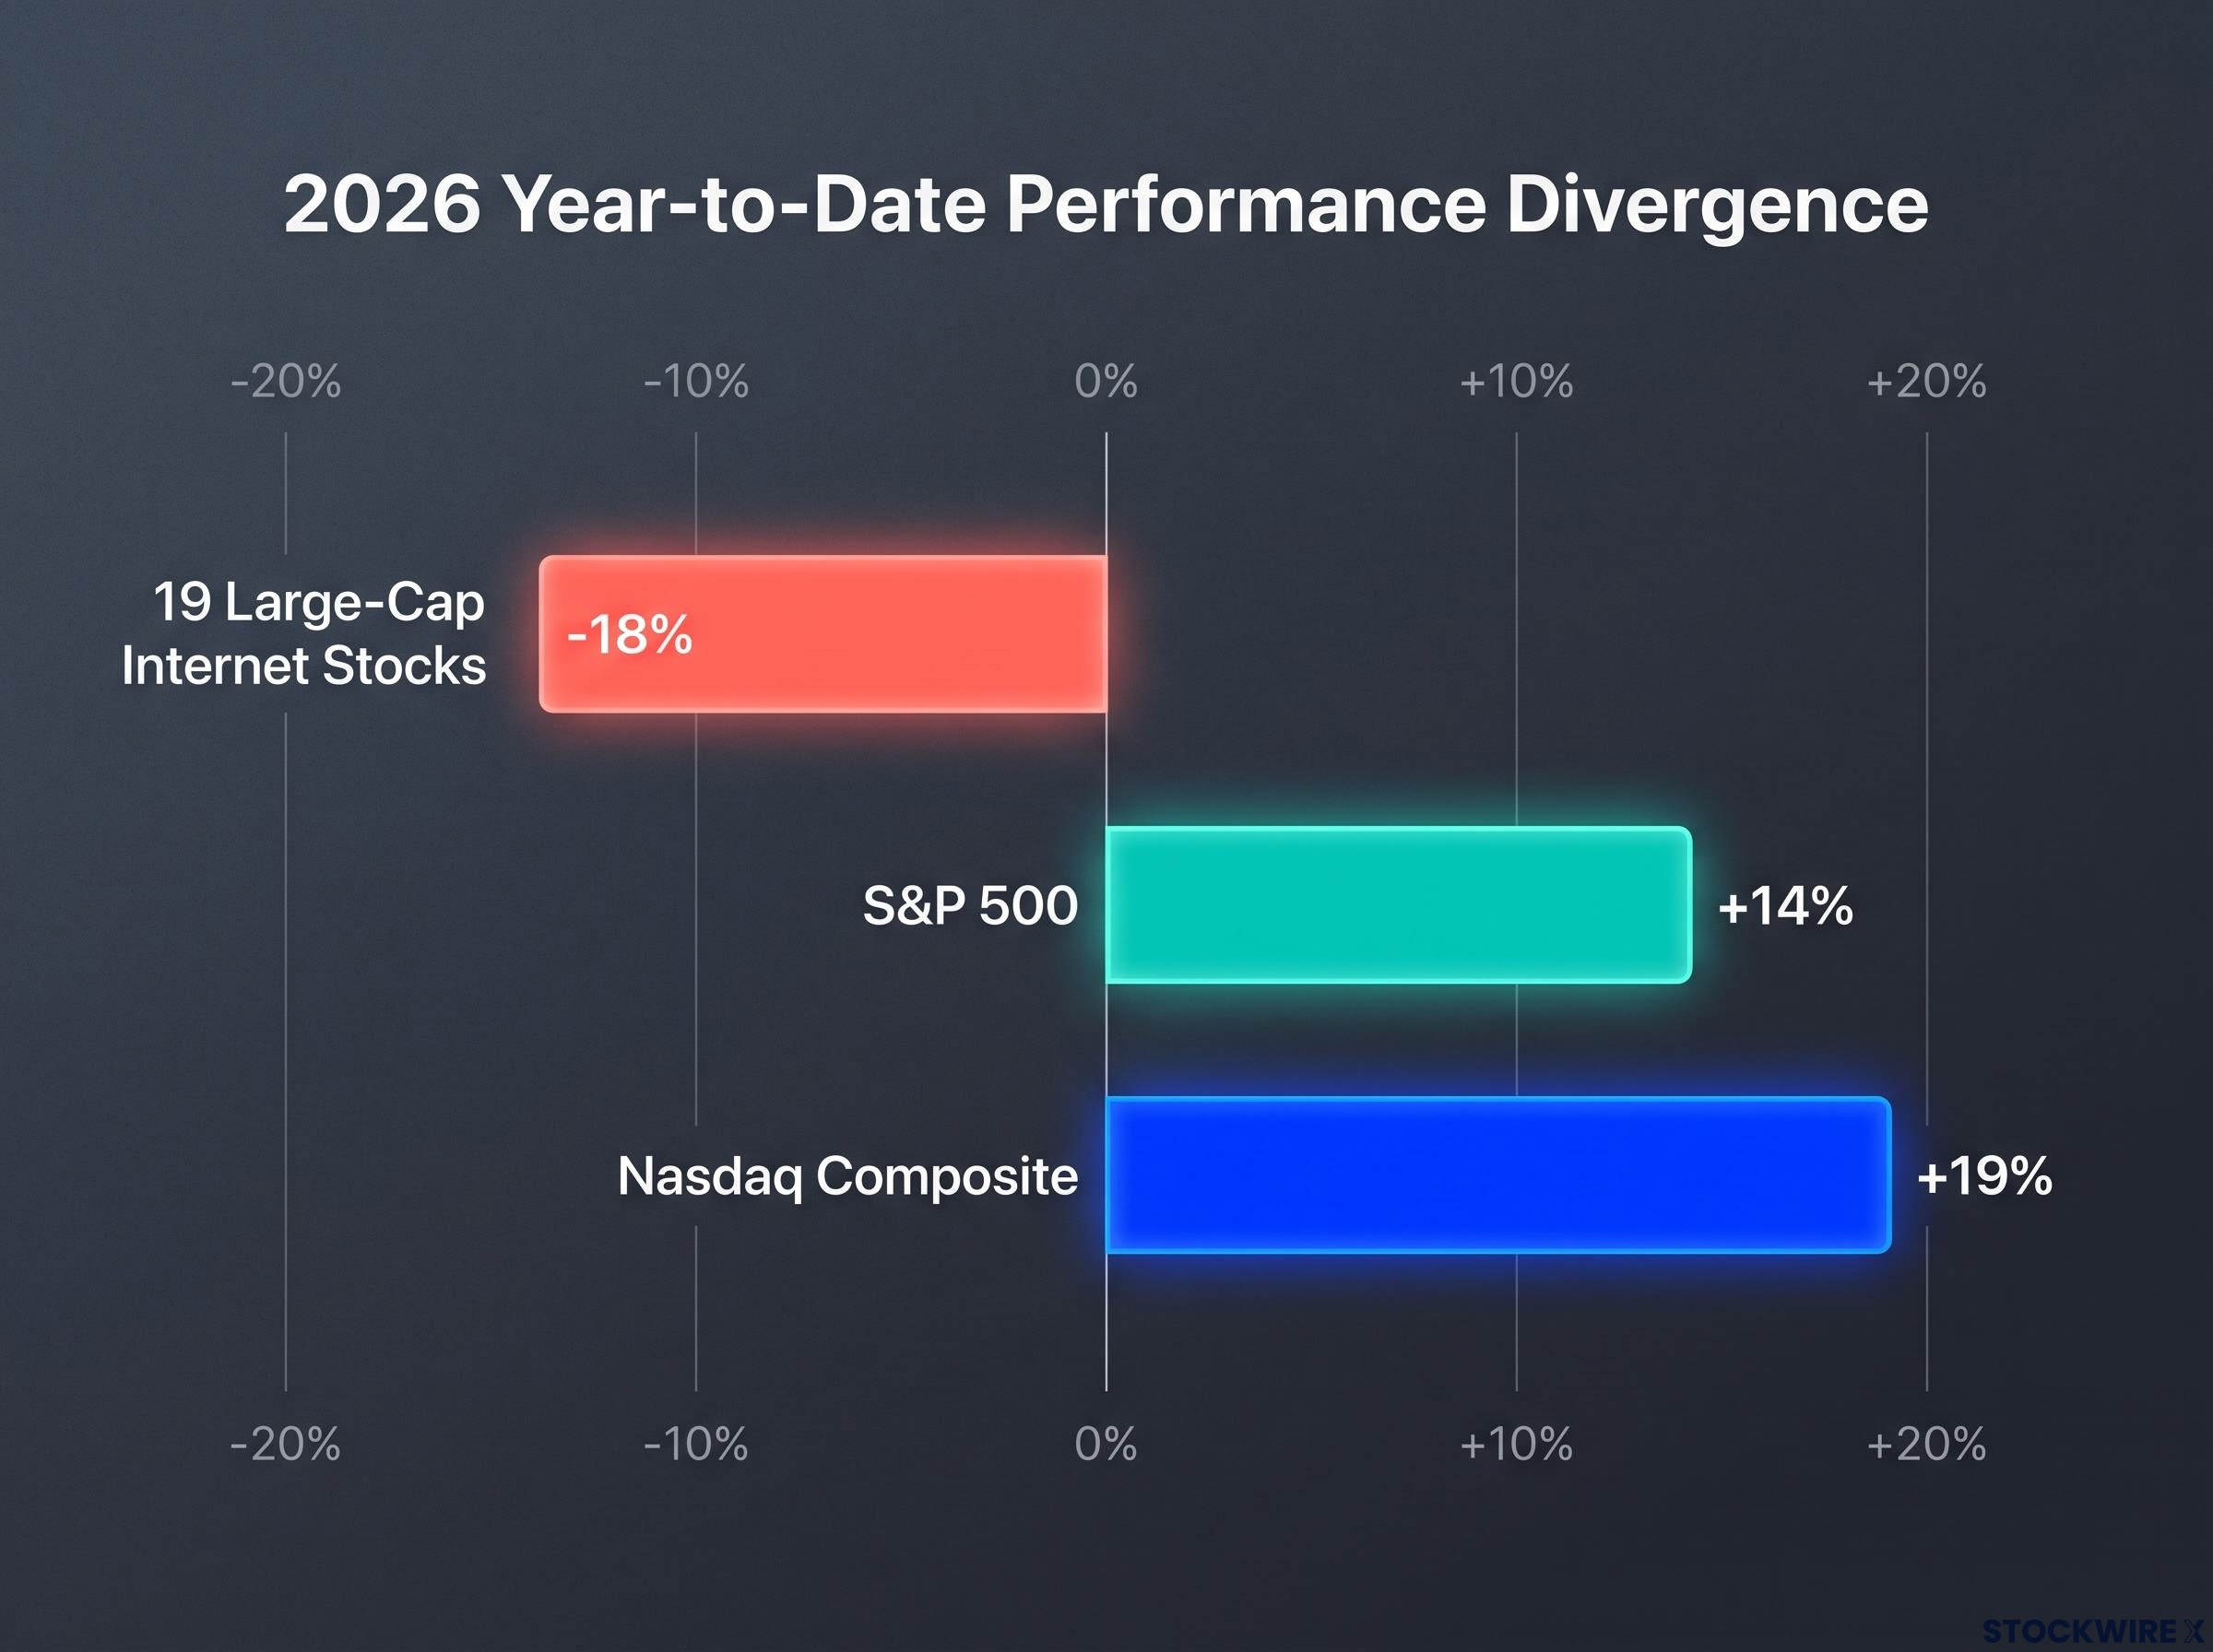
Nineteen large-cap internet stocks are down about 18% on average this year. Over the same stretch, the S&P 500 has climbed about 14% and the Nasdaq Composite about 19%.
A gap that wide forces an uncomfortable question for anyone weighing internet stocks as a buying opportunity. Is the market offering a discount, or is it warning you about something the headline indices are hiding?
Evercore ISI Senior Managing Director Mark Mahaney has taken a clear side. In a note reported today, 11 October 2026, he argues the selloff is cyclical and driven by sentiment. He also argues that free cash flow at Amazon, Alphabet and Meta Platforms may turn positive sooner than Wall Street expects.
That claim deserves testing rather than repeating. Here is how to separate sector-wide fear from company-level cash flow evidence, and what would need to be true for this dip to be worth buying.
What is behind the 18% gap? Six bear market factors, sorted by how much they matter
Mahaney lists six separate forces weighing on the group. Read in sequence, they sound like a sector under siege.
The performance gap (year to date, 2026) Evercore’s 19 large-cap internet stocks: down about 18%. S&P 500: up about 14%. Nasdaq Composite: up about 19%.
Sorting them changes the picture. Three are cyclical or sentiment-driven, the kind of pressure that tends to ease as moods shift. The other three raise structural questions about how these businesses earn money.
| Factor | What it means | Type | Companies most exposed |
|---|---|---|---|
| Stretched valuations | Multiples were high at end-2025 after a three-year bull run | Cyclical | Sector-wide |
| Iran-war energy shock | Inflation pressure has lifted costs and curbed consumer demand | Cyclical | Consumer-facing names |
| IPO supply | Investors are freeing up capital for an expected wave of mega-cap internet listings | Sentiment | Sector-wide |
| AI disruption risk | Doubts over long-term value as AI changes how services are delivered | Structural | Booking Holdings, Expedia Group, Shopify, Uber Technologies |
| Capex intensity | Capex as a share of revenue likely to rise further in fiscal 2027, possibly 2028 | Structural | Amazon, Alphabet, Meta |
| Muse Risk | AI agents becoming the main consumer interface | Structural | Search, social and marketplace platforms |
The research gives no names or timing for the expected IPOs, and no quantified estimate of the energy shock’s effect on inflation or spending. Both factors are real, but their size is unknown.
Why Muse Risk is different from ordinary AI competition
Ordinary AI competition means a rival builds a better product. Muse Risk is about losing the front door entirely.
The concern is that autonomous AI agents, built into operating systems, messaging apps or commerce platforms, handle search, product discovery and booking on the user’s behalf. Traffic to search engines, social networks and marketplaces could then shrink, eroding customer relationships, advertising monetisation and take rates (the share of each transaction a platform keeps as revenue).
No named analyst commentary in the research ties this mechanism directly to Booking, Expedia, Shopify or Uber, so treat it as a thesis rather than a confirmed effect. What this sorting tells you is that half the discount may reflect temporary pressure, while Muse Risk and capex intensity are the two factors that deserve real diligence.
When big ASX news breaks, our subscribers know first
How does free cash flow work when capex surges? The mechanics behind Evercore’s argument
Capex intensity is the factor Mahaney tackles head on, and it starts with a puzzle. Amazon Web Services (AWS) grew Q2 2026 revenue about 36.7% year on year to roughly $42.2 billion, yet Amazon’s free cash flow went negative.
How can both be true?
Free cash flow (FCF) is the cash a business generates from its operations minus what it spends on capital expenditure. Capital expenditure (capex) is spending on long-lasting assets such as data centres, servers and chips. When capex rises faster than operating cash, FCF falls, even if the business is growing.
Aswath Damodaran, the New York University valuation professor, set out why this pattern appears in his 9 October 2026 essay, “Stock Prices, Earnings and Cashflows: The AI Effect Plays Through.”
Damodaran on investment waves The “builders of the architecture” (Meta, Alphabet, Amazon and Microsoft) tend to show depressed earnings and FCF early in an investment wave. As spending pays off through revenue capture, or as capex moderates, earnings and cash flow can converge upward.
Evercore’s case for an inflection rests on four arguments:
- Revenue acceleration: AI and cloud growth, visible in AWS, could eventually cover a higher capex base.
- Front-loaded capex: Spending is heaviest at the start of the build, with payback arriving later.
- Operating cash flow outpacing capex: Amazon’s trailing twelve-month operating cash flow reached about $161.4 billion, up roughly 33%. If that pace holds while capex growth slows, FCF can recover.
- Scale economies: Once the platform is built, extra AI workloads and ad or commerce products may carry very high incremental margins, according to Yahoo Finance analysis.
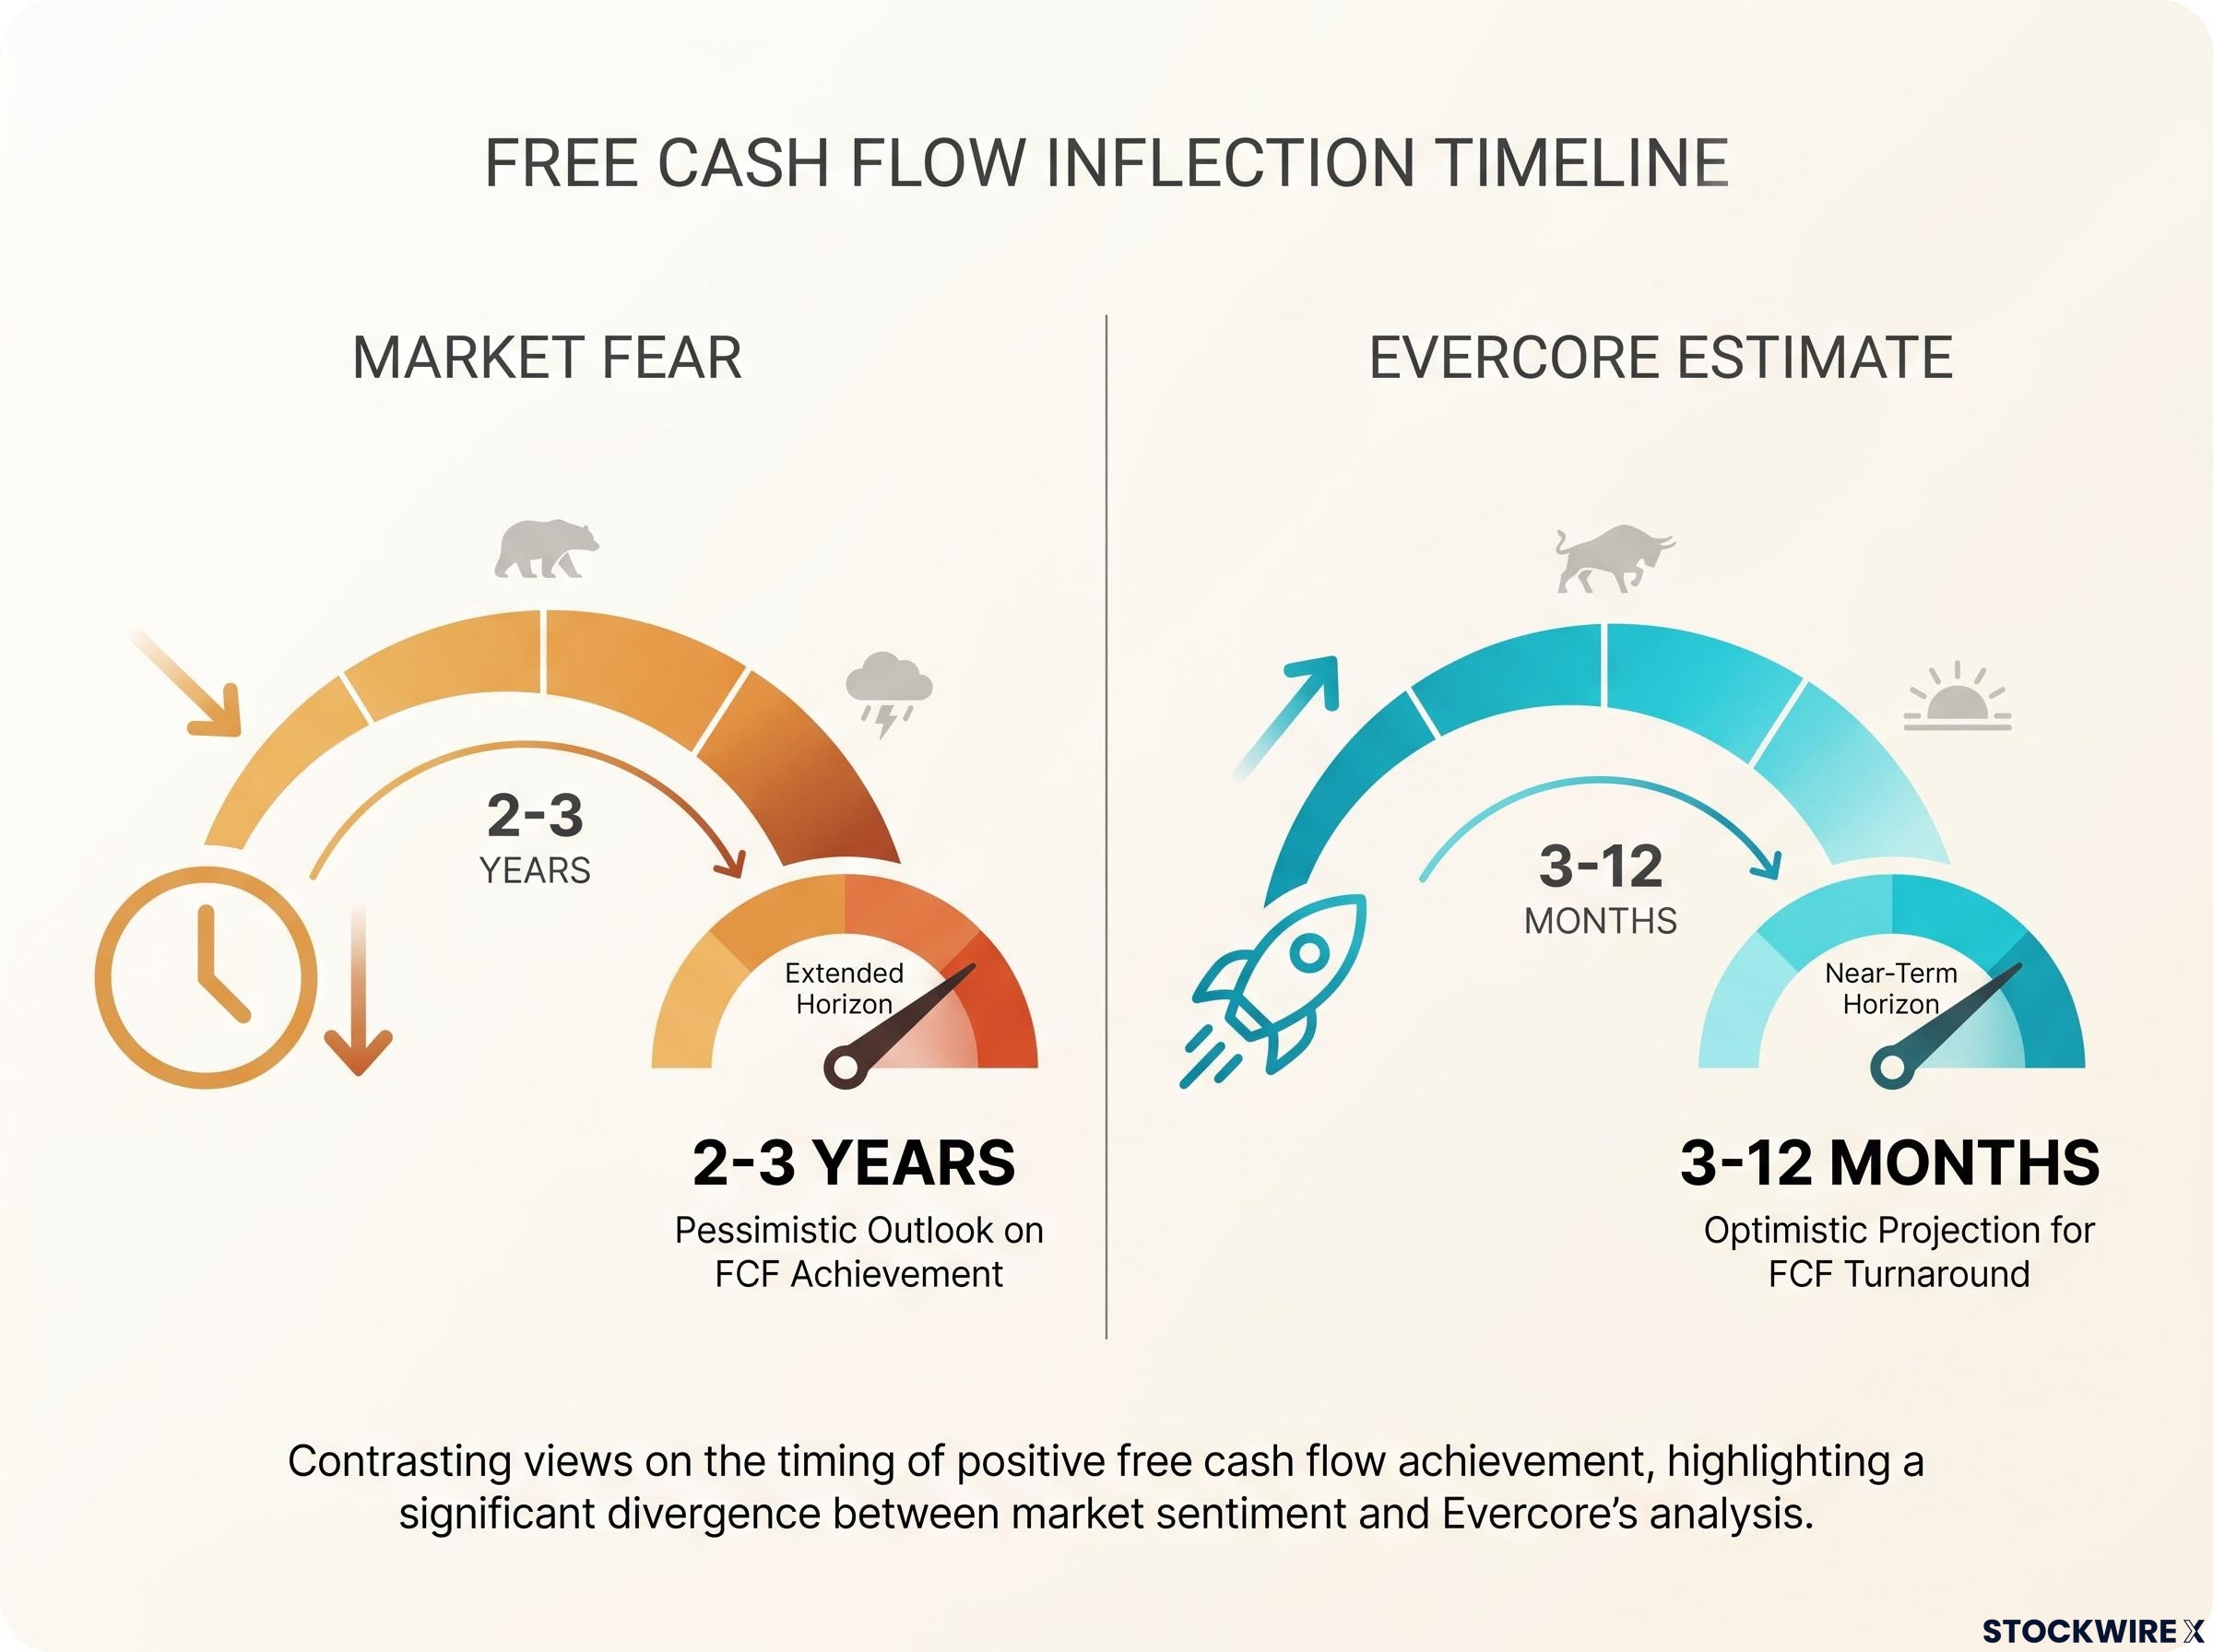
The market fears a negative FCF stretch of 2-3 years. Evercore sees an inflection within 3-12 months.
The Brookings Papers on Economic Activity research on the AI buildout compares today’s spending with earlier waves such as railroads and telecommunications, which suggests early cash flow compression is a familiar pattern, though the payback timing varied widely.
Damodaran adds an asterisk, though: the payoff depends on capacity actually being used. For you, negative FCF today speaks to the timing of spending rather than the quality of the business, but only if that condition holds.
Amazon, Alphabet and Meta: what the latest cash flow numbers actually show
The theory sounds tidy. The reported numbers are rougher.
| Company | 2026 capex guidance | Latest operating cash flow | Latest free cash flow | Key note |
|---|---|---|---|---|
| Amazon | ~$220B | ~$161.4B (TTM, Q2) | ~-$7.6B (TTM, Q2) | Was +$18.2B a year earlier; guide raised from ~$200B on memory costs |
| Alphabet | ~$195-205B | ~$39.1B (Q2) | ~-$5.9B (Q2) | First negative quarter since 2004 IPO; Q2 capex ~$44.9B |
| Meta | ~$130-145B | $31.86B (Q2) | $784M (Q2) | Sharp compression from prior periods |
Microsoft is the only major U.S. hyperscaler still producing consistently positive FCF, according to Investing.com. A DigitalApplied scorecard dated 31 July 2026 put combined 2026 capex guidance for Microsoft, Meta and Alphabet at about $500-525 billion before Amazon is even added. Broader estimates of total hyperscaler spending have not been independently confirmed, and no 2027 capex consensus is available for the three companies.
The most demanding figure belongs to Amazon. Yahoo Finance calculates that funding $220 billion of capex purely from operating cash would require roughly 58% operating cash flow growth, well above the current 33% pace.
Amazon’s Q2 earnings showed AWS accelerating at scale while trailing free cash flow swung negative, and the split between operating income and one-off investment gains makes the cash flow picture easier to read than headline net income.
What this tells you is that the fear of weak FCF is grounded in reported results. The bullish case rests on future revisions, not on anything that has already happened.
The bear case on cash burn
Damodaran’s utilisation asterisk is the sharpest risk. If new capacity sits underused or is misallocated, FCF could grow slowly or not at all, regardless of revenue headlines.
Balance sheets add a second layer. Rising leverage alongside negative FCF could limit flexibility or force spending cuts if AI returns disappoint.
Yahoo Finance (9 October 2026) frames cash burn as the leading bear risk, and Investing.com (7 August 2026) warns investors may be underestimating how long the squeeze lasts. Neither disputes AI’s long-term potential. The argument is about duration and returns.
Weighing the call: a framework for sector sentiment versus company cash flow
Evidence only helps if it shapes a decision. The cleanest way to approach this one is to recognise that Mahaney is making two arguments at once.
Mahaney’s core view The group’s underperformance is cyclical and sentiment-driven, and positive FCF inflections at the hyperscalers could act as a catalyst for correcting what he sees as market mispricing.
The first layer is sector sentiment: valuations, the energy shock and IPO supply. The second is company cash flow: whether Amazon, Alphabet and Meta convert record spending into cash on Evercore’s timeline.
These are not the same bet. Booking, Expedia, Shopify and Uber sit in the 19-stock basket, but their problem is disruption, not capex. A hyperscaler FCF recovery does nothing to answer whether AI agents erode a travel booking platform’s take rate.
Evercore’s 3-12 month window gives you a testable timeframe. These are the signals to track within it.
Signals that support the thesis:
- Upward revisions to hyperscaler revenue and operating income estimates
- Capex growth slowing, even if absolute spending stays high
- Operating cash flow growth closing in on capex, with Amazon’s 58% hurdle as the benchmark for ambition
Signals that challenge it:
- Evidence of underused data centre capacity
- FCF staying negative or near zero through further quarters
- Rising leverage to fund spending
The research does not quantify comparisons with the 2022 internet selloff or earlier capex cycles, so history offers framing here, not a recovery timetable. Before buying, decide which bet you are actually making: a sentiment rebound across the sector, or a cash flow turn at three specific companies.
These views are forward-looking and speculative, and subject to change with market developments and company performance. Past performance does not guarantee future results.
What would change the case, and what to watch over the next 12 months
The 18% discount blends fading sentiment with real cash flow questions. Valuations, energy costs and IPO supply may ease on their own; capex payback and Muse Risk will not resolve without evidence.
The useful feature of Evercore’s thesis is that it sets its own deadline. Within 3-12 months, the numbers will either move its way or they will not.
Three checkpoints matter most. Watch the next quarterly results for operating cash flow against capex at Amazon, Alphabet and Meta. Watch for any shift in 2027 capex guidance. And watch for early signs that AI agents are pulling traffic away from search, social and marketplace platforms.
If cash flow turns while spending growth cools, the case strengthens. If it does not, the discount may be pricing something lasting.
This article is for informational purposes only and should not be considered financial advice. Investors should conduct their own research and consult with financial professionals before making investment decisions.