If the Fed raised rates in September, you might assume another hike is coming at the next meeting. Governor Christopher Waller thinks otherwise. On 8 October 2026 he said further hikes “do not need to come at consecutive meetings,” and futures put the odds of a hike at the October Fed decision at only about 17-20%.
That gap between a hawkish Fed and a calm October forecast is where things get interesting. The federal funds rate now sits at 3.75-4.00% after September’s 25 basis point hike. The 27-28 October Federal Open Market Committee (FOMC) meeting falls just after two big inflation readings: September consumer prices on 14 October and the University of Michigan consumer survey.
Those releases will test the dollar’s direction. Brown Brothers Harriman (BBH) already sees the risks for the US dollar tilted upward, and the reasons behind that view come later in this piece.
You will see how Fed communication, inflation data and rate expectations combine to move the dollar, and which signals deserve your attention before the decision on 28 October.
What is the Fed signalling, and why does the Summary of Economic Projections matter?
Here is an odd situation. The Fed chair refuses to take part in one of the central bank’s main forecasting tools, and a sitting governor has just publicly defended it.
Chair Kevin Warsh has declined to participate in the dot plot since taking the chair in May 2026. In his speech yesterday, Waller argued for keeping it. The disagreement matters for your portfolio because it shapes how the market prices rate hikes.
The Summary of Economic Projections (SEP) is a quarterly set of forecasts from Fed policymakers. Each participant records where they expect growth, inflation and interest rates to go. The “dot plot” is the chart showing each official’s expected rate path as a single dot. The SEP points to a likely direction without committing the Fed to it.
The dot plot is easy to misread, because a median projection can hide a committee split almost evenly between hikes, no change and cuts, which is why you should treat it as a signal of uncertainty rather than conviction.
The September SEP was clear. 16 of 18 participants expect at least one more hike in 2026, and 4 of those 16 expect two more. Markets read this as roughly 50 basis points of further tightening.
Waller on timing Additional hikes “do not need to come at consecutive meetings,” according to Governor Christopher Waller’s 8 October 2026 remarks.
Waller cited futures pricing that shows how closely the market follows the dots:
| Horizon | Number of hikes | Futures-implied odds |
|---|---|---|
| December 2026 | At least one | About 85% |
| December 2026 | Two | Nearly 20% |
| March 2027 | At least two | Nearly 80% |
| March 2027 | Three or more | 33% |
Why the SEP debate matters for volatility
Clear guidance lets markets adjust gradually. When traders already know the Fed’s rough direction, a single data release shifts prices a little rather than a lot.
Waller warned that dropping forward-looking communication could catch markets off guard and increase volatility. He suggested a replacement with “the flavor of forward guidance but isn’t forward guidance,” ahead of a task force report on the SEP due by year-end. For you, the takeaway is simple. The SEP is the main reason futures already price a hiking path. If the Fed changes how it communicates that path, expect bigger swings in yields and the dollar whenever new data arrive.
When big ASX news breaks, our subscribers know first
Which data points could tip the October Fed decision?
With the SEP setting expectations, the next few weeks of data will either confirm that path or weaken it. Here is the calendar in order:
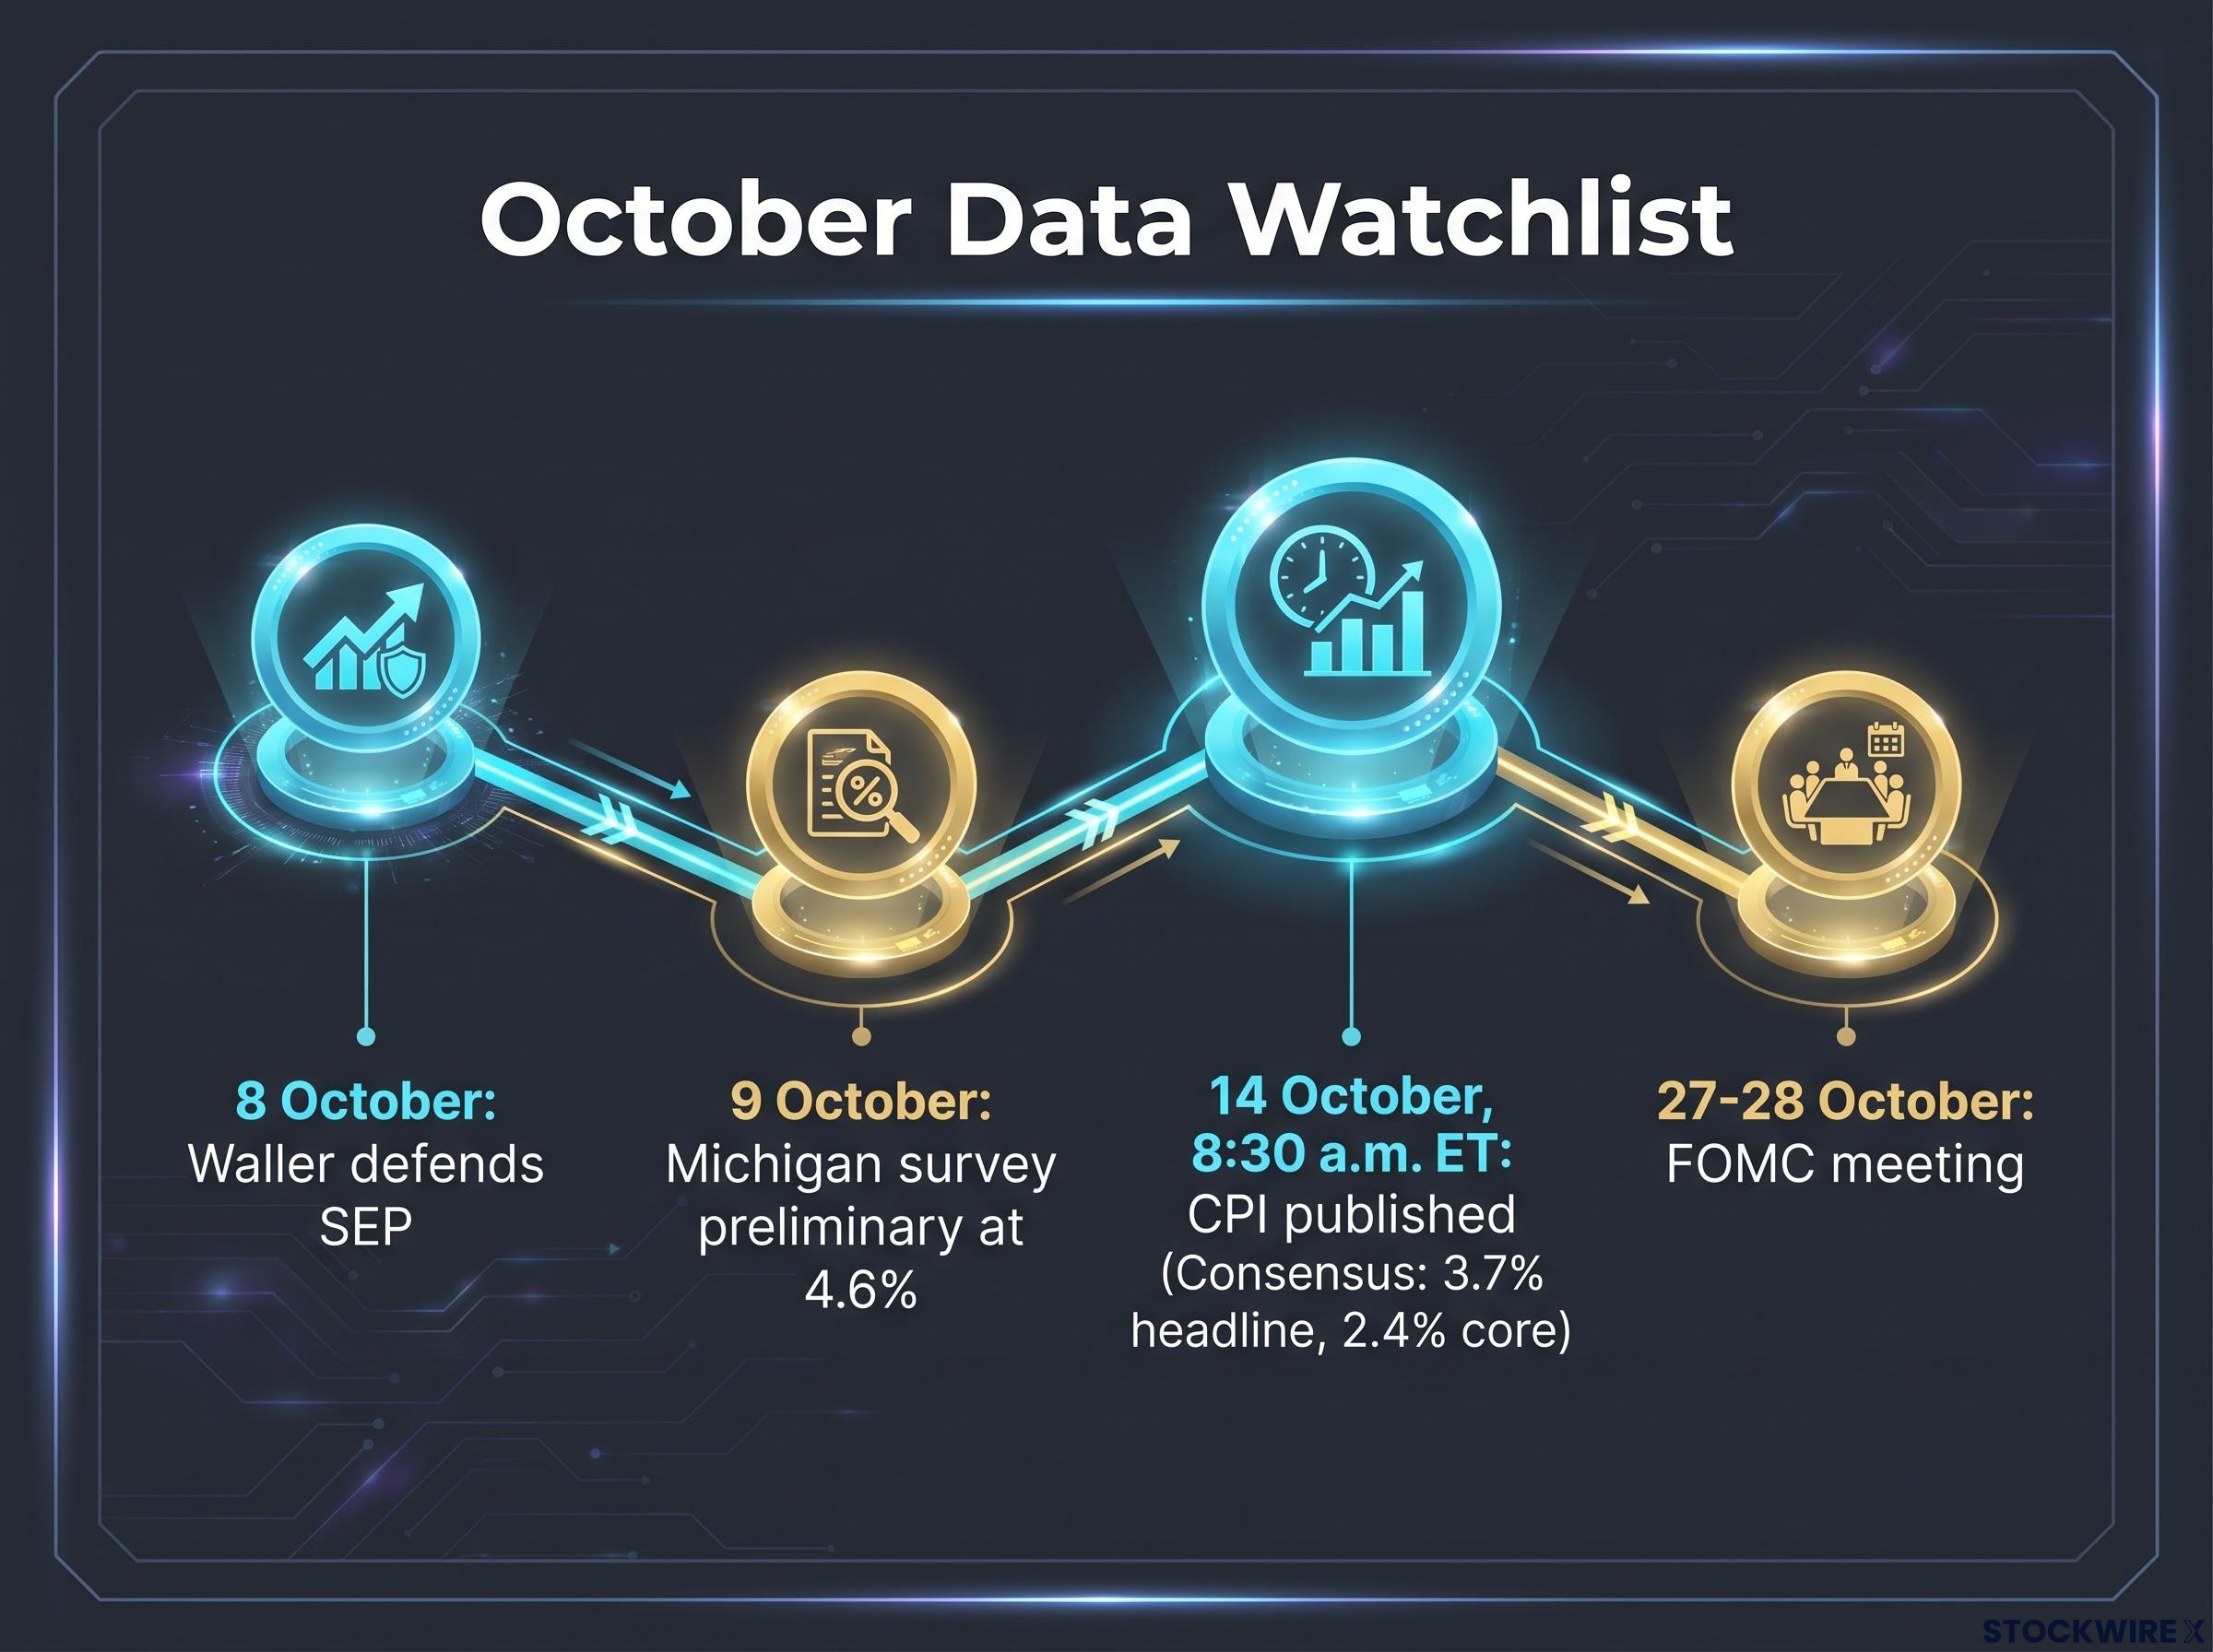
- 8 October: Waller defends the SEP and leaves room for non-consecutive hikes.
- 9 October: The preliminary October Michigan survey is released (today).
- 14 October, 8:30 a.m. ET: The September Consumer Price Index (CPI) is published.
- 28 October: The FOMC announces its decision after its two-day meeting.
CPI measures the change in prices US consumers pay for a basket of goods and services. “Core” CPI excludes food and energy, which tend to swing sharply.
Consensus expects headline CPI of about 3.7% year-on-year and core CPI of about 2.4%. A figure well above those numbers would push the roughly 17% October hike odds (per CME FedWatch in early October) higher. A softer reading would support a pause.
Some September CPI forecasts expect headline inflation to jump on gasoline while core cools, so the core reading, not the headline, is likely to carry the most weight for Fed policy.
Why the Michigan survey has two numbers to watch
The University of Michigan asks households what inflation they expect. Short-term expectations rose to 4.6% in September, up from 4.0% in August and the highest since June. Today’s preliminary October reading also came in at 4.6%, though September remains the latest final figure.
The longer horizon tells a calmer story. Five-to-ten-year expectations were 3.4% in September, only slightly above the roughly 3.3% of prior months.
| Measure | Consensus or prior | Latest reading |
|---|---|---|
| Headline CPI (Sept, y/y) | About 3.7% consensus | Due 14 October |
| Core CPI (Sept, y/y) | About 2.4% consensus | Due 14 October |
| Michigan 1-year expectations | 4.0% (August) | 4.6% (Sept final; Oct prelim also 4.6%) |
| Michigan 5-10-year expectations | About 3.3% (prior months) | 3.4% (Sept) |
The 4.6% figure tells you households feel inflation sharply right now. The long-term number matters more for the Fed. As long as it holds steady, the Fed is less likely to see expectations becoming “de-anchored” (drifting permanently higher) in a way that would force an October move.
Hike or pause: how strong is each case?
Both sides have a real argument. A hike in October has support from elevated expectations and the dots. A pause has support from the futures market and Waller’s own wording.
| Case for a hike | Case for a pause |
|---|---|
| Short-term inflation expectations at 4.6% | October hike odds of only about 17% |
| 16 of 18 officials see at least one more 2026 hike | Waller says hikes need not come at consecutive meetings |
| Waller favours a timely return to 2% inflation | Some coverage points to softer data since September |
| A renewed energy spike could revive aggressive-hike arguments | Falling energy prices have eased the global bond sell-off |
Each path carries its own risks:
- Growth slowdown: Hiking again quickly could add pressure to an economy already showing signs of softer labour data, according to some reports.
- Energy reversal: The recent energy retreat has calmed bond markets, and a fresh spike would undo that relief.
- Policy error: Spacing hikes out lowers the risk of over-tightening in response to short-lived inflation spikes.
Some market commentary points to past mid-cycle pauses, such as 1994-1995 and the 2015-2018 cycle, as precedent. Treat those comparisons cautiously, because each cycle had different conditions.
Now look at the numbers together. October odds sit near 17%, while odds of at least one hike by December sit near 85%. Those two figures are not in conflict. Waller’s language makes a pause in October and a hike later fully compatible.
That is the trap to avoid. A “Fed holds” headline on 28 October would not mean tightening is over, and you should not read it as dovish by default.
For readers wanting to map the hike to their holdings, our full explainer on Fed hike portfolio implications shows how higher rates affect equity valuations and bond duration.
How do Fed signals and inflation data move the dollar?
If a pause does not end the cycle, what actually moves the dollar? The answer runs through a chain of four links:
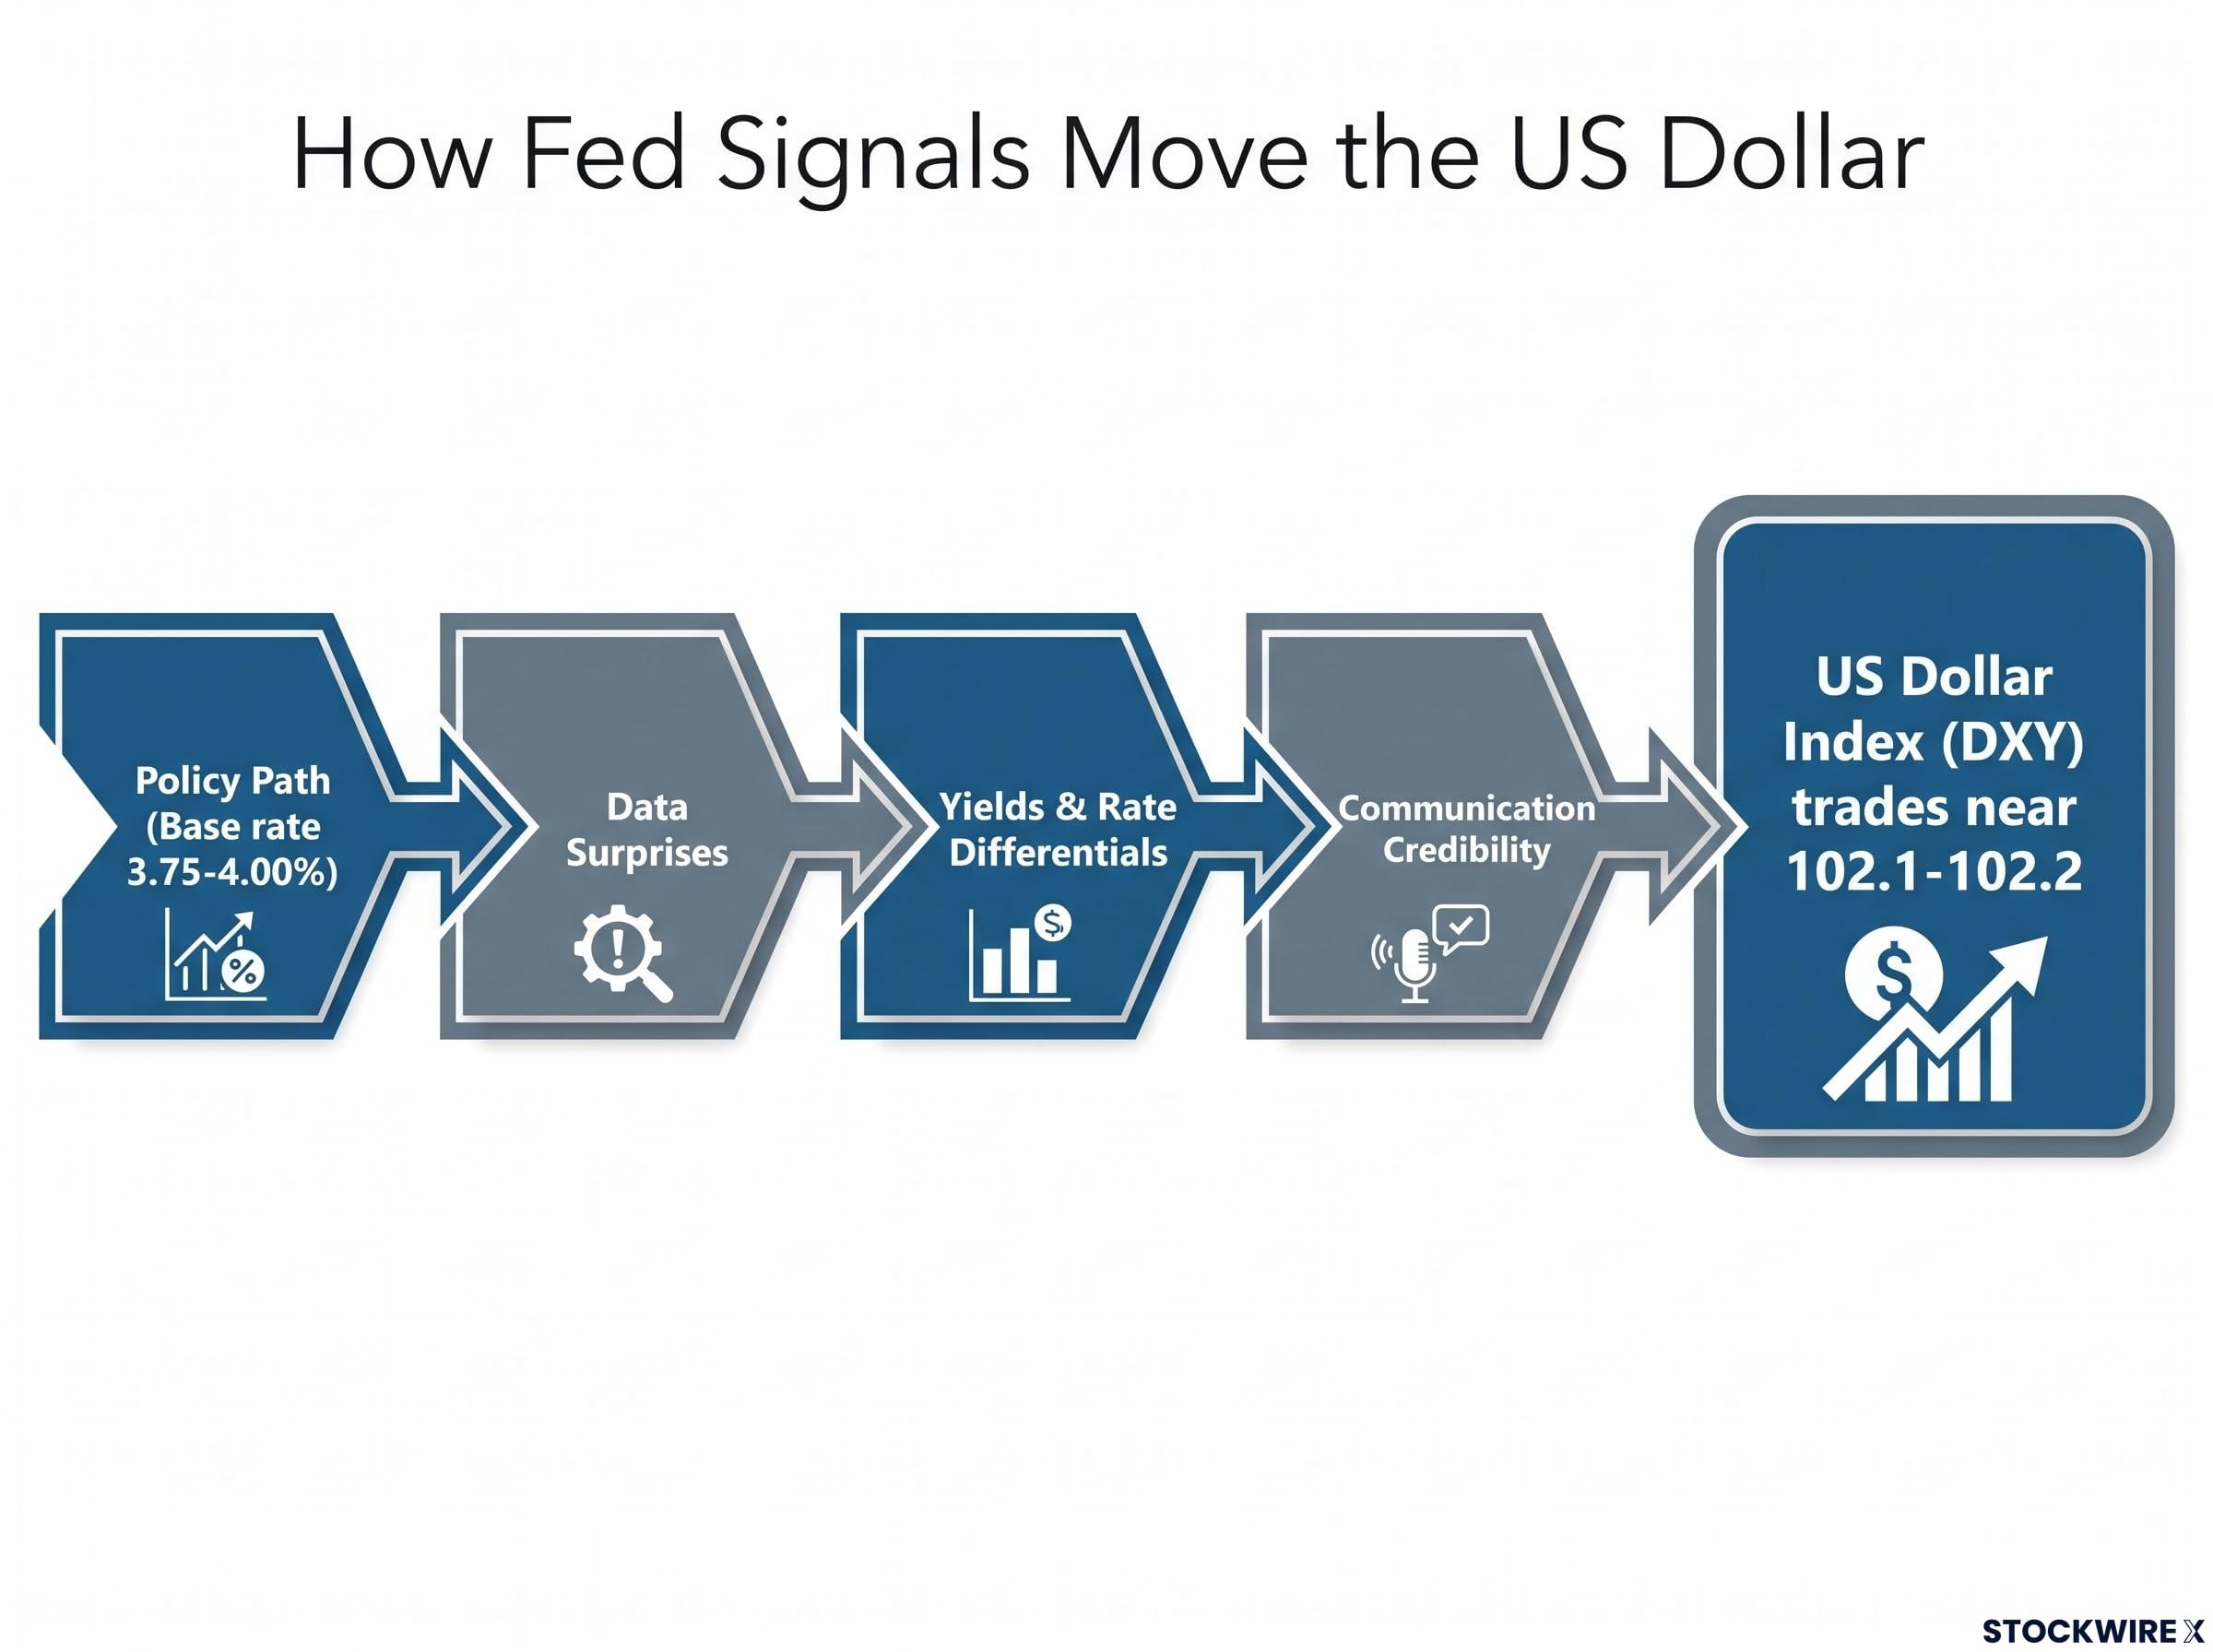
- Policy path: A 3.75-4.00% rate plus dots showing more hikes sets a restrictive expected path, which raises expected short-term rates.
- Data surprises: Hot inflation or expectations data lift hike odds; soft data cut them.
- Yields and rate differentials: Higher expected US rates push Treasury yields up relative to other countries. That gap, called the rate differential, draws money into dollar assets.
- Communication credibility: Clear signalling keeps these moves orderly; less guidance means sharper reactions.
The US Dollar Index (DXY), which tracks the dollar against a basket of major currencies, traded near 102.1-102.2 in early October. Slightly lower energy prices have calmed the worldwide selloff in bonds, which has taken some momentum out of the greenback’s latest climb.
Oil and Treasury yields are also driving the DXY, which is largely a euro trade, so the rate gap with Germany matters as much as any single Fed decision for the dollar’s direction.
| CPI scenario | Hike odds | US yields | US dollar |
|---|---|---|---|
| Hot (above 3.7%) | Likely rise | Likely higher | Likely stronger |
| In line | Little changed | Little changed | Later-hike path stays intact |
| Soft (below consensus) | Likely fall | Likely lower | Upside capped as pause narrative revives |
BBH is leaning toward the stronger outcome.
BBH’s dollar view Elias Haddad of Brown Brothers Harriman sees US dollar risks tilted upward despite the energy pullback, citing stronger US growth relative to other economies and strong overseas demand for US securities (via FXStreet, 8-9 October 2026).
No other strategist views were found in the research, so treat this as one firm’s call rather than consensus. The broader lesson for you is that the dollar cares less about whether the Fed hikes in October than about whether data keep the later-hike path believable. In practice, the 14 October CPI print may matter more than the meeting itself.
These scenarios are illustrative. Past performance does not guarantee future results, and market reactions depend on conditions at the time.
What to watch between now and October 28, and what stays uncertain
The pieces fit together in a clear sequence. The SEP shapes what futures price, CPI and Michigan data test that pricing, and the dollar follows the expected rate path more than any single meeting.
Your short watch-list:
- The September CPI print on 14 October at 8:30 a.m. ET
- Any renewed move in energy prices
- Further Fed commentary before the pre-meeting blackout period
Keep the uncertainty in view. Every probability cited here is futures-implied and can shift within hours of a data release. The SEP task force report, due by year-end, could also change how the Fed talks about its path.
After 28 October, attention moves to the December meeting, where futures price about 85% odds of at least one hike, and then to March 2027. These forward-looking estimates are speculative and subject to change as conditions develop.
This article is for informational purposes only and should not be considered financial advice. Investors should conduct their own research and consult with financial professionals before making investment decisions.