The S&P 500 barely moved on a recent session, slipping about 0.12% in futures trading. One active trader watched most of his holdings fall 2-5% over the same hours, and one position dropped 7.26%. When the index looks calm and individual stocks are sliding, the headline number is hiding something, and market breadth is the tool that shows what.
As of 8 October 2026, only about 32.2% of S&P 500 stocks traded above their 50-day moving average. Over the same year-to-date period, the cap-weighted SPY fund had gained 14.38%.
That gap matters. If you judge your portfolio’s health by where the index closes, you may miss a slow erosion in the stocks you actually own.
This piece gives you a way to read what sits beneath the index level and a practical view on how stock selection fits a narrow market. It also explains why a possible mega AI listing could test the whole trade.
What is the index not telling you about market breadth?
Market breadth measures how many stocks take part in a move, not just how far the index travels. The current readings show a market rising on fewer and fewer legs.
Start with trend. About 32.2% of S&P 500 members sit above their 50-day average and about 46.8% above their 200-day, according to MacroMicro and thetrading.tools data drawn from S&P Dow Jones Indices. Most stocks, in other words, are below their own long-term trend while the index climbs.
The divergence in one line Only 32.2% of S&P 500 stocks are above their 50-day average, yet SPY is up 14.38% year to date.
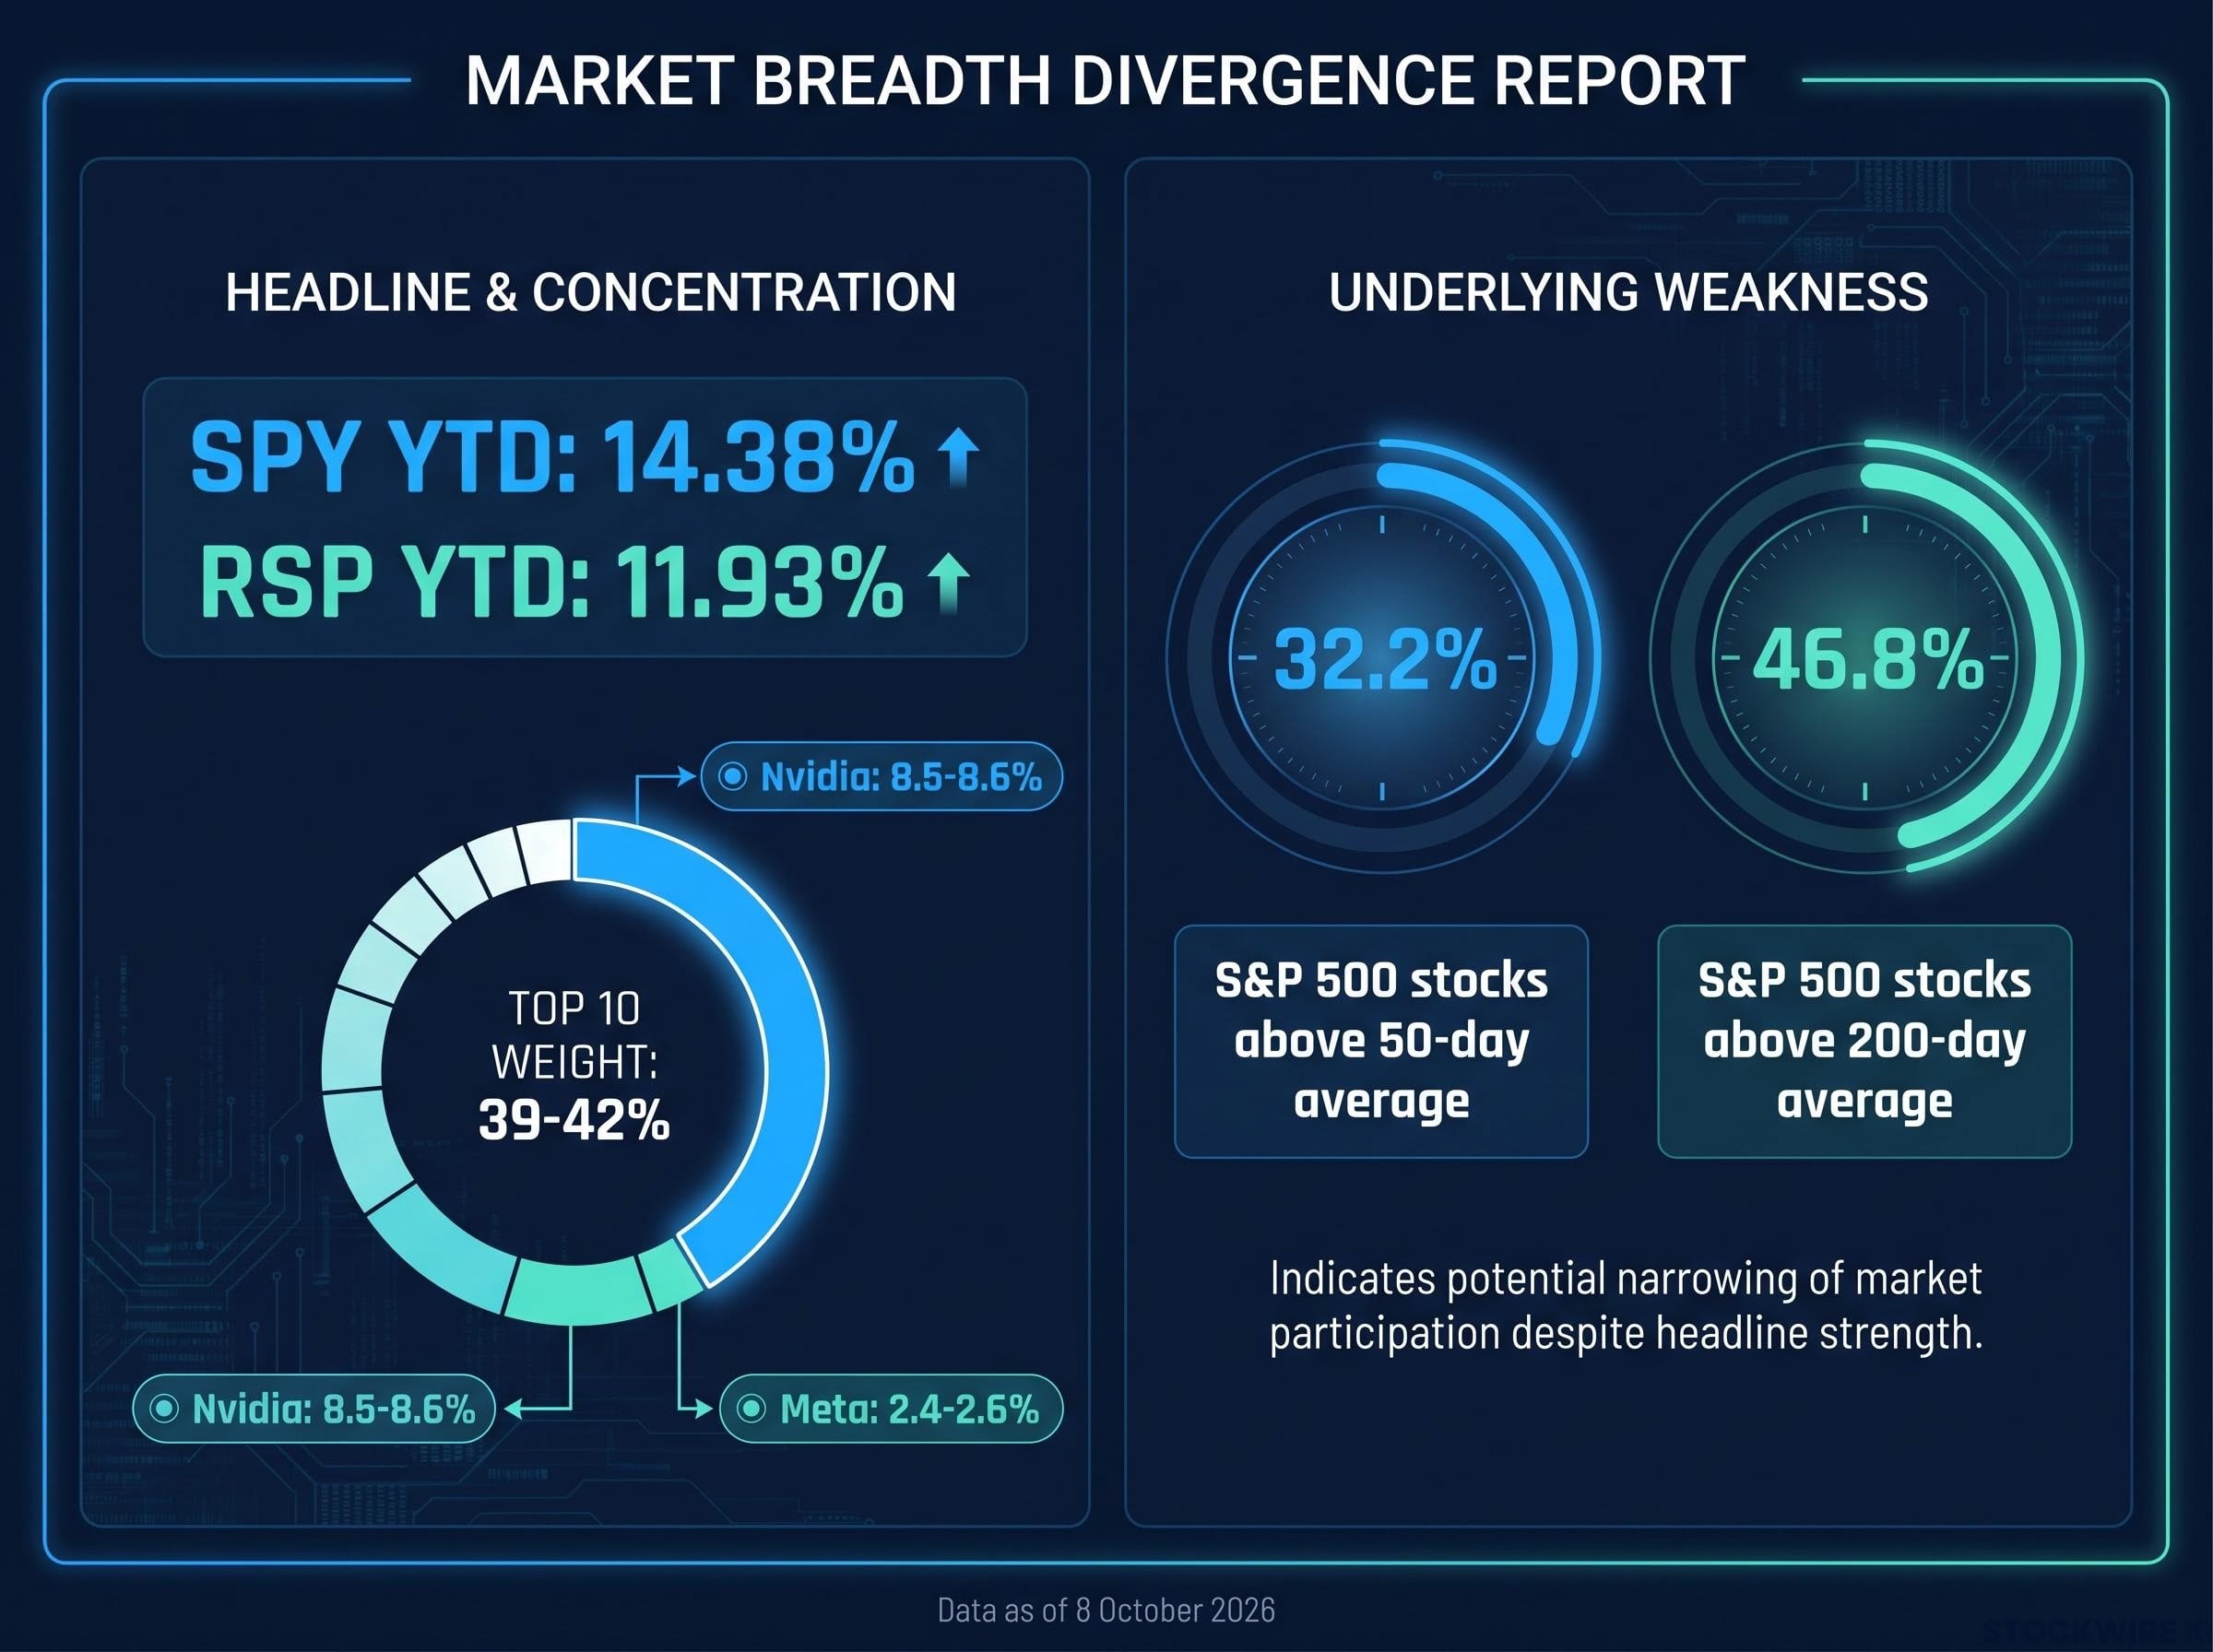
The equal-weight view confirms it. RSP, which gives every member the same weight, is up 11.93% against SPY’s 14.38%, so the average stock is trailing the index.
Concentration explains the gap. The top 10 constituents make up roughly 39-42% of index weight, with Nvidia at about 8.5-8.6% and Meta at about 2.4-2.6%, per SPY holdings data. Weights are not a measure of return contribution, but they show how much of the index’s stability depends on a handful of names.
Semiconductor concentration illustrates the point: roughly 19 chip stocks have driven about 70% of the index’s market capitalisation gains this year, while dozens of other constituents have touched 52-week lows.
| Metric | Current reading | What it signals |
|---|---|---|
| Stocks above 50-day average | 32.2% | Short-term participation is weak |
| Stocks above 200-day average | 46.8% | Fewer than half are in long-term uptrends |
| SPY year to date | 14.38% | Headline strength led by large names |
| RSP year to date | 11.93% | The average stock lags |
| Top 10 weight | 39-42% | Index depends on a few megacaps |
What this tells you is simple. The further your holdings sit from the top 10, the more your results may differ from the headline.
When big ASX news breaks, our subscribers know first
Fragile or durable: how to read narrow leadership
Narrow breadth is not in dispute; its meaning is. No named strategist commentary from 2025-2026 surfaced in the research, but two schools of thought frame the debate.
The case for caution
The risk-signal camp argues that index strength masks weakness underneath. If the leaders stumble, the laggards offer no cushion. This camp points to the late-1990s dot-com boom and the post-COVID megacap rally, when narrowing participation came before bouts of volatility.
The case for persistence
The structural camp sees concentration as a feature of modern markets. Dominant platforms, winner-take-most technology economics and heavy passive flows can keep leadership narrow for years, provided earnings and cash flow justify valuations.
The two views split on three questions:
- Cause: Speculative crowding (caution) versus genuine platform dominance (persistence)
- Duration: Unstable and short-lived versus sustainable for years
- What breaks it: A leadership stumble versus a failure of earnings to keep pace with valuations
The evidence that tips the balance is fundamental: earnings, cash flows and balance sheets. Narrow breadth is a condition to monitor, not a timing signal. Treat it as a prompt to check what your holdings actually earn, not as a reason to sell.
Why a narrow market can be a stock-picker’s market
The trader behind the opening example works bottom-up. He screens hundreds to thousands of charts and ranks the strongest setups, betting that individual names matter more than the index right now.
What dispersion means
Dispersion is the spread between the returns of individual stocks. High dispersion means winners and losers are pulling far apart.
Korea offers an extreme example, though the figures are unverified and dated. SK Hynix was reported up roughly 250-340% year to date in late May and June, while the KOSPI was reportedly up about 95% as of late May. The trader’s view follows from this: when stocks diverge this widely, opportunities exist whatever the broad market does.
The implication is direct. The gap between your best and worst pick can now exceed the gap between the index and the market, so selection quality matters more than it did when everything rose together.
Using moving-average screens without being fooled
A moving average is the average closing price over a set number of days. The 50-day tracks the intermediate trend; the 200-day tracks the long-term trend.
Long-run backtests show that 50-day and 200-day signals arrive late by design, which is why a breach works better as a risk-awareness prompt than as an automatic sell trigger.
| What the screen shows | Strength | Common pitfall |
|---|---|---|
| Price vs 50-day average | Flags intermediate trend shifts early | Whipsaws in choppy markets |
| Price vs 200-day average | Filters for long-term direction | Breaches treated as automatic sell signals |
| Ranked trend screens | Surfaces leaders quickly | Ignores fundamentals and concentrates in the same megacaps |
A layered process limits those weaknesses:
- Screen for technical strength using the 50-day and 200-day averages.
- Verify fundamentals: growth durability, margins, capital intensity and valuation.
- Size positions and set volatility-based stops or risk limits.
- Stagger exits, and diversify across the AI stack and across geographies.
Could an Anthropic IPO test the AI trade?
The biggest test of AI enthusiasm may come from a company that is not yet listed. As of 9 October 2026, Anthropic remained private.
What is known about the deal
Reuters reported in late September that the expected listing valuation sits above $2 trillion, with the debut likely after the November midterm elections.
The valuation gap Reuters reports a target above $2 trillion, more than double the $965 billion private mark set in May.
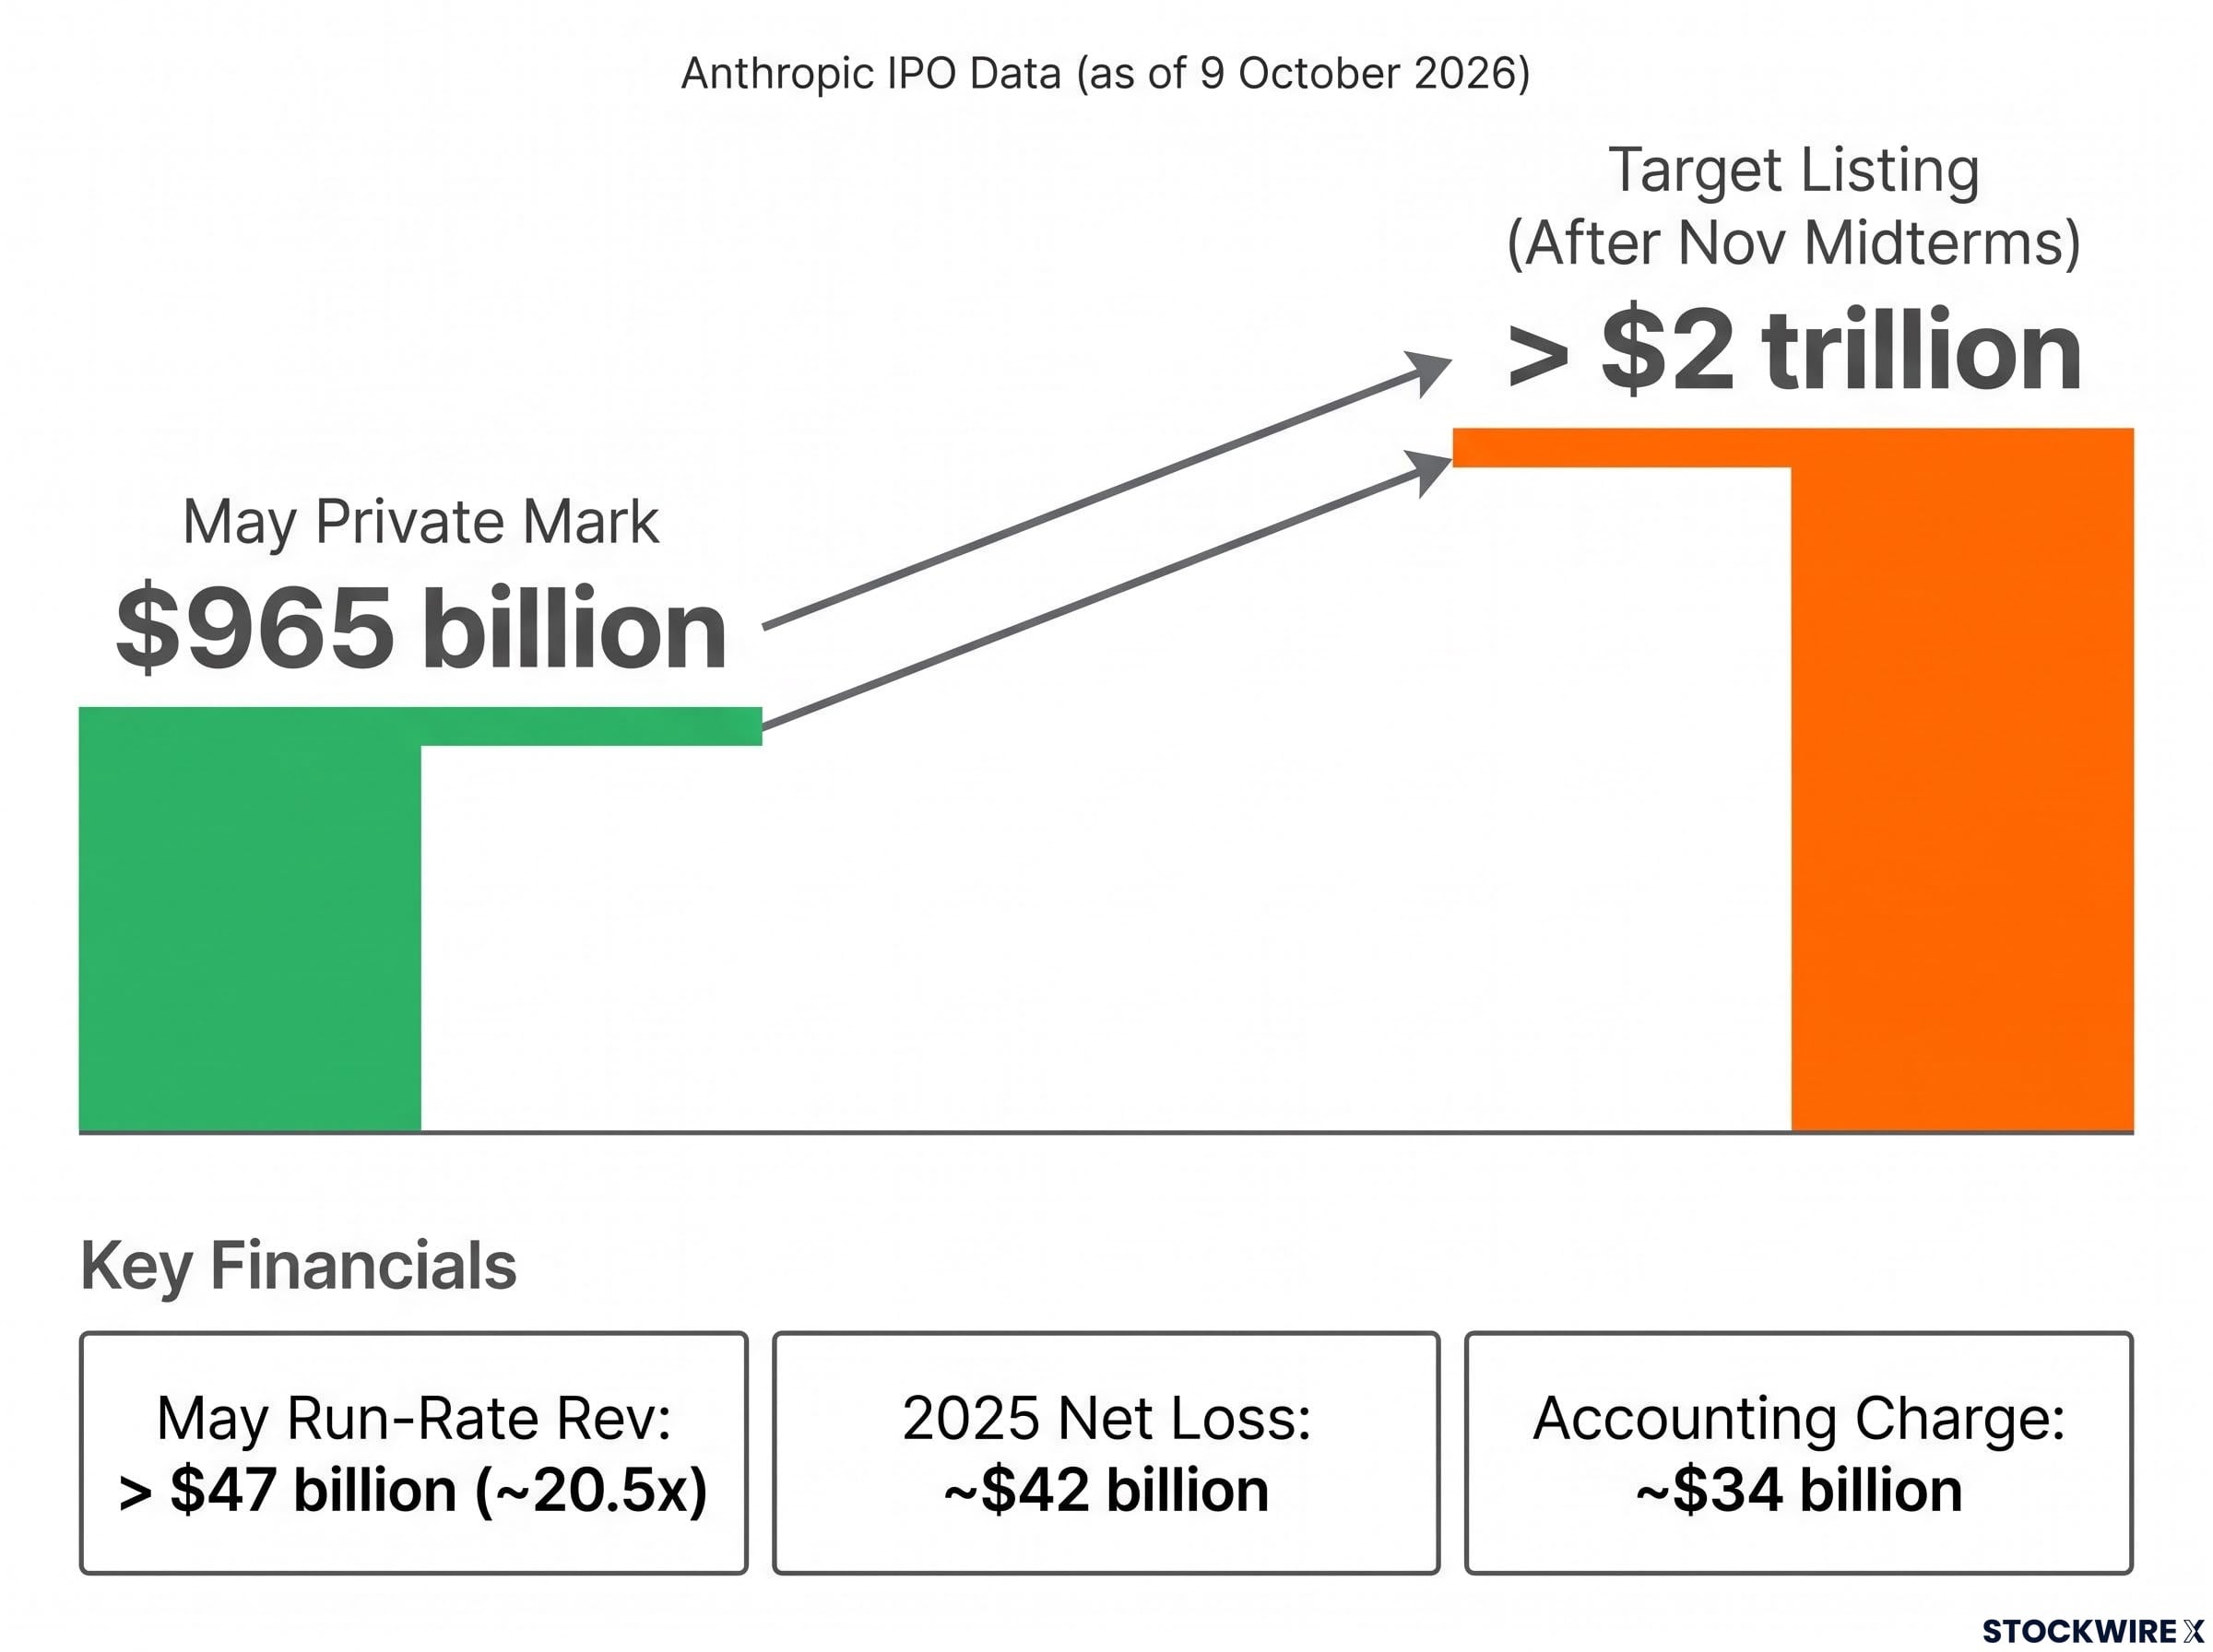
Run-rate revenue (the latest monthly figure annualised, not audited annual revenue) passed $47 billion in May, putting the May valuation at about 20.5x. Reuters also reported a 2025 net loss of nearly $42 billion, including a roughly $34 billion accounting charge tied to financing that could convert into shares.
Sources conflict. Mid-2026 coverage pointed to a fall listing near $1 trillion; later reporting points to a higher valuation and a later date.
How the offering could transmit to other stocks
Two mechanisms stand out:
- Liquidity drain and rebalancing: Investors may sell existing AI holdings to fund allocations, and eventual index inclusion would force mechanical rebalancing.
- Valuation reset: Buyers balking at above 20x run-rate for a loss-making company could shift sentiment across the theme.
The opposite outcome is plausible too: a strong, oversubscribed debut could extend enthusiasm. The trader, who ranks the IPO nearly as high as the election, watches three triggers:
- A scuttled IPO
- One weak quarter
- A major company saying AI is not moving its results
If you hold AI-linked megacaps, know your exposure before the prospectus numbers and the debut reaction arrive. This is a stress test, not a forecast.
March 2000, the Korean memory trade, and where the analogy breaks
The trader compares the setup to March 2000, when weak Microsoft earnings sparked a collapse. It is a tempting parallel, and it deserves scrutiny.
Why the 2000 comparison tempts and where it fails
In 2000, megacap tech hit an earnings disappointment while speculative listings strained capital. A giant AI listing could look like a late-cycle echo, but no equivalent trigger has appeared, and Nasdaq 100 futures have held above their breakout level.
| Factor | March 2000 | Today |
|---|---|---|
| Trigger | Weak Microsoft earnings | None so far |
| Company fundamentals | Many speculative listings | Leaders generate substantial revenue and cash flow |
| Market structure | Simpler plumbing | Passive flows, derivatives, cross-listings |
| Balance sheets | Simpler structures | Anthropic’s losses partly accounting-driven |
History also tempers the fear. Facebook in 2012, Alibaba in 2014 and Saudi Aramco in 2019 disrupted markets temporarily without ending the trends around them.
The dot-com comparison is imperfect: hyperscalers trade near 26-28 times forward earnings versus roughly 66 times at the 2000 peak, yet record index concentration keeps the structural risk alive.
One trader’s positioning as a case study
The trader holds a concentrated position in South Korean semiconductors. SK Hynix was reportedly near $1 trillion in value, and Samsung and SK Hynix reportedly pledged to return over 50% of cumulative 2025-2027 free cash flow, about US$170 billion by Bloomberg’s calculation; both claims are unverified.
He covered his largest ETF position, DIA, held via YM futures, mostly out of satisfaction with the profit, which he concedes is usually a poor reason to sell. He keeps a small MSTR position with a stop.
The lesson for you: a reasoned downside case is not a prediction. Plan exits and sizes now, while the trigger is still hypothetical.
Three checkpoints for a narrow market
Breadth readings of 32.2% and 46.8%, plus RSP’s lag behind SPY, show how thin this rally is. Selection discipline and IPO risk sit on top of that base. Watch:
- Whether the share of stocks above the 50-day and 200-day averages recovers or falls further
- The Anthropic prospectus figures and debut reaction, reportedly after the November midterms
- The first earnings disappointment from a major AI company
Whether you concentrate with discipline or diversify, the deciding factor is the same: an exit plan set before you need it.
This article is for informational purposes only and should not be considered financial advice. Investors should conduct their own research and consult with financial professionals before making investment decisions. Past performance does not guarantee future results, and forward-looking statements are speculative and subject to change.