On 7 October 2026, the International Energy Agency (IEA) agreed to speed up the largest emergency oil stock release in its history. European diesel prices rose anyway. That reaction looks like a contradiction until you separate what the decision sounded like from what it changed in physical supply.
The decision brought forward the outstanding portion of the 400 million barrel pledge first made on 11 March. It came with Brent near $100 a barrel and Washington weighing strike options against Iran. Diesel, already at or near record highs in Europe, absorbed the news as a disappointment rather than a relief.
If you trade energy stocks, hold transport or industrial names, or simply budget for fuel and heating, misreading a headline like this one can cost you. A bigger-sounding policy action is not the same thing as more barrels.
This diesel market analysis uses this week’s move as a worked example and turns it into a repeatable test for separating policy headlines from real changes in supply.
Why did diesel rise when the IEA moved faster?
The market heard “faster” and asked a sharper question: how much more? The answer was none.
On 11 March 2026, all 32 IEA members agreed to make 400 million barrels available, the largest coordinated release the agency has ever run. By early October, about 325 million barrels had reached the market. The remainder sits at roughly 75-100 million barrels, depending on the source, because the original pledge and the G7’s separate 100 million barrel release over four months are counted differently.
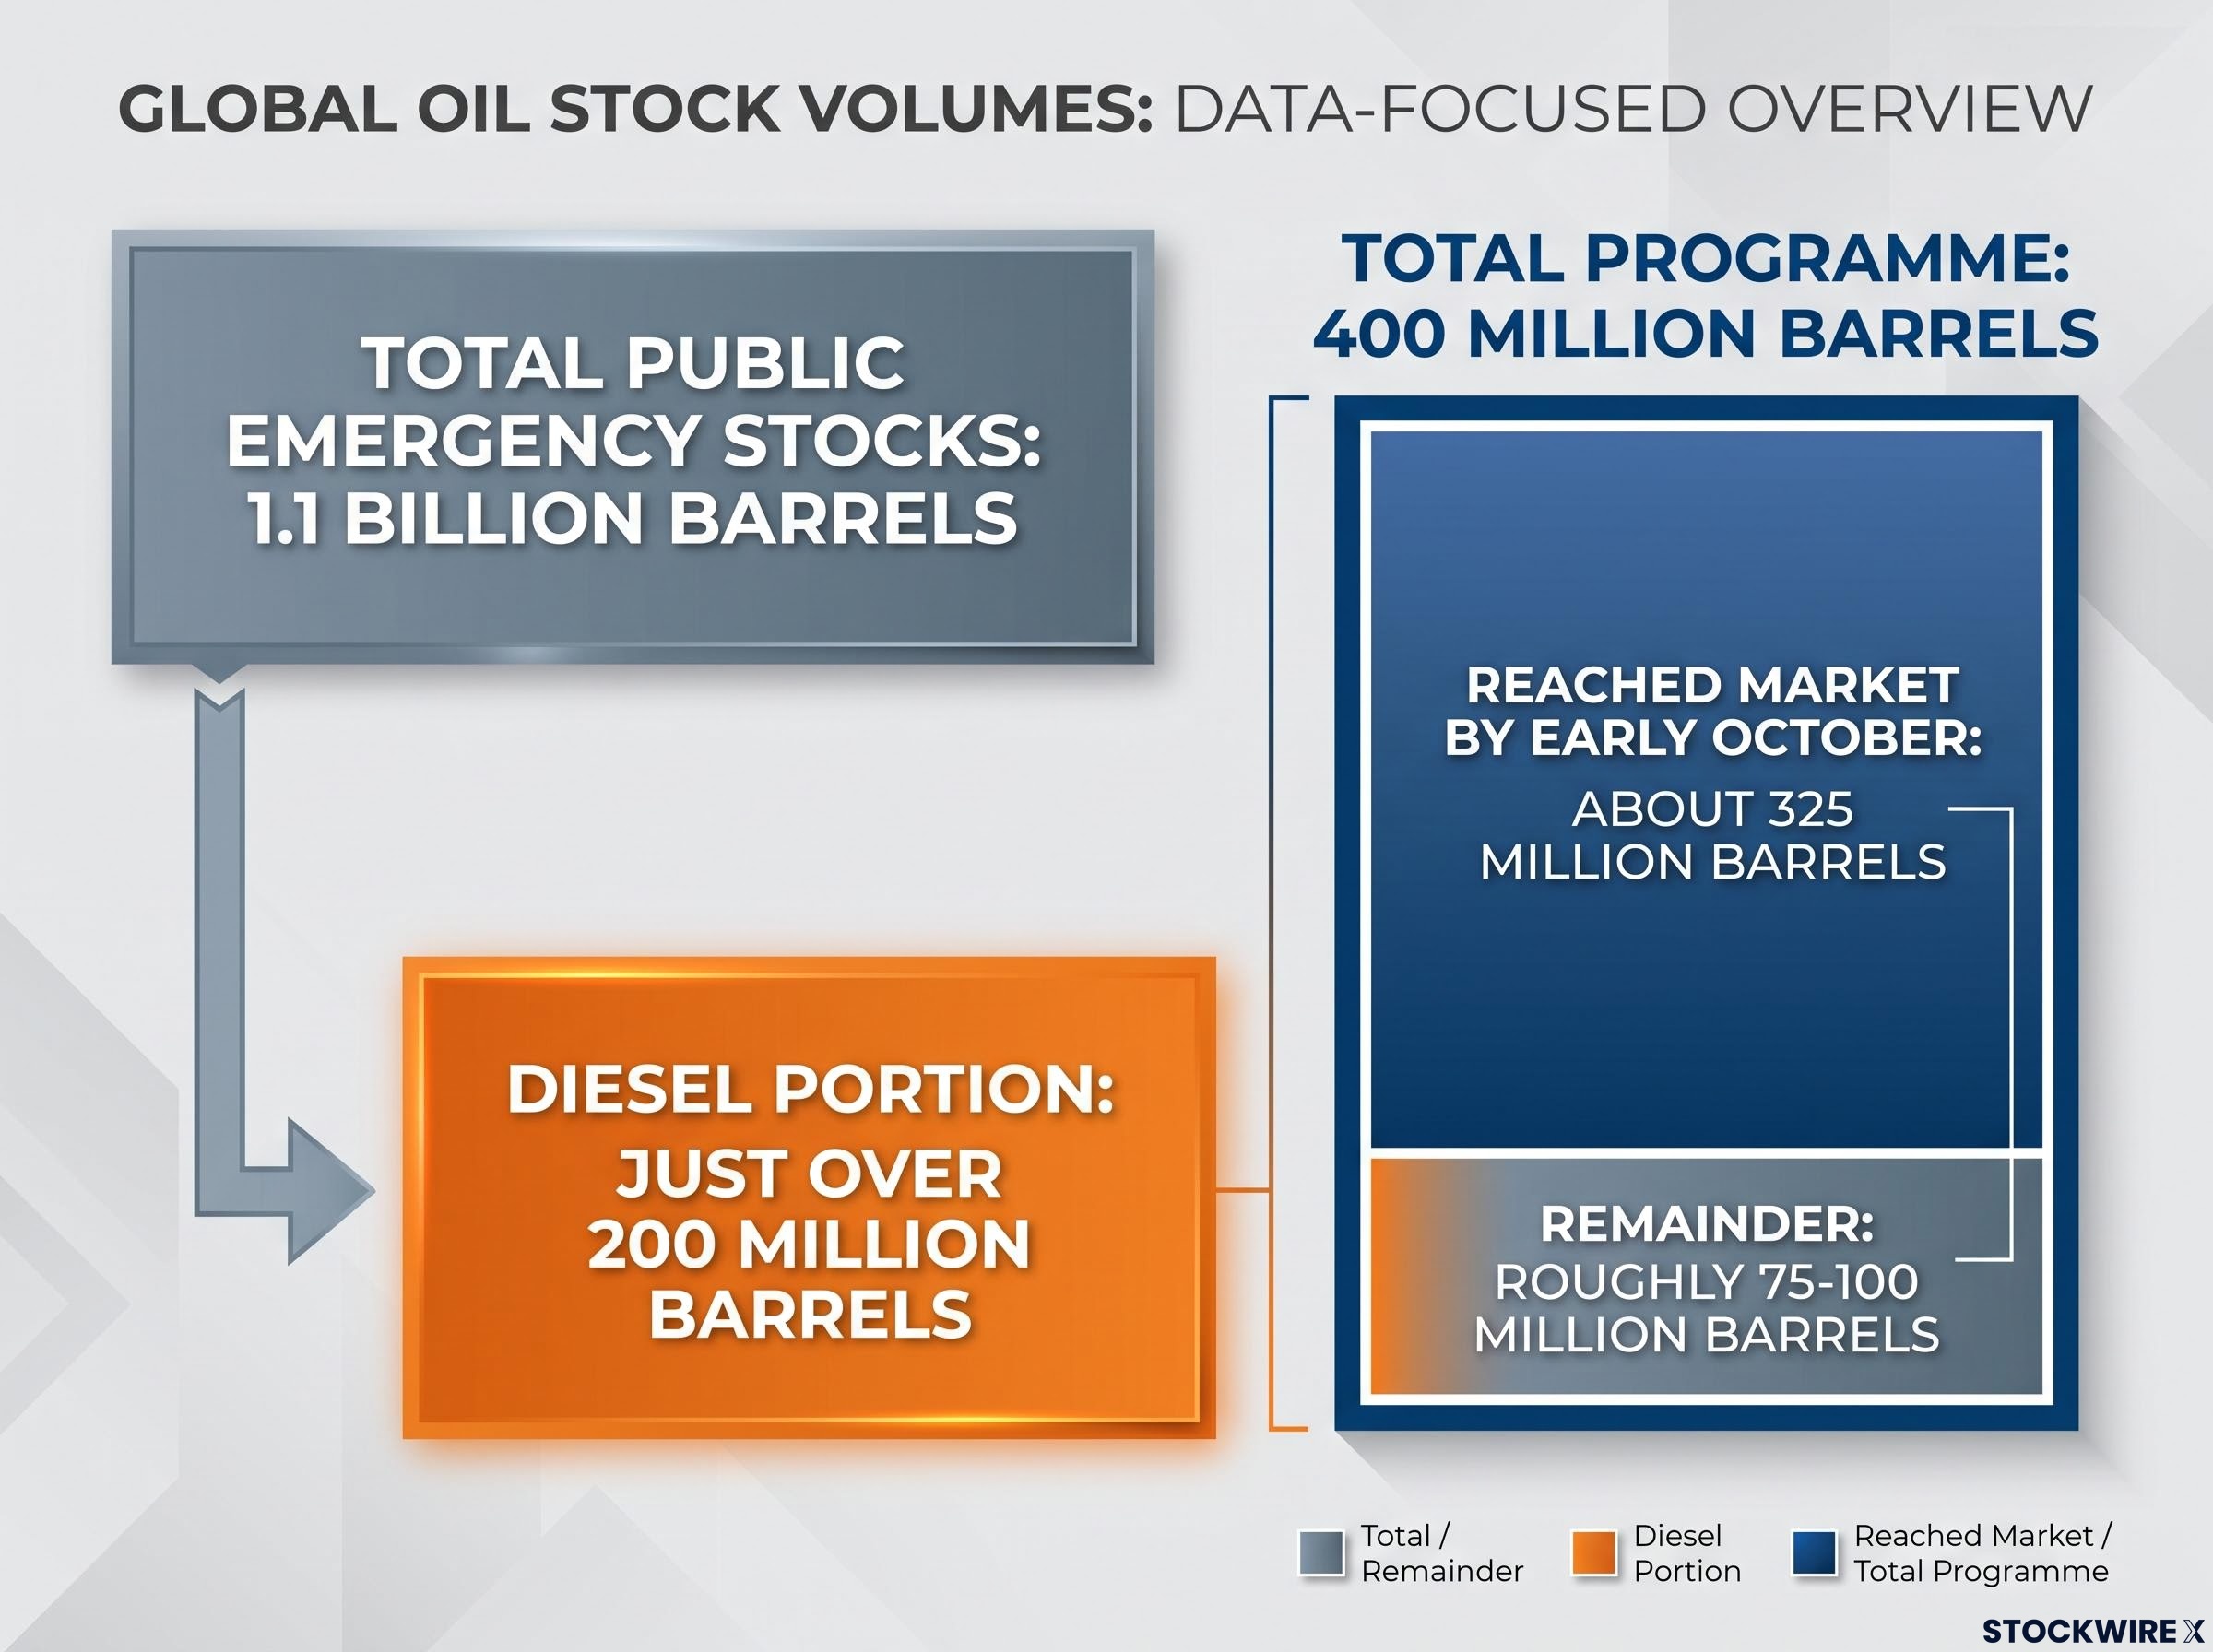
The 7 October decision accelerates that remainder. The 400 million barrel ceiling stays exactly where it was.
The separate G7 oil reserve release, phased over four months with a frontloaded diesel tranche, is counted differently by different sources, which explains why estimates of the remaining volume range so widely.
| Element | Announced | Changes total barrels? | Changes timing? | Market read |
|---|---|---|---|---|
| Acceleration of outstanding volumes | Complete “as soon as possible” | No | Yes | Relief borrowed from later months |
| Total programme | 400 million barrels | No | No | No new supply |
| Diesel prioritisation | “To the extent possible” | No | Possibly | Qualified, no volumes given |
| G7 release | 100 million barrels over four months | Counted separately by some sources | Yes | “Substantial” diesel in first 20 days, no breakdown |
The Danske Bank Research team put it plainly: investors saw no new supply in the step. Argus added that details on country contributions and diesel volumes remain scant. The diesel language itself carries a hedge:
IEA statement on diesel Members “supported the prioritisation of the release of diesel stocks, to the extent possible, given the current tightness in diesel markets.”
Members still hold about 1.1 billion barrels of public emergency stocks, but only just over 200 million barrels of that is diesel. The International Monetary Fund (IMF) warned of “lasting price pressures” alongside the meeting. European gasoil cracks have topped $38/bbl in some assessments; reports of a record physical crack near $98/bbl have not been independently confirmed.
What this tells you is that an accelerated release behaves like a loan from the future. Any relief you see now is borrowed, and the supply picture after the window closes may be tighter, not looser.
When big ASX news breaks, our subscribers know first
Why is diesel more fragile than crude?
If governments are releasing hundreds of millions of barrels, why can’t that fix a diesel shortage? Because most of those barrels are crude, and crude is not what trucks, tractors and boilers burn.
Refineries turn crude into a fixed spread of products. A refinery’s yield is the share of each barrel that comes out as diesel, gasoline or other fuels, and that share can only shift within a narrow range. Producing much more diesel means running harder or changing configuration, neither of which happens quickly.
Thin diesel inventories leave little room for error, with OECD stocks equal to only about 27 days of supply, so even partial easing of geopolitical risk cannot pull prices down quickly.
Four features make diesel react harder than crude to the same shock:
- Fixed yields: supply responds slowly when demand jumps or imports falter.
- Import dependence: Europe is structurally short diesel and long gasoline, relying on cargoes from the Middle East, the US and India.
- Thin inventories: the diesel cushion of just over 200 million barrels is a fraction of the 1.1 billion barrel total.
- Crack amplification: when diesel priority is only partial, traders bid diesel up relative to crude.
European diesel refining margins have surged on supply concerns, including from the US East Coast, and on geopolitics. Northwest European diesel cargoes have held their strength, and the market is widely described as tight. No dated move in ICE gasoil futures following the decision appears in the available research.
What a crack spread tells you
A crack spread is the difference between the price of a refined product and the price of the crude used to make it. If crude costs $100 a barrel and diesel sells for the equivalent of $130, the crack is $30.
When cracks widen, buyers are competing for scarce product rather than scarce crude. That is the signal in Europe now.
For you, the lesson is that crude at $100 and diesel at record levels are two different stories. Watching only Brent can hide where the real pressure sits: freight, farming and heating costs.
What is really moving through Hormuz?
The shipping data appears to contradict itself. Read it carefully and both halves turn out to be true.
Kpler counted only seven commodity vessels crossing the Strait of Hormuz on a Tuesday in early October, after the most intense week of tanker attacks since the Iran war began. Some days have seen 5-10 crossings, against pre-crisis norms of roughly 80-100+ per day.
Yet crude kept moving. Flows averaged about 10.1-10.3 million barrels per day (bpd) in early October, roughly 74-77% of the 13.5 million bpd pre-war baseline, with sources differing slightly. That figure was still 27% below the prior week’s wartime peak.
| Period | Vessel transits | Crude flows |
|---|---|---|
| Pre-war baseline | Roughly 80-100+ per day | 13.5 million bpd |
| July disruption | 23 vs 47 prior week (BBC); 13 tankers vs 33 average (CNBC) | Not specified |
| Early October | 5-10 on some days; 7 on one Tuesday | 10.1-10.3 million bpd |
Wider regional numbers look stronger still. Baird Maritime, citing provisional Kpler data, put the seven-day average for Persian Gulf crude exports excluding Iran at 18.3 million bpd on 30 September. Kpler’s own verdict: “physical flows have not collapsed.”
Rerouting: what it solves and what it does not
Exports from the Gulf of Oman and Red Sea have at times run at more than double pre-war volumes. Shuttle tankers and US Navy convoys have carried much of the remaining load. Those workarounds preserve volume.
They do not preserve cost. Tanker rates and perceived risk are elevated, and alternative routes have finite capacity. If attacks spread to the Red Sea or the Bab el-Mandeb strait, the workaround itself becomes the bottleneck.
Elevated war-risk insurance premiums, running at roughly 30 times normal rates, mean transit counts will not recover on a diplomatic declaration alone, which keeps freight costs high even when crude flows hold.
The backdrop is tense. Brent traded around $100-104 in early October and WTI near $91-92, while the US weighs strike options, with the Pentagon reportedly ordering readiness. No granular detail on strike scenarios has emerged.
The read for you: stable crude volumes do not mean low risk. Every added attack raises freight and insurance costs, and those land hardest on diesel-short Europe.
How to separate headlines from supply: a framework and the precedents
The threads come together into a test you can apply to the next energy headline this week:
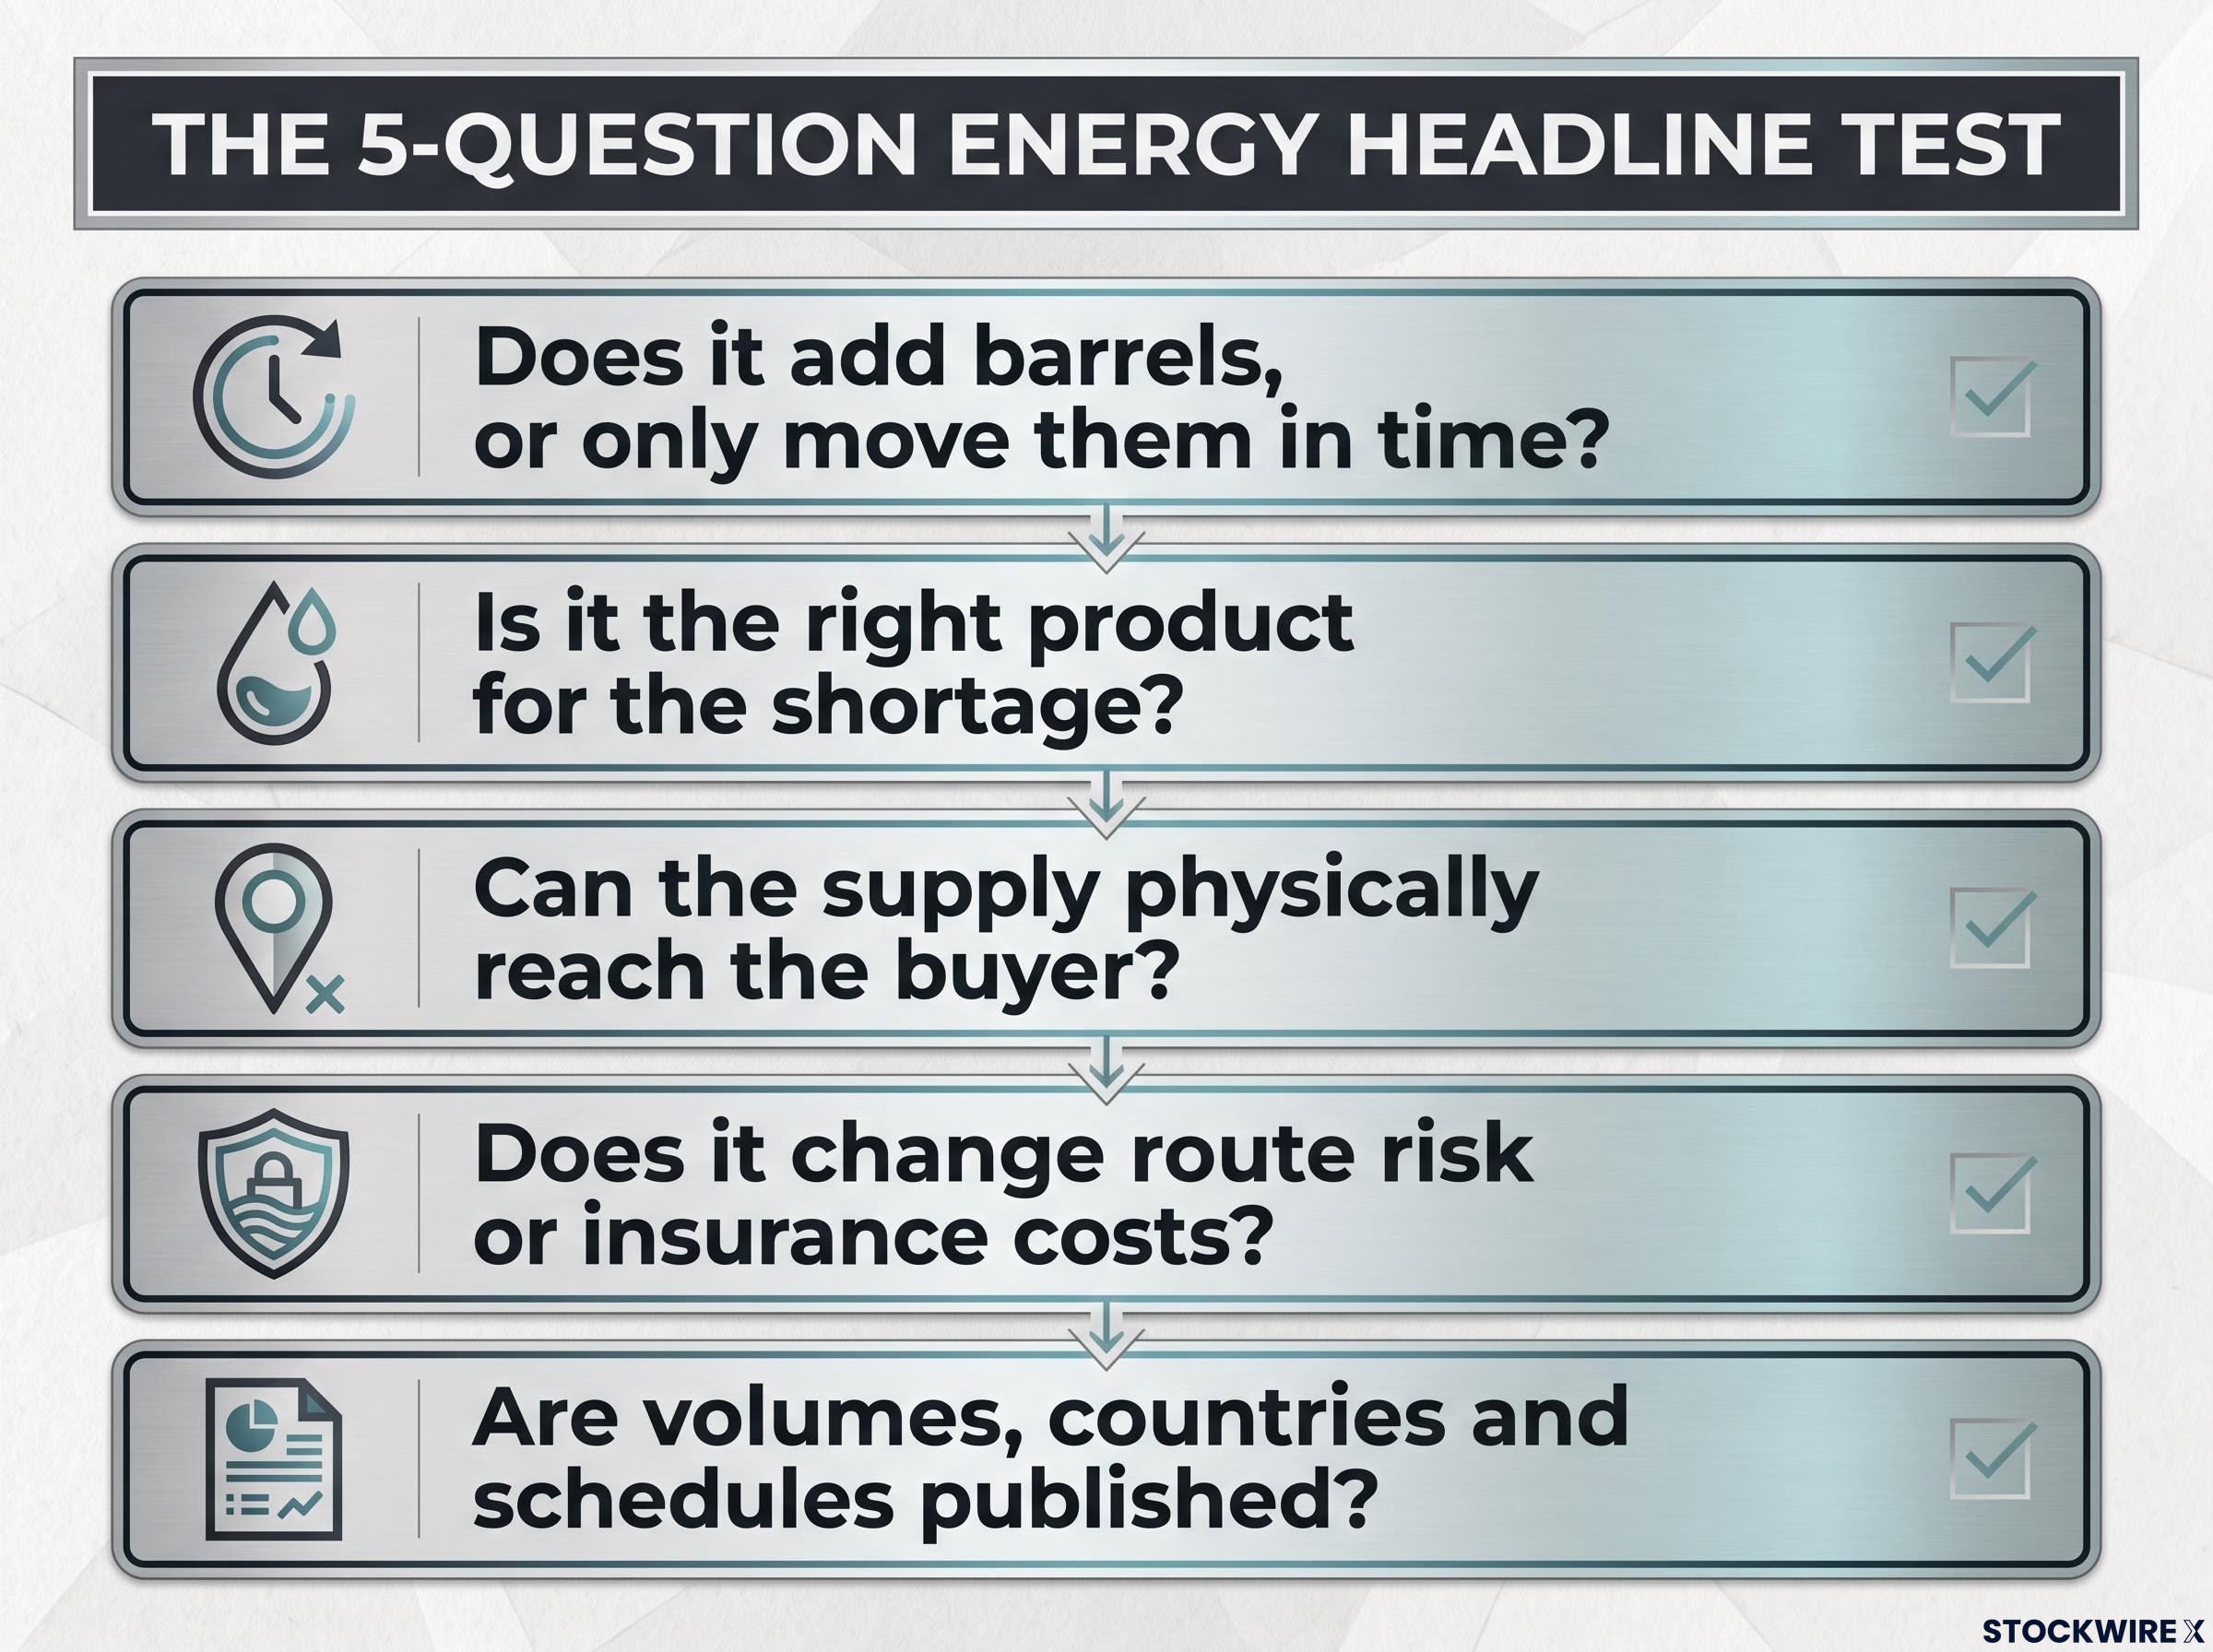
- Does it add barrels, or only move them in time?
- Is it the right product for the shortage?
- Can the supply physically reach the buyer?
- Does it change route risk or insurance costs?
- Are volumes, countries and schedules published?
Past episodes show why the test works. The 2022 coordinated release of around 183 million barrels, smaller than today’s programme, moved prices only briefly; OPEC+ decisions, refining bottlenecks and diesel tightness set the later direction. After the Abqaiq attack on 14 September 2019, prices spiked on feared capacity loss and retraced once Saudi restoration was confirmed. Earlier Hormuz scares lifted risk premia even when flows held, and calm returned only when shipping visibly became safer.
The pattern Markets respond durably to verifiable changes in barrels, routes and refining capacity, and only briefly to headlines that leave those fundamentals untouched.
Two readings compete. The structural view points to refining under-investment, concentrated export capacity and finite diesel stocks. The cyclical view highlights seasonal heating, industrial and freight demand, possible demand destruction at high prices, and front-loaded releases followed by renewed tightness.
Signposts to separate them:
- Escalation: broader strikes, more tanker attacks, pressure on Red Sea routes
- De-escalation: rising transit counts, falling freight rates, clear diesel release schedules
One caveat cuts across both: repeated emergency drawdowns may thin the buffer available for the next shock. The useful question for any headline is simple. What physically changes, and when?
Readers wanting to apply the same discipline to weekly stock reports can use our full explainer on reading oil inventory data, which shows how policy-driven SPR releases distort the apparent signal.
What the release changes, and what it leaves untouched
The IEA’s acceleration shifts timing, not quantity. Diesel remains the tight link, and the cost and risk of moving barrels through Hormuz, rather than crude scarcity, is driving prices.
Three things deserve your attention from here:
- Published country-level diesel volumes and a firm release schedule
- Transit counts and freight costs through Hormuz and the Red Sea
- US-Iran escalation or de-escalation signals
Before you react to the next stock release, sanction or chokepoint story, run it through the five-question checklist. If nothing physical changes, the price effect is unlikely to last.
This article is for informational purposes only and should not be considered financial advice. Investors should conduct their own research and consult with financial professionals before making investment decisions. Past performance does not guarantee future results. Financial projections are subject to market conditions and various risk factors. These statements are speculative and subject to change based on market developments.