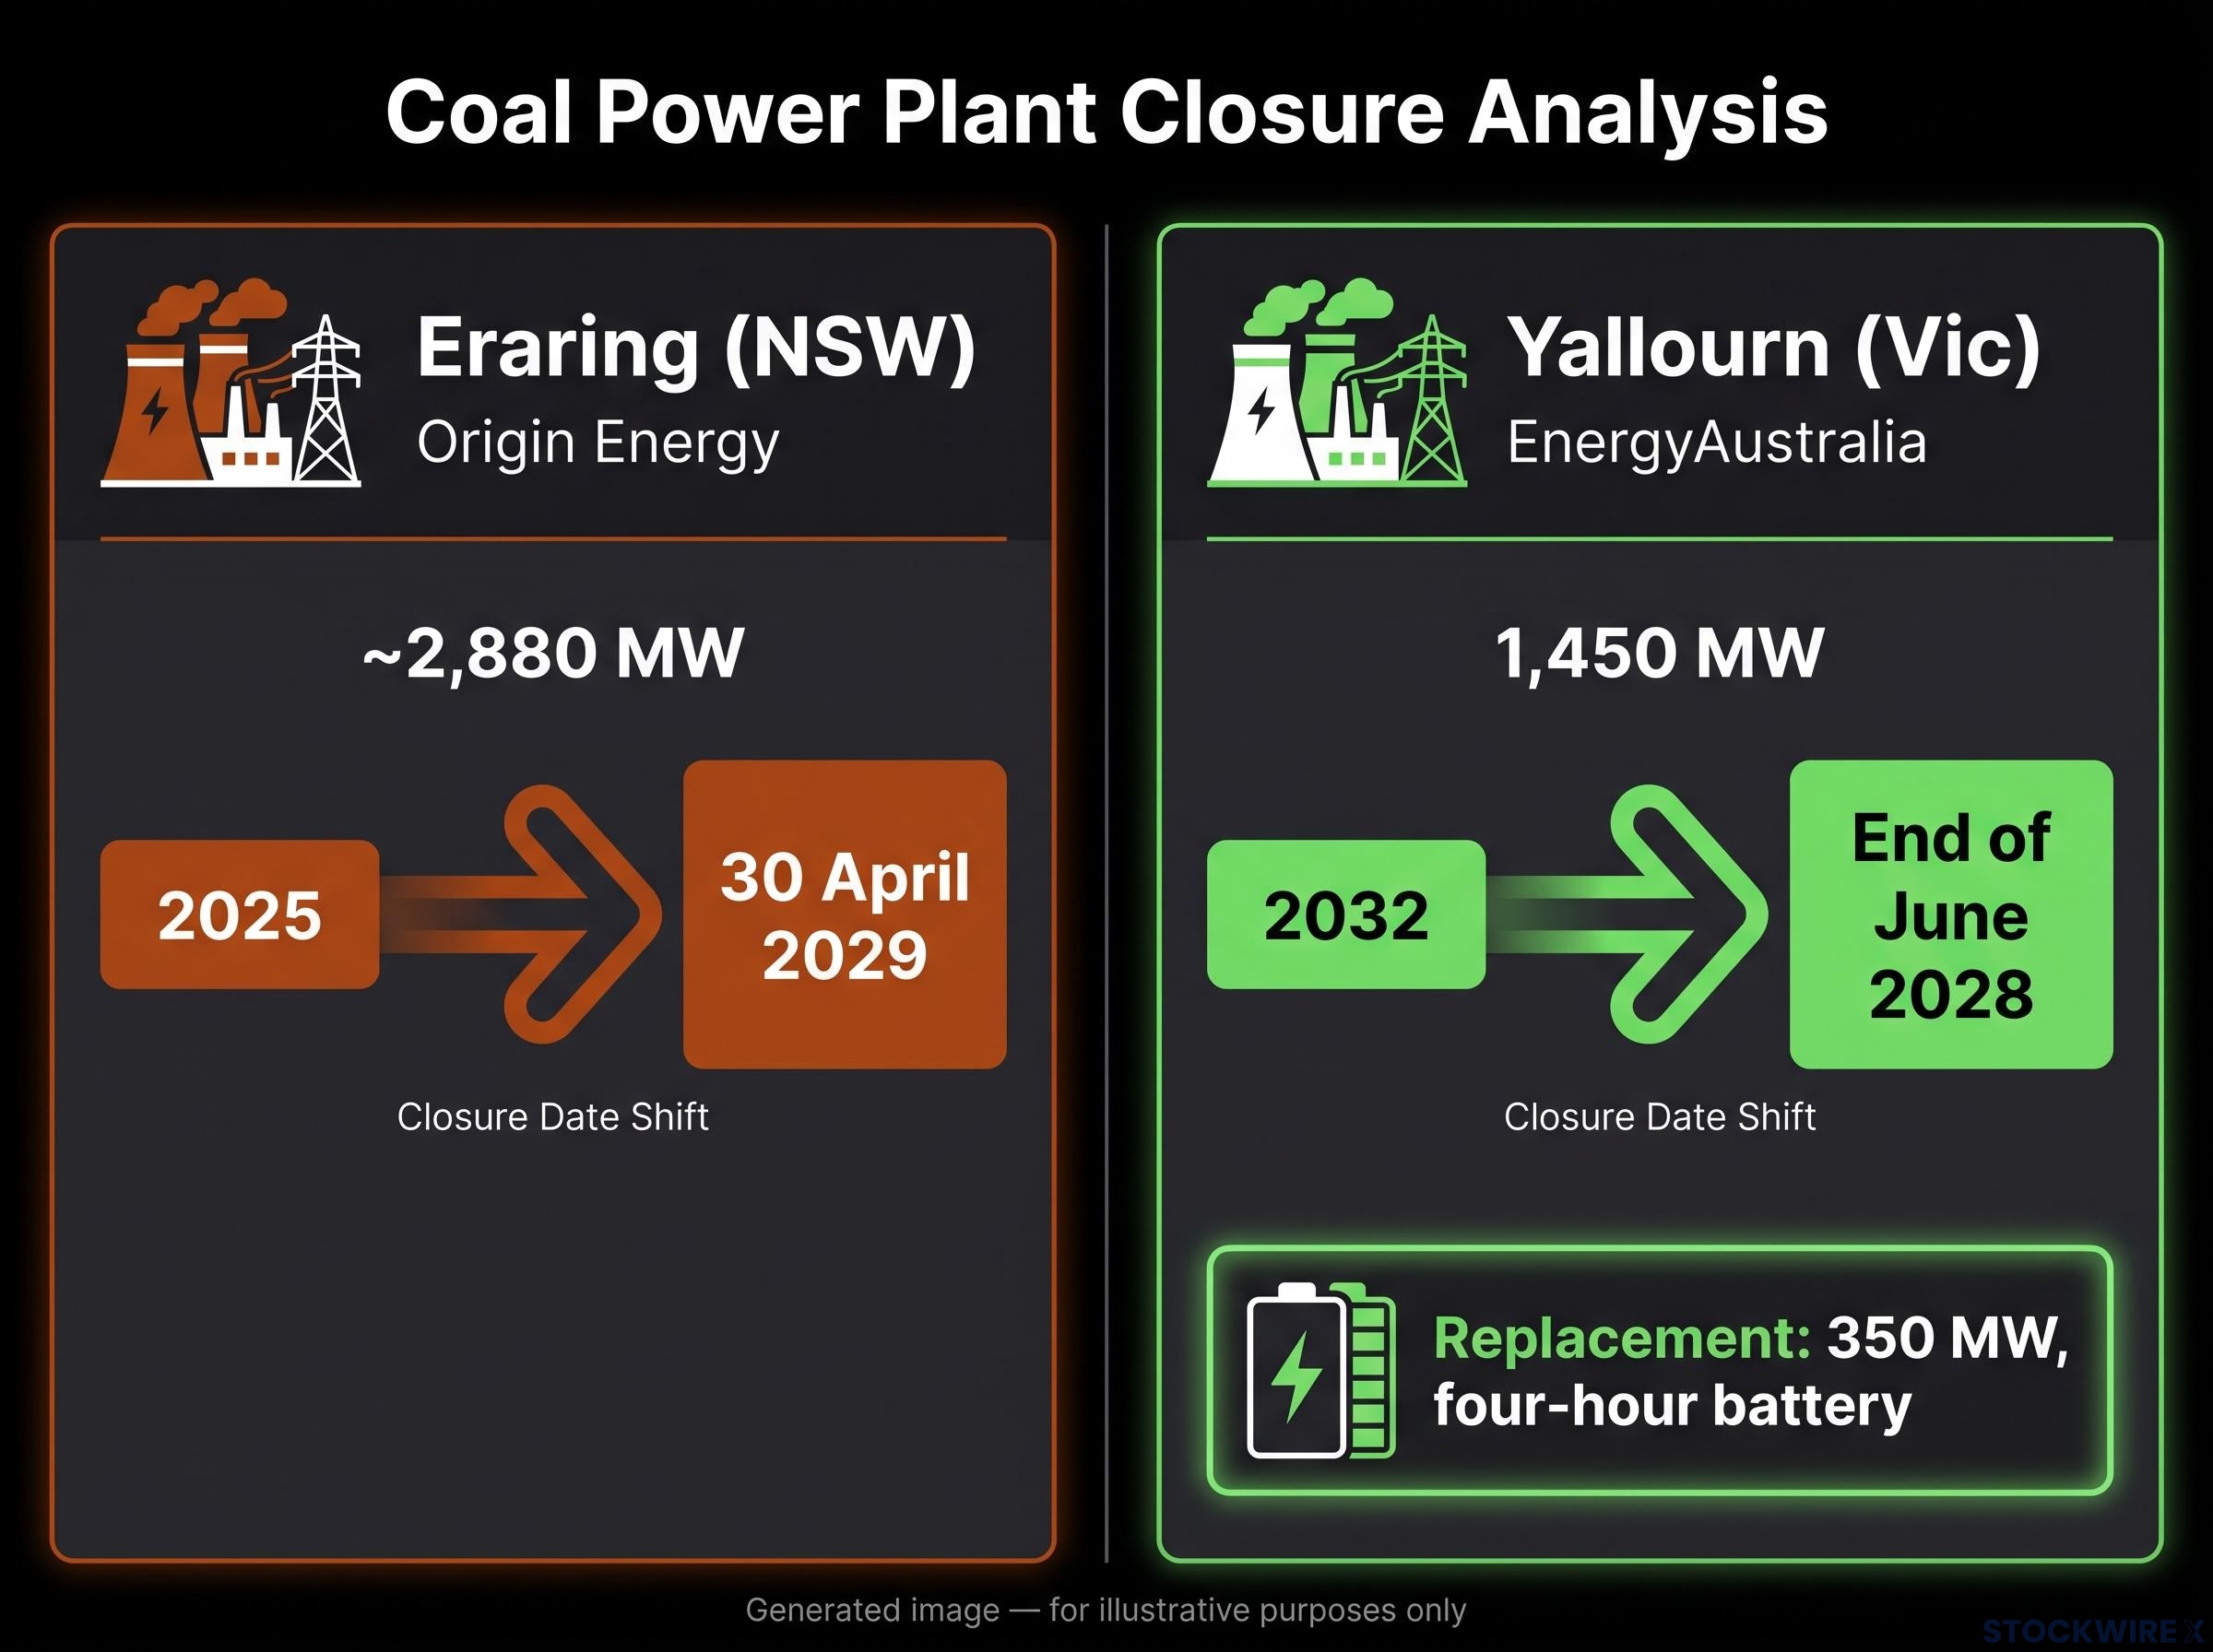
Eraring, the country’s largest coal plant, was meant to close in 2025. It is now scheduled to run until 30 April 2029. Yallourn in Victoria is still due to shut at the end of June 2028, so the two biggest coal exits of Australia’s power grid transition are moving on different clocks.
That matters because the destination looks settled. GlobalData projects renewables will make up roughly three-quarters of installed capacity by 2035, up from about half today.
The money is substantial too. More than $60 billion of power-sector investment is expected between 2026 and 2030. That spending is both an opportunity and a test, because returns depend on whether replacement generation, firming and transmission arrive before coal leaves.
Here is a framework for sorting which parts of the shift are priced for smooth delivery and which carry timetable, delivery or policy risk that could hit your holdings first.
What does GlobalData’s 2035 forecast actually say about capacity, generation and investment?
The headline number is the growth rate. According to GlobalData’s Australia power market report, cumulative installed capacity is expected to grow steadily over the next decade.
Key forecast Installed capacity is projected to grow at a 6.2% compound annual growth rate (CAGR) from 2025 to 2035. CAGR is the average yearly growth rate across the whole period.
The bigger story is what that capacity is made of. Renewables’ share of installed capacity is projected to climb from about 51% to around 77.8%, while their share of actual generation roughly doubles to about 73.3%.
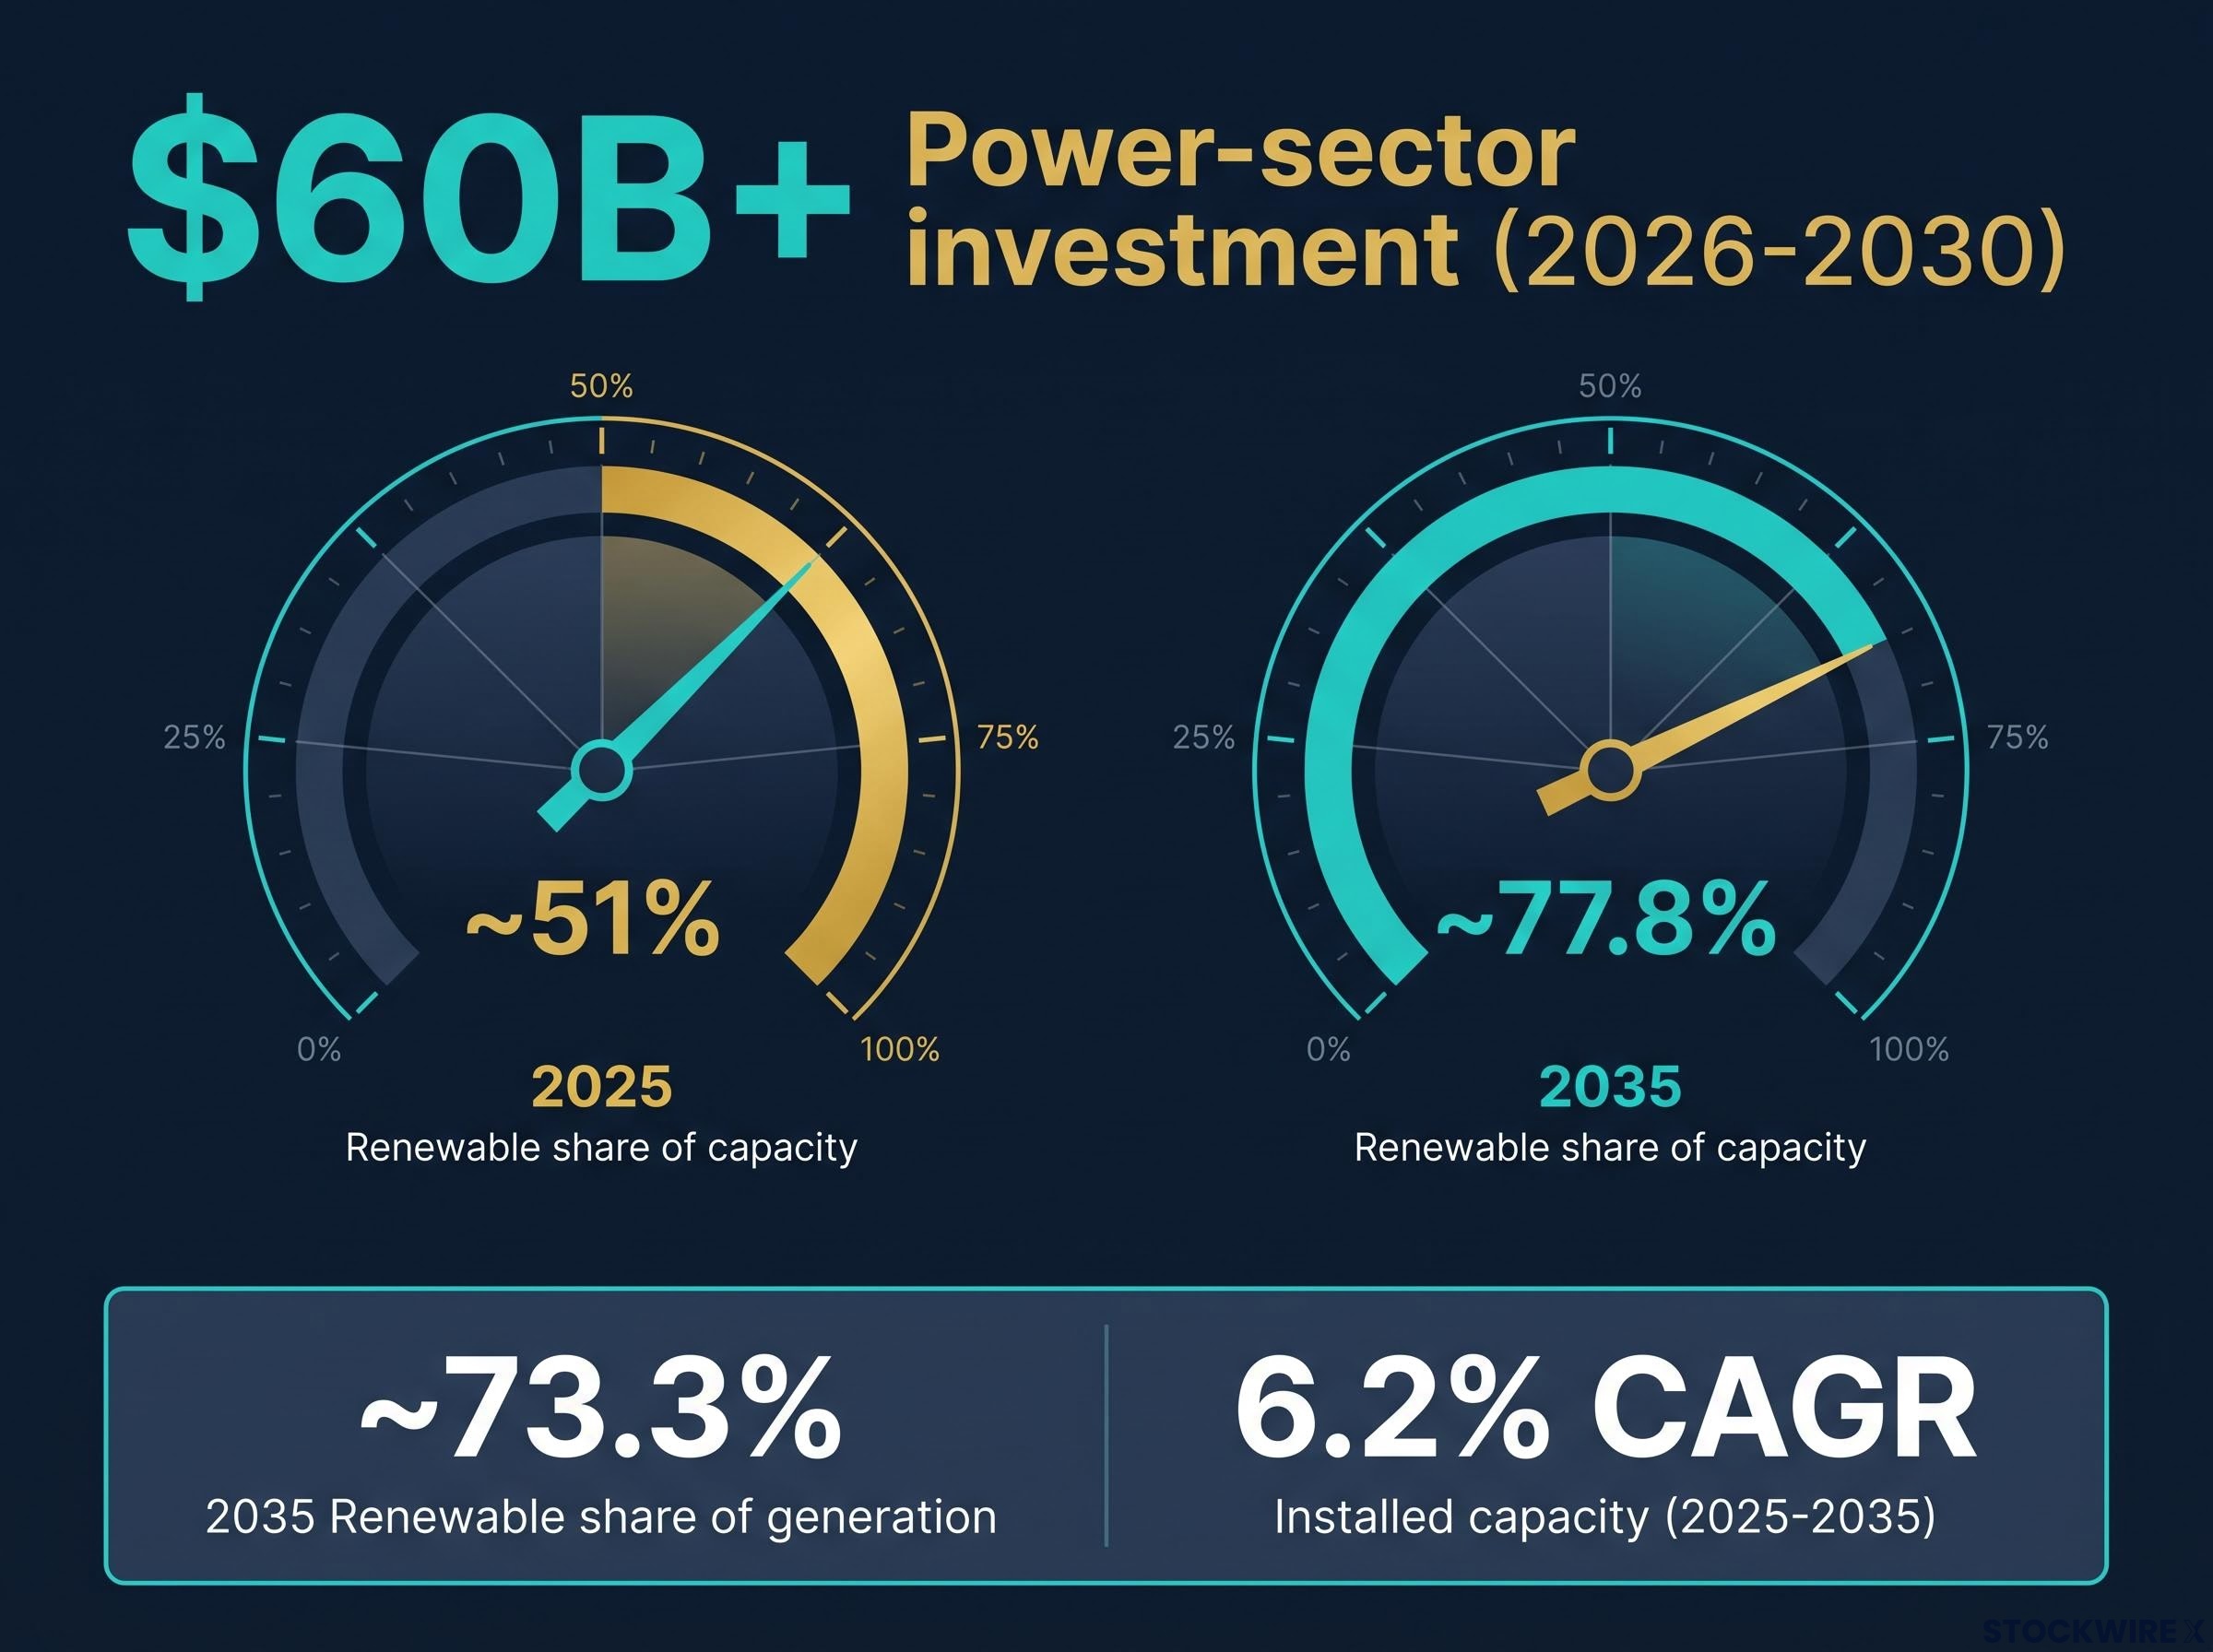
| Metric | 2025 baseline | 2035 projection | Note |
|---|---|---|---|
| Renewable share of capacity | ~51% | ~77.8% | Some GlobalData analyses cite ~79% |
| Renewable share of generation | Roughly half the 2035 level | ~73.3% | Other summaries say above 72% |
| Power-sector investment | Not applicable | $60B+ (2026-2030) | Some analyses cite ~$73B catalysed by the CIS |
The money is expected to flow into new generation, firming and the grid, with solar PV absorbing the biggest portion and onshore and offshore wind coming next. Attaurrahman Ojindaram Saibasan, Power Analyst at GlobalData, says outcomes hinge on how well policy is carried out, whether transmission gets approved, the state of financing markets and whether projects finish on time.
The same grid connection bottlenecks that delay projects on the ground also showed up in the capital flows, with Australian clean energy investment slumping roughly 20% in 2025 after a record 2024 despite sound underlying economics.
The five-point gap between capacity and generation share is the part to watch. It tells you renewables will still need firming and backup to supply power at the right moments, and that is where much of the investable value and risk sits.
When big ASX news breaks, our subscribers know first
How do coal exits, the CIS and transmission fit together?
The system logic is simple. Coal leaves, so something must replace it, and every policy and project either fills that gap or fails to.
Where the CIS reduces risk
The Capacity Investment Scheme (CIS) is the federal tool for filling it. It uses competitive revenue underwriting, meaning the government guarantees a revenue floor so financiers gain long-term certainty, and its target is 40 GW by 2030: 26 GW of generation and 14 GW of dispatchable capacity that can be switched on when needed.
Tender momentum is strong. Tender 7 awarded 7.8 GW of generation, and Tender 8 in June 2026 awarded 15 battery projects totalling 4.2 GW / 16.1 GWh, while Tenders 9 (5 GW generation) and 10 (4 GW dispatchable) were ongoing or recently closed by mid-2026. Several CIS projects have reached financial close.
Yallourn shows the intended pattern: a coal exit paired with a 350 MW, four-hour battery in the Latrobe Valley.
Where transmission still decides outcomes
Underwritten revenue means little if power cannot reach customers. Transmission links Renewable Energy Zones (REZs), regions designated for clustered wind and solar, to demand, and limits curtailment, which is when projects are forced to cut output.
- HumeLink West: tower erection over 20% complete by mid-2026, with stringing begun
- VNI West: planning targets 2029-2030
- Project EnergyConnect: planning targets 2029-2030
- Marinus Link Stage 1: 750 MW, about $3.47 billion (real 2023 dollars), due late 2030
Costs have escalated, and approvals remain a live variable. Meanwhile, record instantaneous renewable shares in the National Electricity Market (NEM) hit about 79-80.5%, against weekly averages near 44-49.6%.
That gap tells you the headline records overstate how clean the grid is on a typical day, so test asset revenue against average conditions, not peaks.
Why coal closure dates matter so much, and what Eraring and Yallourn show
A coal closure date works as a price signal. Early notice tells the market how much replacement capacity is needed and when, giving developers time to build; an abrupt exit removes supply before anything replaces it, and prices spike.
The Australian Energy Market Operator (AEMO) calls this an “orderly exit”. Eraring and Yallourn show how differently it can play out.
| Plant | Operator | Capacity | Scheduled closure | Status |
|---|---|---|---|---|
| Eraring (NSW) | Origin Energy | ~2,880 MW | On or before 30 April 2029 | Extended twice, from 2025, then 19 August 2027 |
| Yallourn (Vic) | EnergyAustralia | 1,450 MW | End of June 2028 | On schedule; 350 MW, four-hour battery replacement |
Eraring’s first extension came through a $450 million NSW risk-sharing deal to 19 August 2027. In January 2026, Origin advised AEMO it would run all four units to 30 April 2029.
Origin’s decision to run all four units is best read as a system security call, and the Eraring extension to 2029 also lets Origin earn from a fully depreciated asset while its 700 MW battery project is built on the same site.
Yallourn’s date was set in March 2021, four years earlier than the planned 2032. EnergyAustralia told ABC News on 13 August 2026 it remains on track for end-June 2028; the AFR reported July 2028, but both point to mid-2028. Victoria has contracted with the operator over possible operation beyond 2028, which is a possibility rather than a changed date.
History explains why the dates matter:
- Hazelwood, 2017: abrupt closure contributed to sharp wholesale price rises
- South Australia, 2016: the system-black event drove new system strength rules, batteries and interconnectors
- Liddell, 2023: delayed replacement created high prices where batteries and peakers earned strong margins
Views diverge. The Grattan Institute warns ad-hoc extensions undermine confidence, and the Clean Energy Council (CEC) says they can “spook” clean-energy investors. If you hold coal-exposed generators or clean-energy developers, an extension helps near-term earnings and reliability, but it tells you the closure date is a policy variable, not a fixed model input.
What is slowing delivery, and which delays will ease?
The frustrations are familiar: planning approvals, social licence (local community acceptance), supply chains and labour, financing costs and grid connection rules. The useful step is splitting delays that will fade from those that will stay.
| Delay driver | Type | Main exposure | Likely direction |
|---|---|---|---|
| Planning and environmental approvals | Structural | Transmission, wind and solar | Persistently longer lead times |
| Social licence | Structural | Transmission routes, REZs | Ongoing route changes and engagement costs |
| Grid connection technical rules | Structural | All new generation and storage | Rising complexity as renewables grow |
| Interest rates | Cyclical | Merchant and capital-heavy projects | May ease |
| Supply chain and labour | Cyclical | HVDC equipment, transformers, crews | May ease, timing uncertain |
Higher interest rates since 2022-2023 have cut the number of projects clearing hurdle rates, the minimum return investors require. Transmission budgets have escalated as high-voltage direct current (HVDC) equipment, transformers and skilled crews stay scarce, and Grattan flags cost blowouts in pumped hydro and large batteries.
The pipeline paradox sharpens the picture. Approved projects exceed requirements in aggregate, yet volumes under construction remain low, and BNEF, IEEFA and Green Energy Markets all flag permitting, cost and grid risks.
The practical read: assume structural delays are permanent in your timelines, and treat any easing in cyclical costs as upside rather than base case.
How should investors judge the transition: a framework for utilities, renewables, storage and infrastructure
Everything above reduces to three risks you can test any asset against:
- Timetable risk: coal dates can move, changing wholesale prices and capacity needs.
- Delivery risk: transmission and firming face structural headwinds that shift revenue timing.
- Policy and market design risk: the CIS, capacity mechanisms and reliability rules shape returns, and interventions can reset expectations quickly.
Optimists versus sceptics on the 82% target
The federal target of 82% renewable electricity by 2030 remains, though authorities acknowledge it is highly ambitious. AEMO’s central scenarios, the CEC and the Climate Change Authority see it as feasible if the CIS secures enough firmed capacity and transmission lands roughly on time, with gas shrinking to transitional backup.
Grattan and some market analysts doubt the schedule. They expect gas to play a larger peaking role well into the 2030s and warn of curtailment and more frequent negative prices.
Risk by sub-sector
| Sub-sector | Main upside | Main risk | Key signal to watch |
|---|---|---|---|
| Coal-heavy utilities | Extension earnings | Regulatory repricing | Closure date changes |
| Renewables developers | CIS-style offtake reduces merchant risk | Curtailment, negative prices, capped upside | Transmission milestones |
| Storage | Volatility and ancillary revenue | Revenue stack saturation, FCAS competition | New battery entrants |
| Transmission and infrastructure | Long-dated build pipeline | Cost escalation, approvals | Construction progress |
Batteries such as Hornsdale and the Victorian Big Battery have often earned above expectations, but more entrants raise competition for frequency control ancillary services (FCAS), the market that pays assets to keep grid frequency stable. Morningstar and other equity analysts say extensions support near-term earnings while raising medium-term transition risk.
Whichever sub-sector you hold, ask which of the three risks drives most of your return. That tells you which delay or policy shift would hurt you first.
For investors, the more useful frame is that the transition has become a multi-year infrastructure investment cycle, where revenue rests on energy economics and physical need rather than electoral mandates, and where vehicle choice sets the risk you actually carry.
What the forecasts settle, and the signals still worth watching
The direction to 2035 is clear: more renewables, more storage and less coal. The pace is not, because it rests on delivery, and coal dates and policy settings have already shown they can move.
Three variables will tell you whether the timetable is holding:
- Any further changes to Eraring or Yallourn closure timing
- Transmission milestones at HumeLink, VNI West and Marinus Link
- CIS tender outcomes and projects reaching financial close
Projections cited here are forward-looking and subject to change; facts reflect the position as of 7 October 2026. Past performance does not guarantee future results, and financial projections are subject to market conditions and various risk factors.
This article is for informational purposes only and should not be considered financial advice. Investors should conduct their own research and consult with financial professionals before making investment decisions.
—