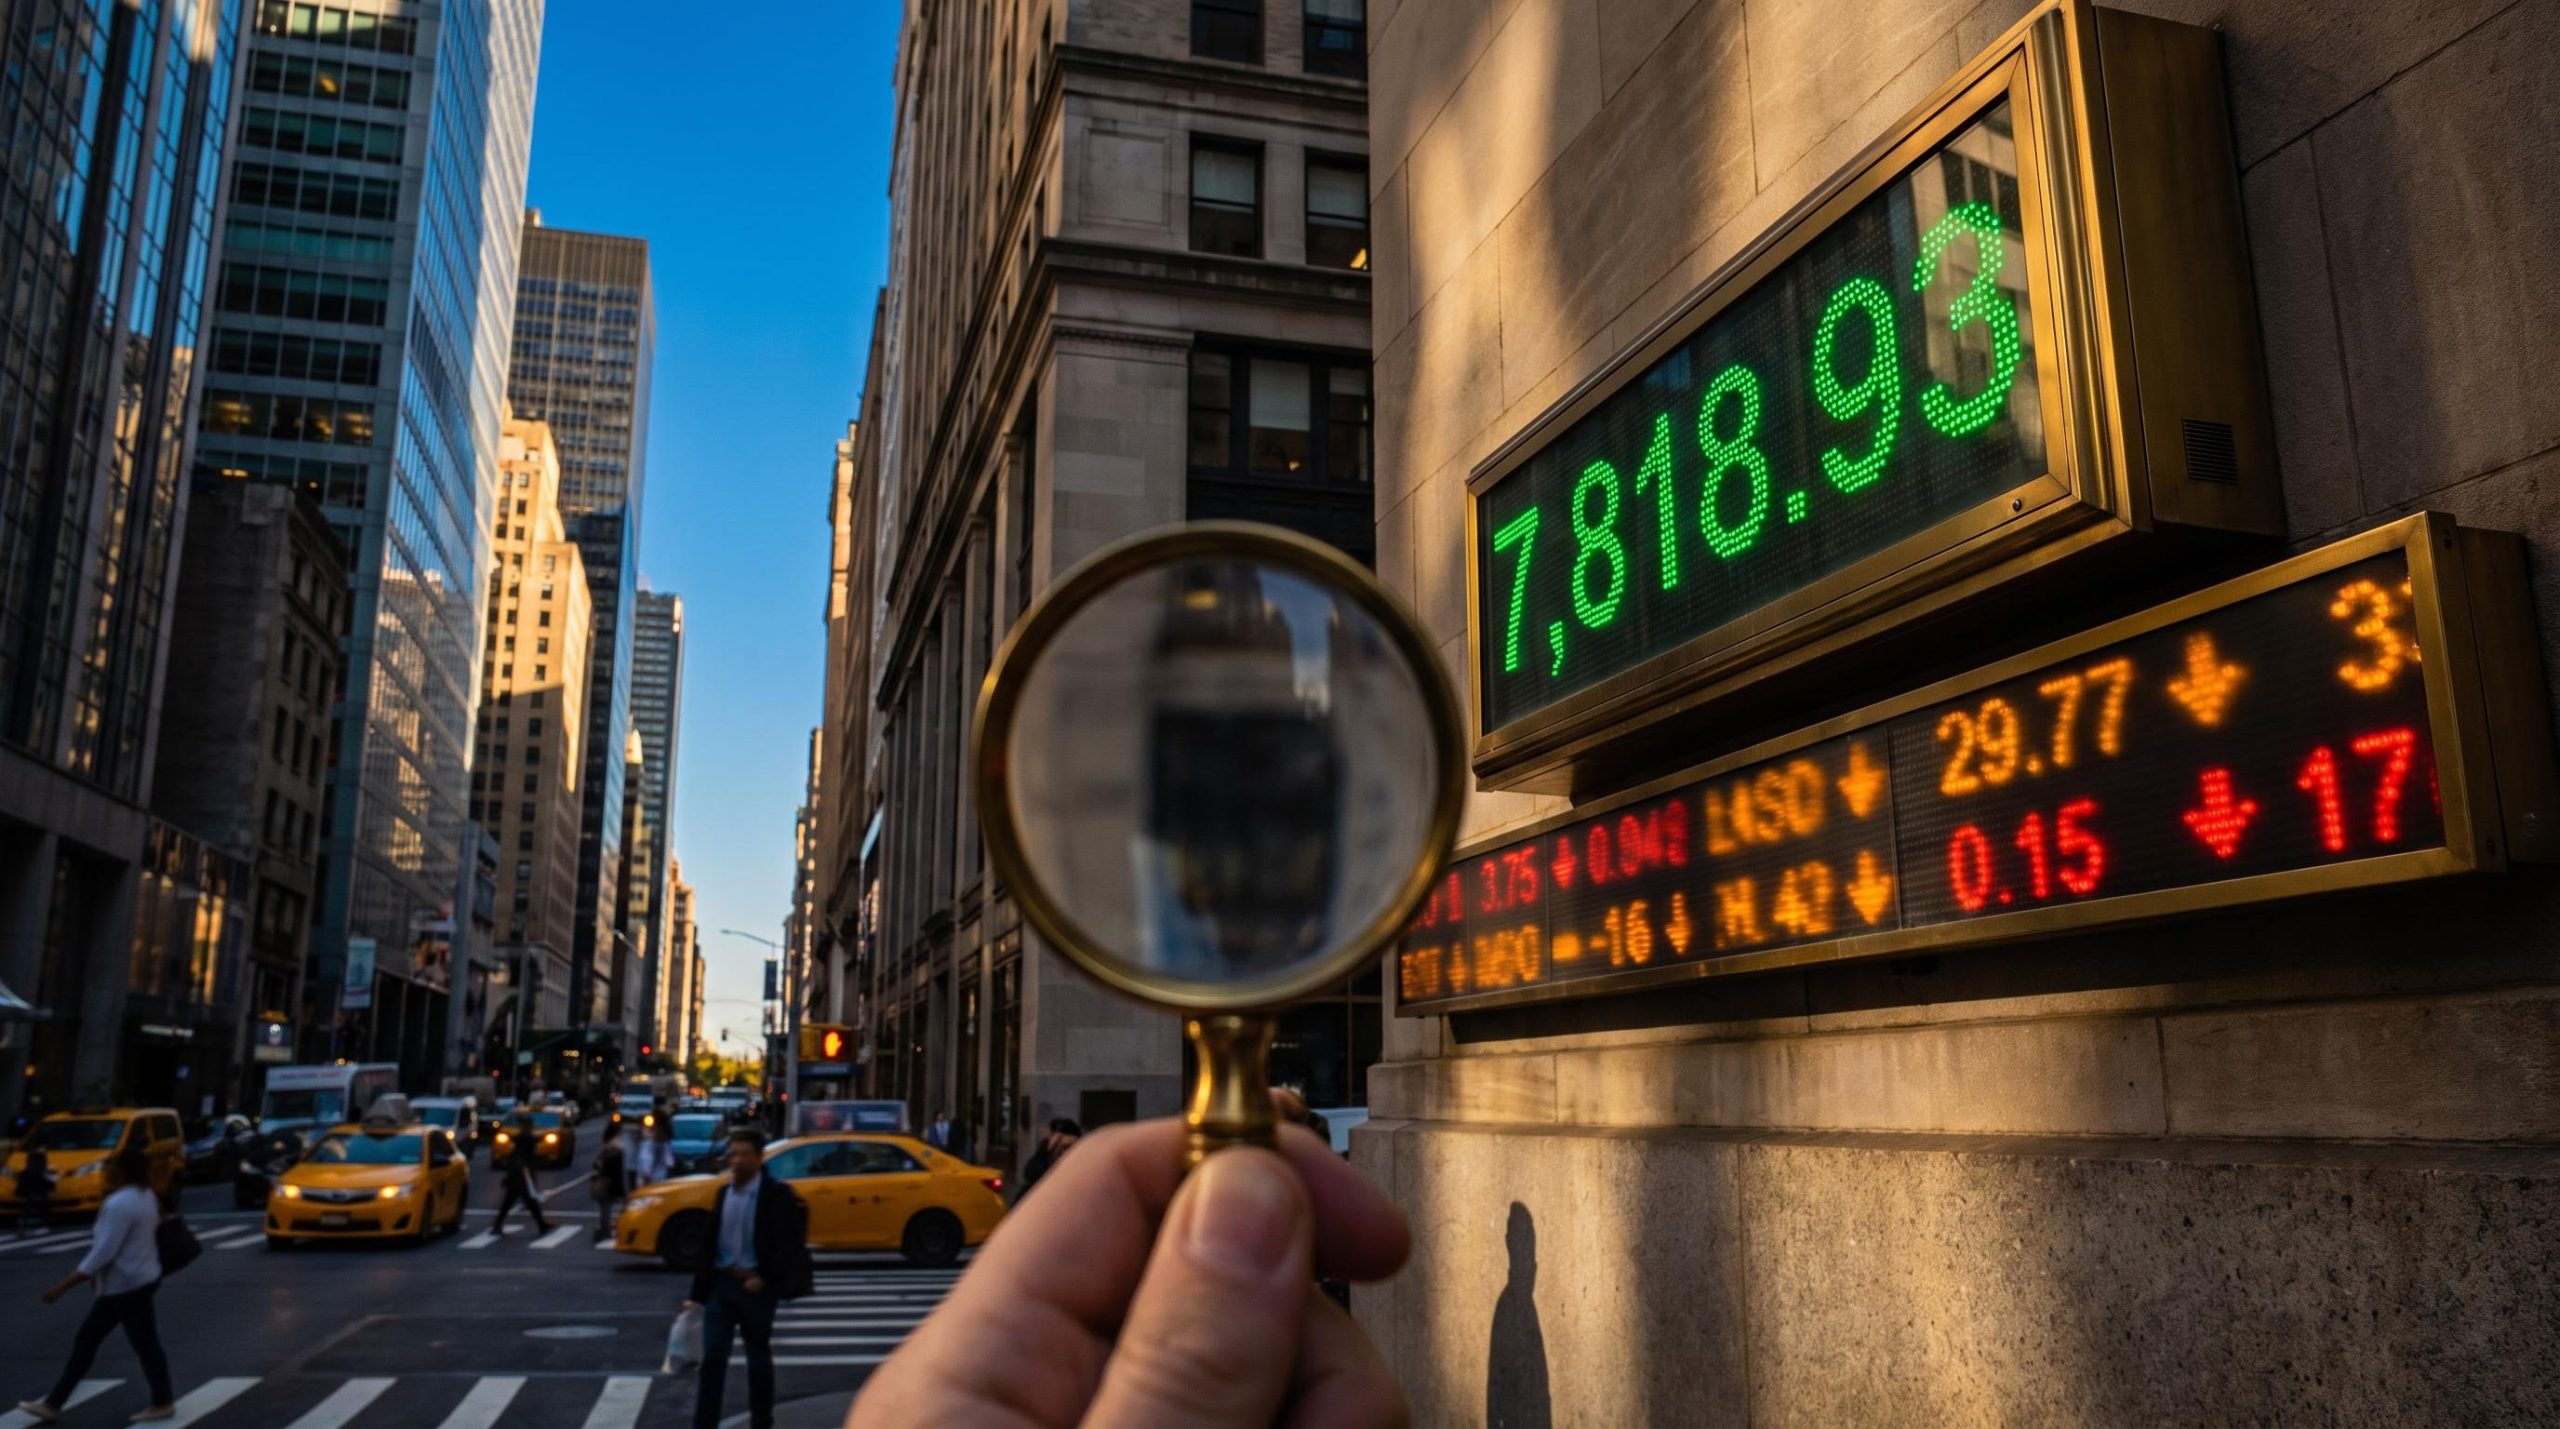
The S&P 500 closed at a record 7,818.93 on 6 October 2026, yet the average stock inside it sits roughly 5-6% below its August peak. Both facts are accurate. Together they raise a question about narrow breadth and Treasury yields that a headline number cannot answer: what does “record high” actually describe?
The bond market adds a second tension. The US 10-year Treasury yield sits near 5.27%, so a government bond now pays a meaningful income at the same moment equities are flashing their own warning signs. Those two signals pull portfolios in different directions.
Australia complicates the picture further. Its main index has barely moved this year, and its consumer stocks are pricing in a slowdown that current earnings have not yet shown.
This piece gives you three judgements to make for yourself. You will be able to tell whether the US rally is as healthy as it looks, what a 5%+ yield offers a bond holder under different scenarios, and why Australian cyclicals are going their own way.
Why are record highs and a weak average stock showing up together?
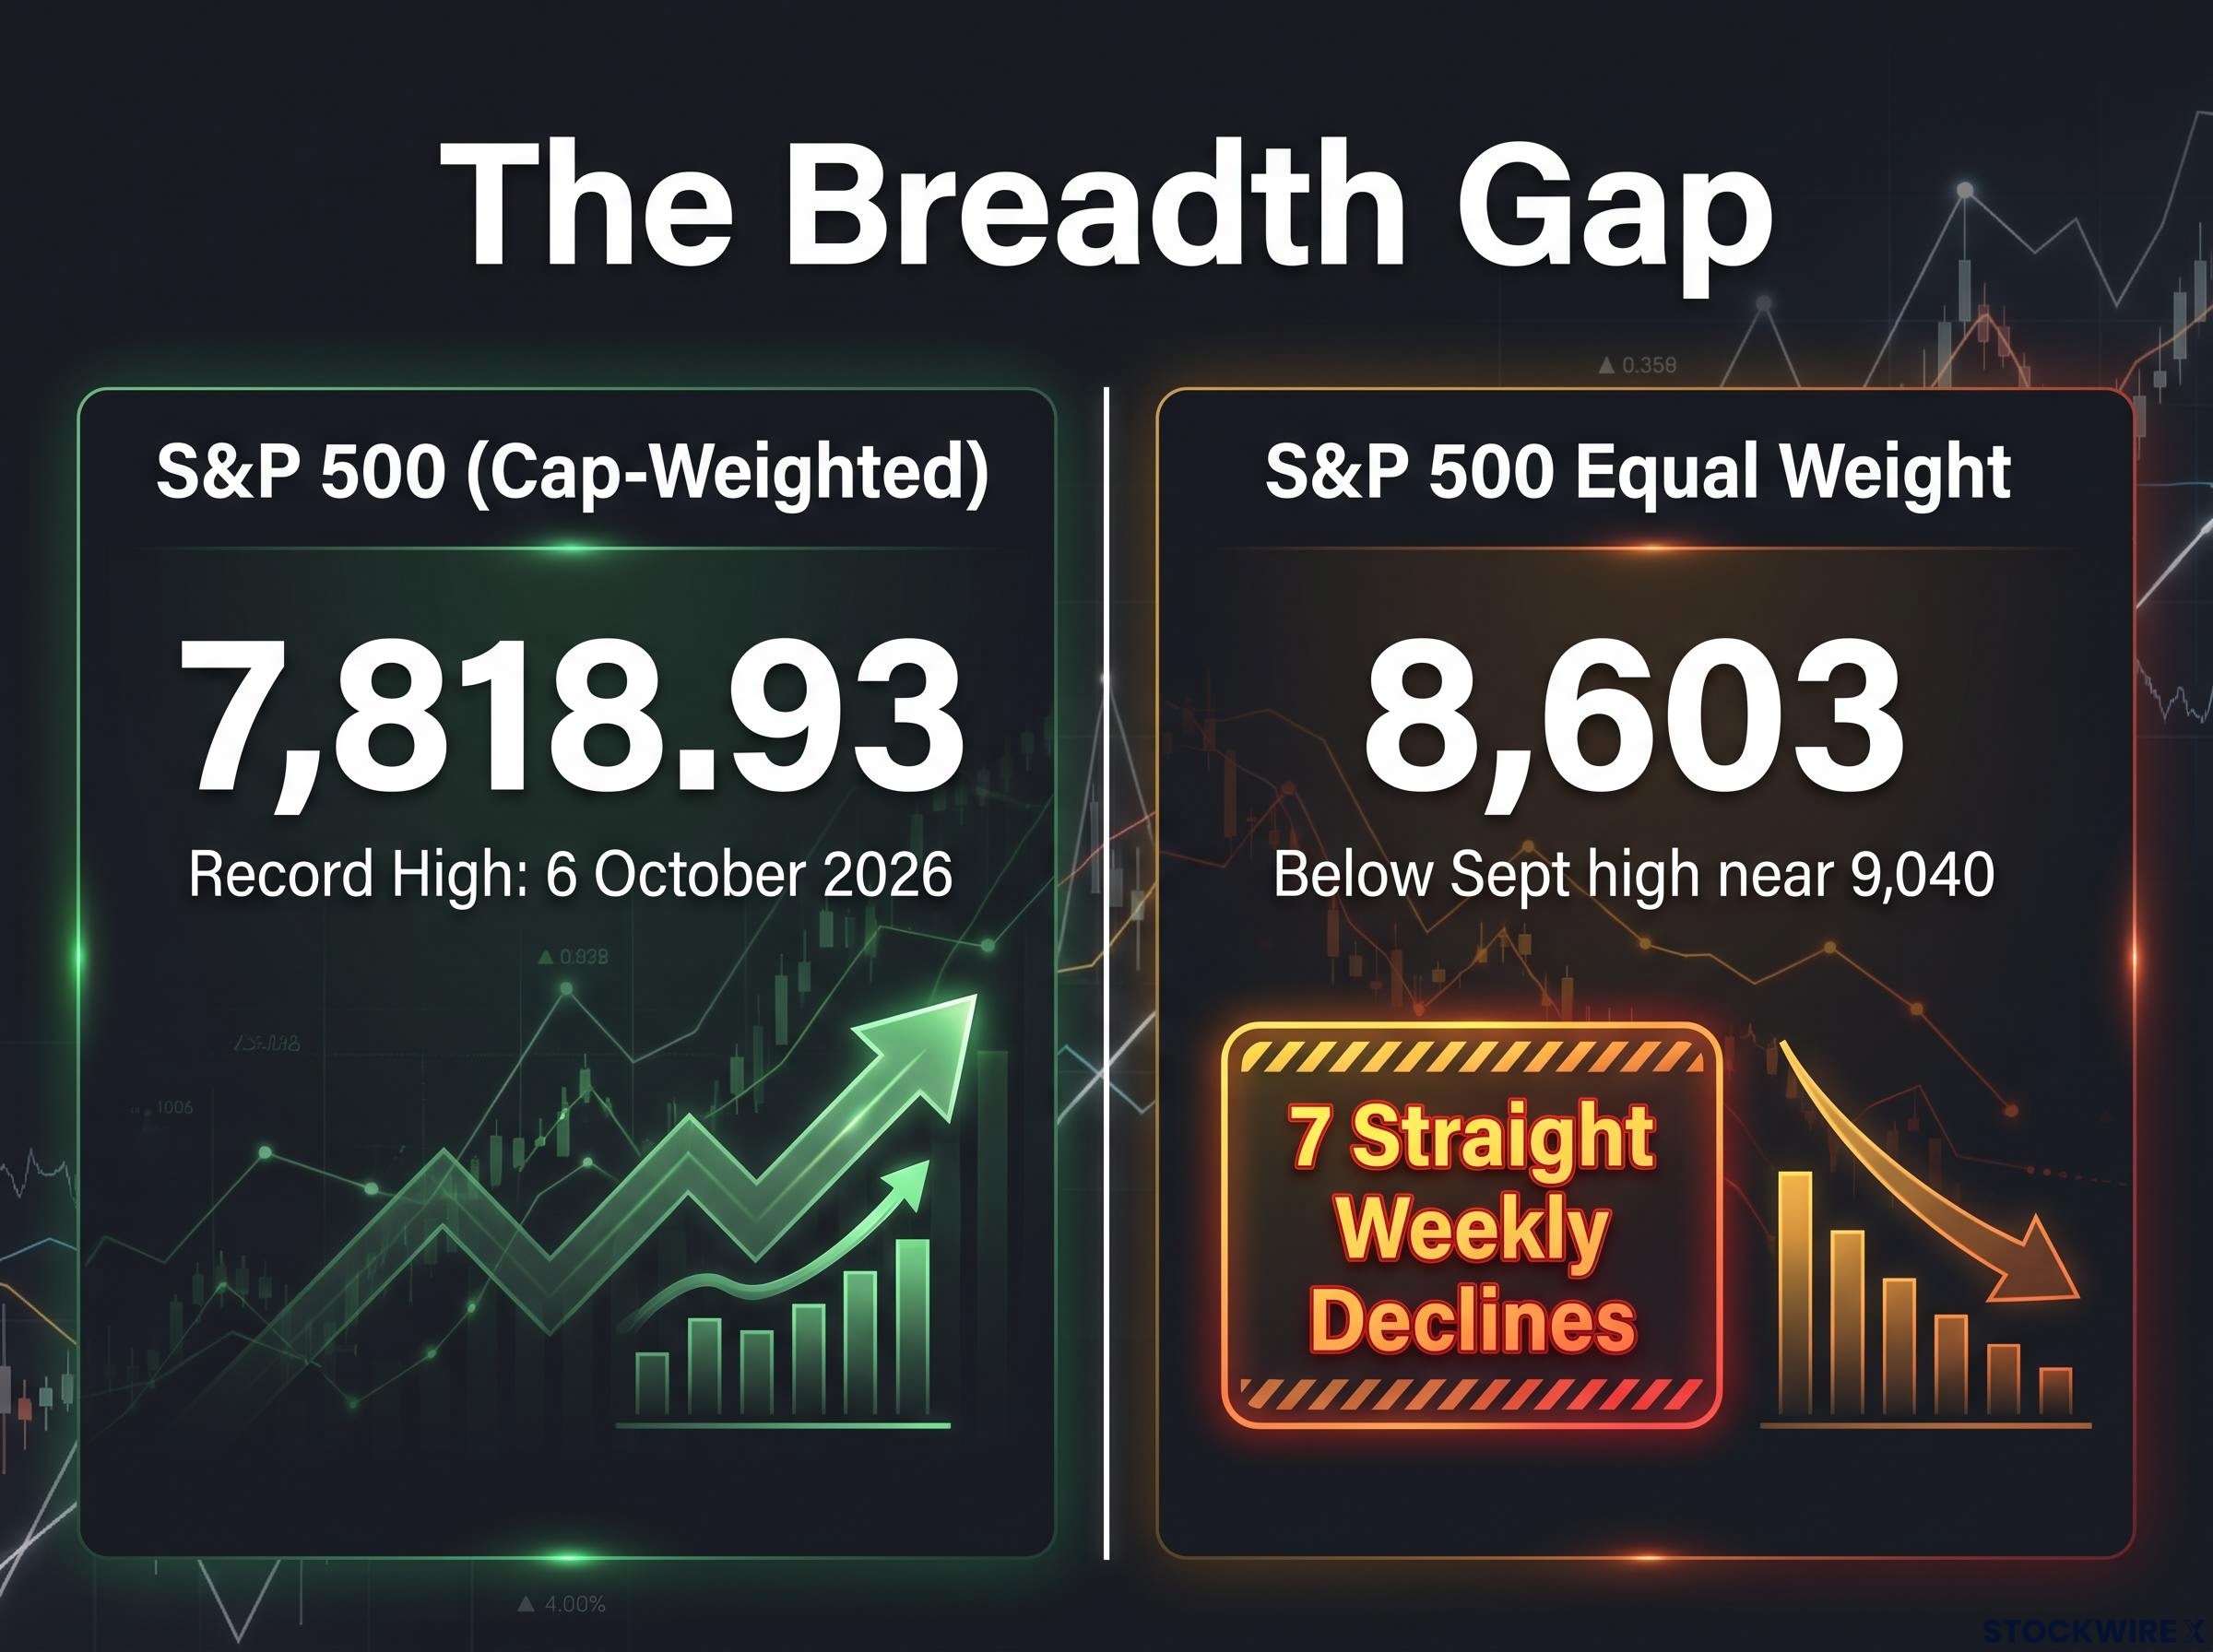
Start with the two numbers side by side. The cap-weighted S&P 500, where bigger companies count for more, closed at 7,818.93 and beat its 13 August 2026 peak of 7,798.99. The S&P 500 Equal Weight Index, which gives every company the same weight, traded around 8,603, well short of its September highs near 9,040.
Exactly how far below its peak the equal-weight index sits depends on who you ask and when.
| Source | Date | Drawdown | Benchmark reference |
|---|---|---|---|
| Original broadcast | 6 October 2026 | 4.6% | Index high |
| Yahoo Finance | 6 October 2026 | More than 4% | Mid-August record |
| MarketWatch/Morningstar | 2 October 2026 | About 6% | Equal-weight ETF record set the prior month |
| Charles Schwab | 5 October 2026 | About 5.8% | 14 August levels |
The figures differ, but they land in the same 4-6% band. The more telling detail is the streak: the equal-weight index has now posted seven straight weekly declines, according to Schwab. Only July 2002 and May 2022 produced comparable runs.
Dow Jones Market Data, cited by MarketWatch, found the gap between cap-weighted and equal-weight S&P 500 ETFs among the widest since the early 2000s.
The breadth gap MarketWatch described the current environment as “anything but normal”.
Saxo Bank flagged a single session in late September that shows the mechanics. The equal-weight fund gained 0.47% while the cap-weighted fund managed just 0.18%, even though four of the seven largest constituents fell. A handful of giants were enough to set the headline’s direction on their own.
A handful of giants can set the headline’s direction because supply and demand mechanics operate at the level of each stock, so heavy buying in a few large names lifts a cap-weighted index even while most other holdings drift lower.
On the day of the record, the S&P 500 rose 0.6% and the Nasdaq 0.4%, with Amazon up 2% and utilities up 2.7%. The precise share of the index held by its top five to ten names was not available in the research.
What this tells you is simple. The record describes how the largest few companies are doing, not how your typical holding is doing, so check what your portfolio actually owns before taking comfort from the headline.
When big ASX news breaks, our subscribers know first
What does narrow breadth actually signal, and is it a warning?
Breadth measures how many stocks are taking part in a market move. Strong breadth means most stocks are rising together. Narrow breadth means a few are carrying the rest, much like a group project where two people do all the work while the grade looks fine.
History shows the pattern has appeared before, with mixed endings.
| Episode | Breadth condition | Outcome | Equal-weight loss |
|---|---|---|---|
| 1999-2000 | Narrow tech and internet leadership | Multi-year bear market | Not specified in research |
| 2002 | Seven-week equal-weight losing streak | Followed the dot-com bust | Double-digit |
| 2022 | Seven-week equal-weight losing streak | Occurred during a bear market | Double-digit |
| 2023 | Gains concentrated in big tech and AI names | No immediate crash, greater vulnerability | Lagged, no crash |
| 2026 | Seven-week streak, wide breadth gap | Unresolved | About 4-6% |
What the bearish case says
Schwab, Yahoo Finance and MarketWatch all point to the same uncomfortable fact: the two earlier seven-week streaks coincided with bear markets. Weak breadth that persists has often arrived alongside, or ahead of, broader stress. On that reading, the current streak is a warning light worth respecting.
What the milder case says
The size of the damage differs sharply. The current drawdown of roughly 5.8% is a fraction of the double-digit losses in 2002 and 2022. Saxo’s evidence also shows that money can rotate between stocks without a downturn, and 2023 proved concentration can persist without an immediate crash.
No named strategists at major firms such as Goldman Sachs or Vanguard were found weighing in on which reading is right. That leaves you to weigh the evidence directly.
The balanced read: narrow breadth raises the odds of fragility without predicting a crash. Treat it as a reason to review your concentration risk, not as a sell signal.
Bank of America has framed concentration risk in similar terms, recommending selective stock-level exposure over broad index buying when a record index masks a majority of constituents lagging the benchmark.
Why have yields eased, and can a 5.27% long bond make sense?
If concentration makes equities feel fragile, the bond market offers an alternative. The surprise is that yields eased on the day yet remain high by recent standards. The 10-year sat near 5.27% (reported at 5.27-5.29% across sources), within an early-October range of 5.17-5.32%, and up about 27% year on year.
The real yield, meaning the return after expected inflation, was about 2.9% on the 10-year Treasury Inflation-Protected Securities (TIPS). The broadcast linked the easing partly to a decent Japanese government bond auction and to Marine Le Pen’s comments on fiscal consolidation. No independent source confirmed that link.
A long-term yield is built from three parts:
- Expected short-term rates over the life of the bond
- Expected inflation over the same period
- A term premium, the extra return investors demand for locking money away longer
Fiscal supply pushes on the third part. Larger deficits mean more Treasury issuance, and global spillovers from Japan and Europe add pressure.
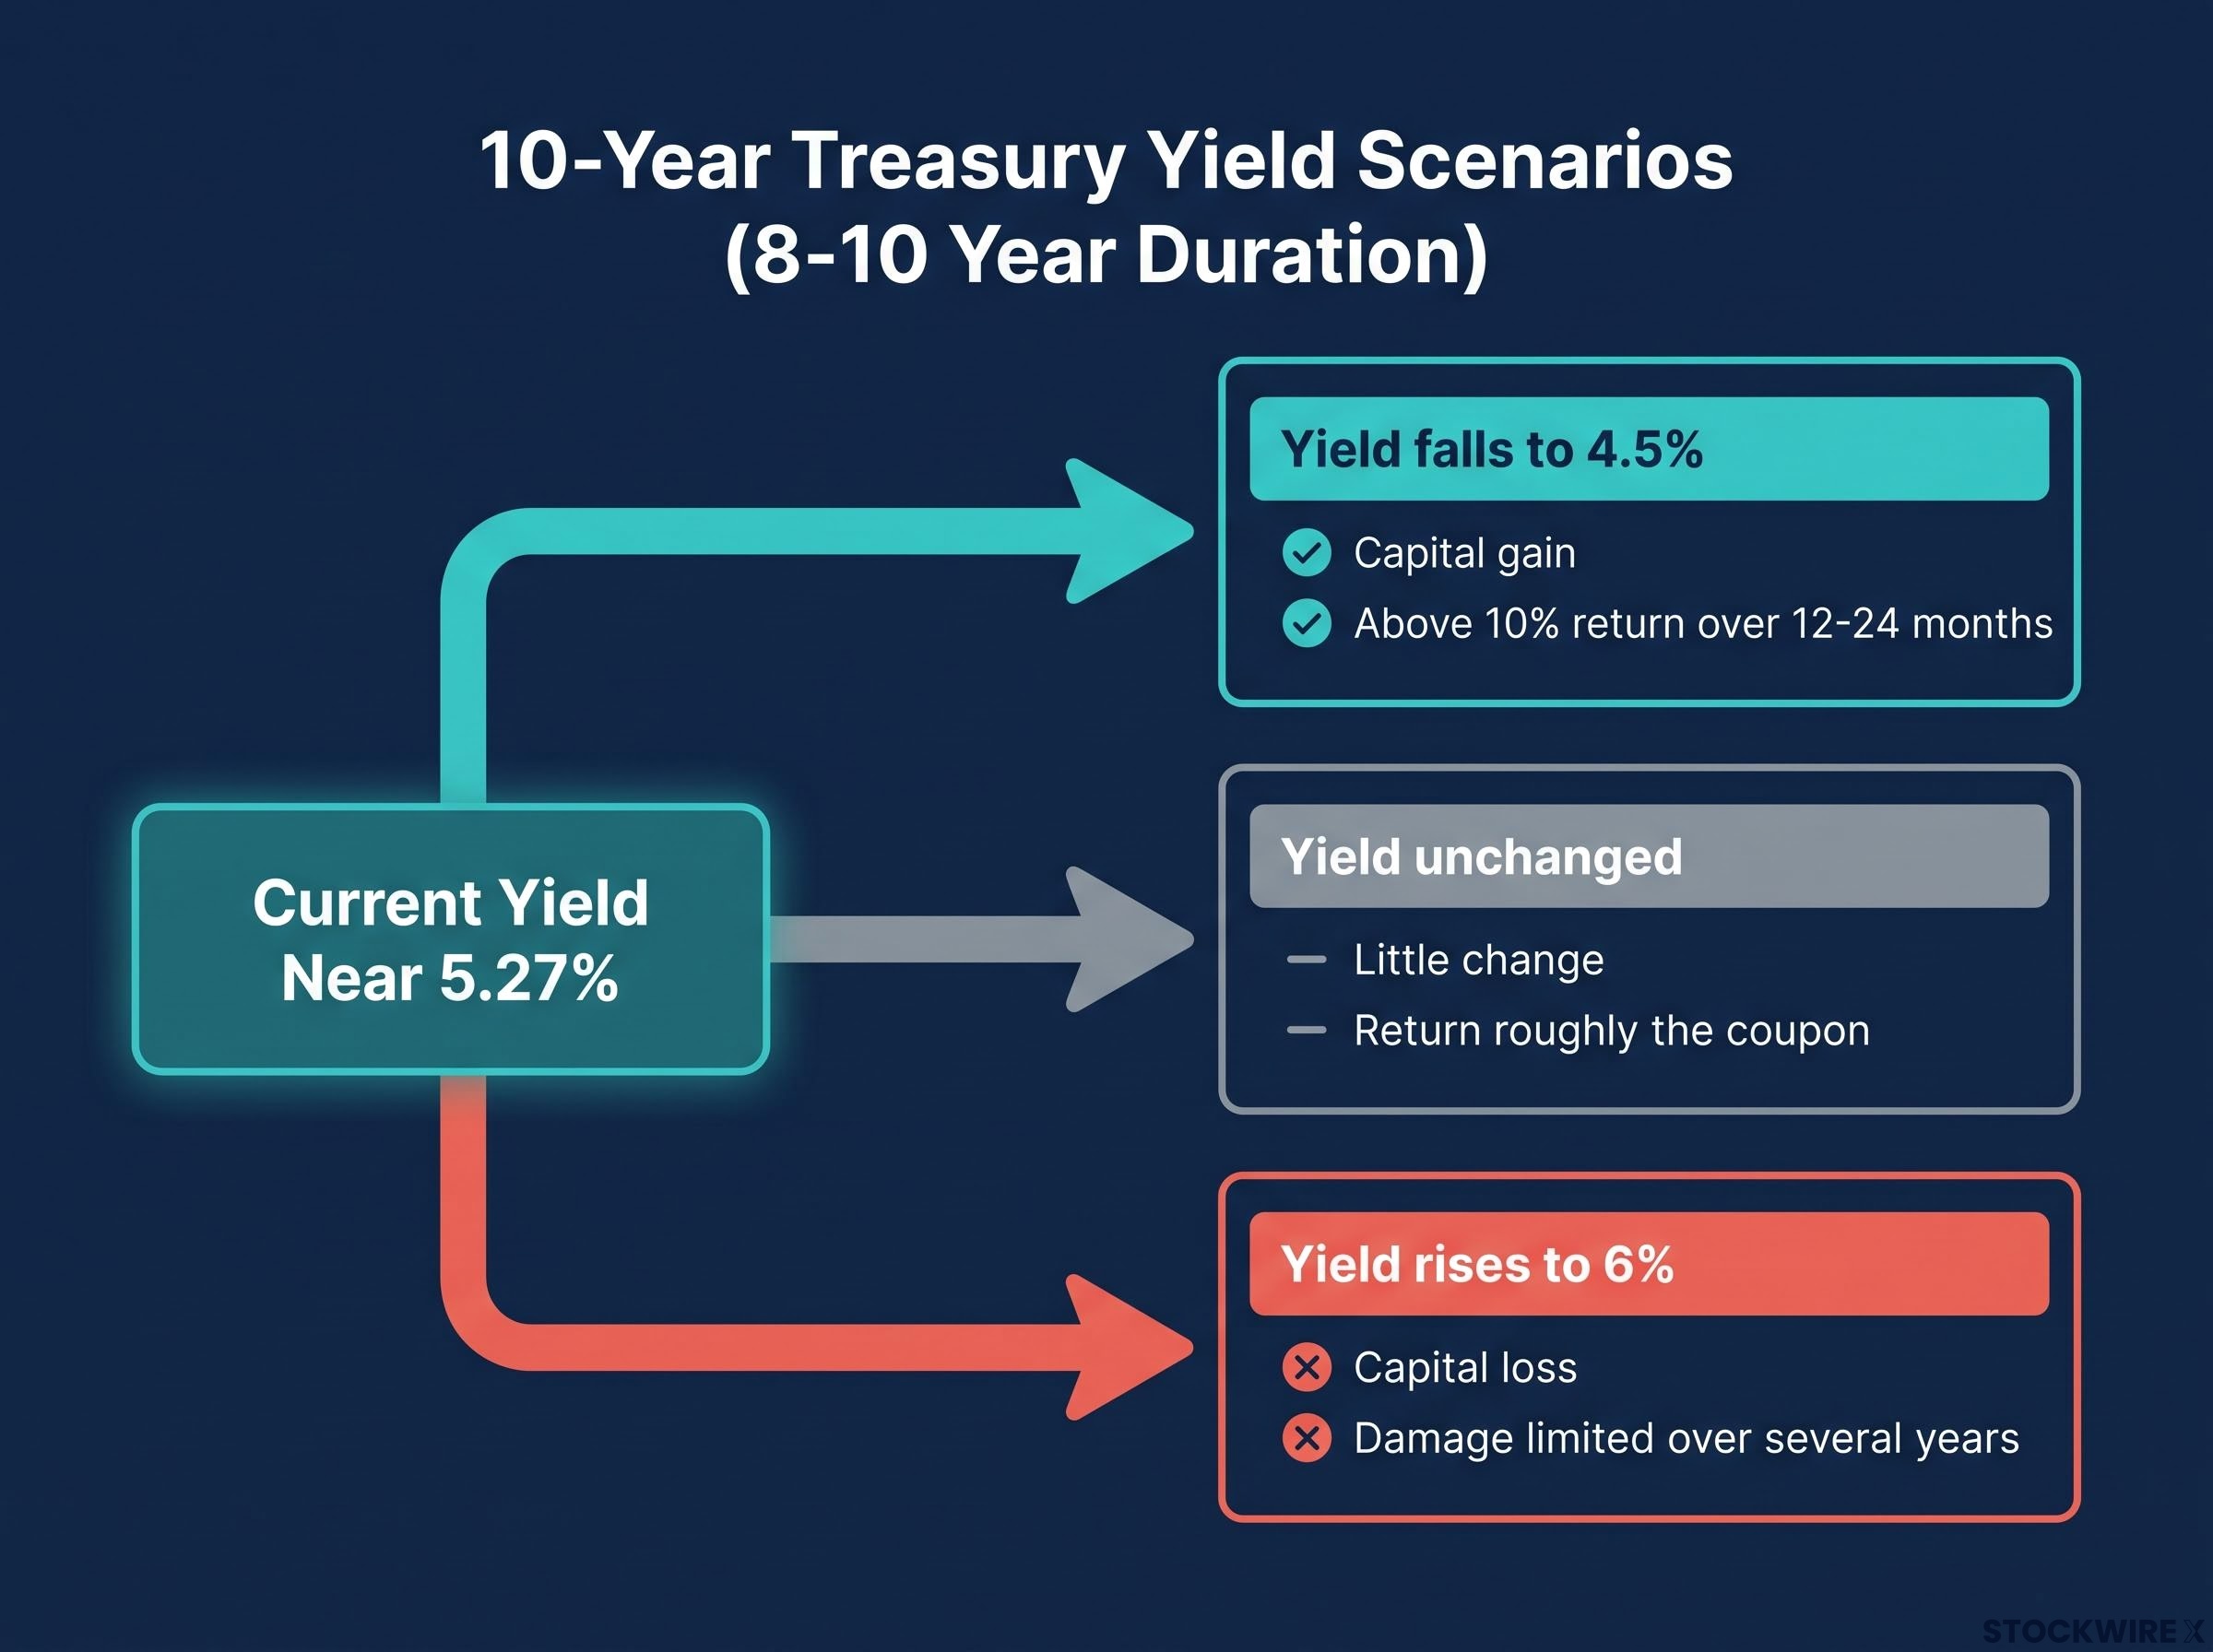
Some bond investors see value at these levels. The illustrative maths below uses standard bond calculations for durations of about 8-10 years, not a named strategist’s forecast. Duration measures how sensitive a bond’s price is to a change in yields.
| Scenario | Price effect | Coupon effect | Indicative total return |
|---|---|---|---|
| Yield falls to 4.5% | Capital gain | Income near 5.27% a year | Above 10% over 12-24 months |
| Yield unchanged | Little change | Income near 5.27% a year | Roughly the coupon |
| Yield rises to 6% | Capital loss | Coupon cushions losses over time | Damage limited over several years |
The risks are clear: persistent inflation, larger deficits and heavier Treasury supply could all push yields higher. Past performance does not guarantee future results, and these projections depend on market conditions.
The downside case matters most for longer maturities: a duration-17 fund loses roughly $85,000 on a $500,000 position for each 1 percentage-point rise in yields, against about $30,000 for a duration-6 fund.
What a 5%+ yield gives you is payment to wait. The payoff still depends on duration and on where yields go, so match the maturity to how long you can genuinely hold. This is general information, not personal advice.
Why is Australia not following the US, and what are consumer cyclicals pricing in?
Why the ASX lacks the US engine
Australian investors cannot simply copy the US trade, because their market is built differently. The ASX 200 leans heavily on banks and resources and has no mega-cap AI leaders to carry it. It closed at 8,735.7 on 6 October, up 0.57%, and is roughly flat for the year at +0.09%.
The ASX 200 lacks mega-cap AI leaders because of index composition gaps that also help explain a persistent return shortfall versus global peers, a structural rather than cyclical difference.
Sentiment versus spending
Consumer confidence readings vary by month, but all sit deep in pessimistic territory against a neutral level of 100:
- Broadcast: fell 4.7% to about 80
- June 2026: 80.6 (Westpac-Melbourne Institute), among the weakest in nearly 50 years
- September 2026: fell 5.2% to 84.4, nearly 12% below a year earlier
Prices reflect that gloom. The consumer discretionary index is down about 12-14% year to date depending on the source, and has returned roughly 1% a year over five years against about 4% for the ASX 200.
JB Hi-Fi shows the disconnect most clearly.
Record results, falling shares JB Hi-Fi posted record FY26 sales of about $11.1 billion (up 4.8%) and net profit of $489.9 million (up 6%). Its shares traded near $70.58 on 6 October, still down more than 30% year on year after a 42.8% fall to a 52-week low on 9 September.
Analysts call this “sentiment compression”: investors price in a spending slowdown before it reaches earnings. The broadcast also noted that major bank transaction data remain relatively positive.
The read for you: if bad news is already in the price, a weak confidence survey alone is a poor reason to sell. Watch actual spending and earnings instead.
What narrow breadth and high yields change, and what they do not
The three threads point to one conclusion. A record US index built on a few giants is more fragile than its headline suggests, though fragility is not a forecast. Yields above 5% offer a genuine alternative with scenarios you can map in advance. Australia shows that local market structure, not global headlines, drives local returns.
Three variables will tell you which way this resolves:
- Whether the equal-weight S&P 500 stabilises or extends its losing streak
- Whether the 10-year yield holds near or above 5%
- Whether Australian spending data confirms or contradicts the gloomy sentiment readings
Your decision comes down to concentration, duration and evidence. Know how much of your portfolio rides on a few names, how long you can hold any bond you buy, and whether spending, not surveys, backs your view.
This article is for informational purposes only and should not be considered financial advice. Investors should conduct their own research and consult with financial professionals before making investment decisions. These statements are speculative and subject to change based on market developments and company performance.