A 10-year Treasury yield near 5.3% and a 30-year near 5.7% look like a rerun of the dotcom peak. Treasury yields have not climbed this high since 2002, so it is easy to see why the 1999 comparison keeps coming up. What many investors miss is that the same yield level can come from very different forces.
The parallels are easy to spot. There is heavy spending on technology infrastructure, credit spreads remain narrow, and long yields jumped after the Federal Reserve raised rates on 16 September 2026.
Getting the cause wrong carries a real cost. If you position for a bubble peak when the market is pricing a supply and inflation problem, your bond allocation could be exposed to the wrong risk entirely.
Here is a way to test any bond market analogy on its drivers rather than its headline level, along with the three positioning calls UBS is making based on that test.
Why does 1999 look like a match on the surface?
The case for the comparison is stronger than a simple coincidence of numbers. Ulrike Hoffmann-Burchardi, Chief Investment Officer of UBS Wealth Management Americas, has set out three ways the two periods rhyme:
- An investment boom: heavy telecom spending in the late 1990s, compared with heavy spending on AI data centres and supply chains now
- Rising capital costs: a worldwide increase in the cost of capital in both eras
- Narrow credit spreads: in both periods, investors asked for little extra yield to lend to companies rather than the government
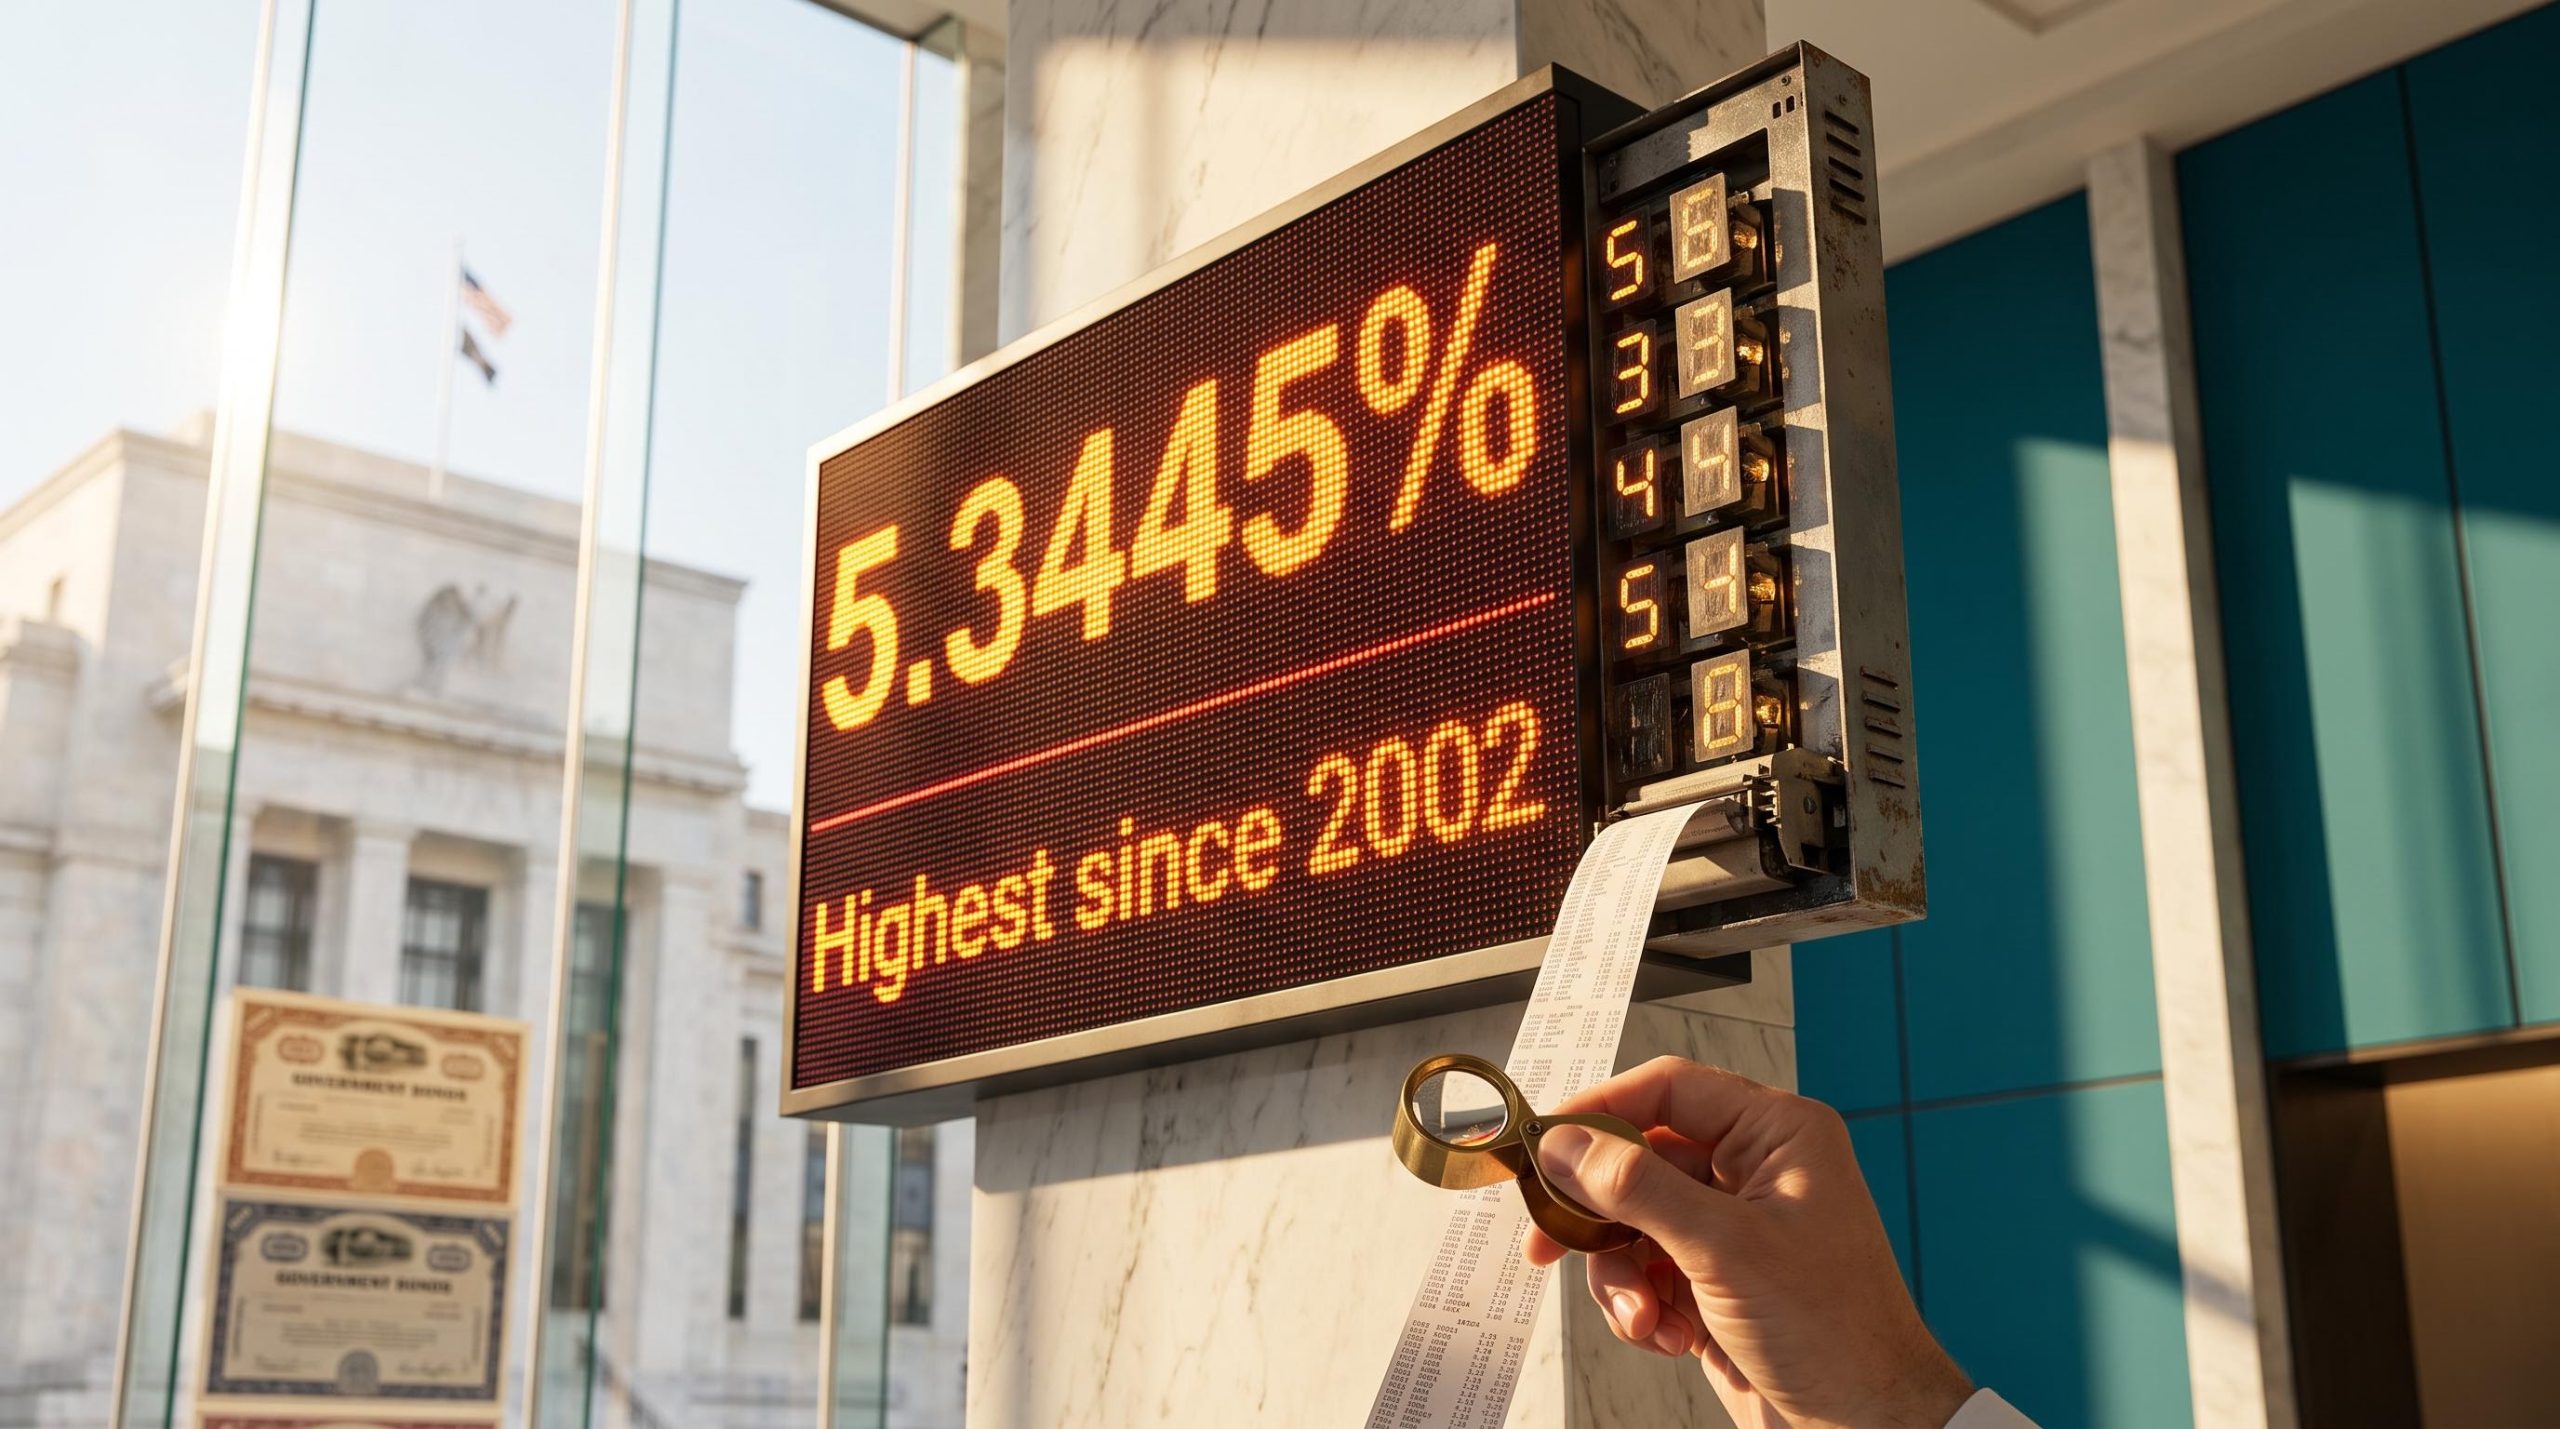
The yield numbers add to the resemblance. The 10-year peaked at roughly 5.8% in 1999. In late September and early October this year, it touched 5.34% intraday, while the 30-year reached about 5.69%.
Yields at a multi-decade peak 10-year: 5.3445% intraday. 30-year: 5.6935% intraday. Reuters described the levels as the highest since 2002 and the move as the biggest quarterly rise in yields this century.
The official Treasury curve for 5 October put the 10-year near 5.31% and the 30-year near 5.66%, so the levels have held rather than spiked and faded. Equities came under pressure when the 10-year hit its high, which is the kind of stress that makes a bubble comparison feel convincing.
The analogy works as a starting hypothesis. A familiar setting and similar yield levels do not tell you whether the cause is the same, and the cause is what should decide how you position.
Why yields move matters as much as how far they move: a rise driven by growth expectations carries different portfolio implications than one driven by inflation or fiscal supply, which is the logic behind testing any analogy on its drivers.
When big ASX news breaks, our subscribers know first
What is a term premium, and why does it matter more than the Fed?
The puzzle is this: the Fed has signalled it does not plan a long hiking cycle, yet long yields keep rising. The answer lies in the term premium.
A term premium is the extra return investors demand for locking money into long-dated bonds, above what they expect to earn by rolling over short-term debt. It pays them for the risk of tying up capital for 10 or 30 years when inflation, supply and policy could all change.
The same term premium rebuilding is visible well beyond the US, with Japanese, UK and Australian long yields repricing together, which suggests supply and uncertainty are global forces rather than a uniquely American bubble signal.
The research points to these drivers, roughly in order of weight:
- Persistent deficits and heavy issuance. With deficits above 6% of GDP, the Treasury has to sell a large volume of long bonds, and buyers want more yield to absorb them.
- Inflation uncertainty. An oil-driven energy shock, along with strong manufacturing and input-price data cited by Reuters, raises the compensation investors want for long-term nominal returns.
- AI capital spending. Heavy investment can lift equilibrium real rates, which are the inflation-adjusted interest rates consistent with a stable economy, and push up global capital costs.
- Reduced official demand. Lower Fed demand for long Treasuries is a plausible contributor, but the research does not confirm it, so treat it as a possible factor rather than an established one.
Hoffmann-Burchardi ties these drivers together in one line:
UBS on duration “In 1999, duration was scarce. Today, duration is abundant.”
Duration here means exposure to long-dated bonds. When there is more of it to absorb, investors charge more to hold it.
Would a Fed pause lower long yields?
Not necessarily. A pause works most directly on short-term rates, which track the policy rate closely. Long yields also carry the term premium, which responds to supply and uncertainty.
In UBS’s view, pushing elevated term premiums lower absent tighter fiscal policy would depend on growth driven by productivity and stretches when real borrowing costs stay low. For your portfolio, this means rate relief from the Fed may not reach the long end of the curve.
Where does the 1999 comparison break down?
Once you apply the term premium lens, the analogy starts to come apart. Comparing the two periods side by side makes the gap clear.
| Metric | 1999 | 2026 |
|---|---|---|
| 10-year yield peak | ~5.8% | ~5.34% (30-year ~5.69%) |
| Core CPI | 1.9% | 2.4% (core PCE ~3%) |
| Real GDP growth | 4.8% | ~2.2% |
| Fiscal position | Budget surplus | Deficits above 6% of GDP |
| Treasury long-bond policy | Buybacks of 30-year bonds | Heavy issuance |
Start with the fiscal rows. In 1999, the government ran a surplus and repurchased 30-year bonds, which shrank the supply of long debt and held term premiums down. Today, the Treasury is issuing heavily.
Fiscal deterioration is already a present-tense budget reality, with net interest outlays overtaking defence spending, and that pressure is a structural reason heavy long-bond issuance is unlikely to fade quickly.
Inflation runs the other way. Core CPI, the consumer price index excluding food and energy, is 2.4% now against 1.9% then. Core PCE, the Fed’s preferred inflation gauge, sits near 3%.
Growth tells the same story. The economy expanded at 4.8% in 1999. Today, growth is about 2.2%, with a softer labour market.
In 1999, scarce long bonds kept yields low despite a booming economy. Today, an abundant supply of long bonds keeps yields high despite weaker growth. You should read today’s yield level as a supply and inflation signal rather than a bubble-peak signal.
What the Fed path tells you
On 16 September, the Fed under Chair Kevin Warsh raised rates by 25 basis points to a range of 3.75-4.00%. The vote was unanimous, and it was the first hike since 2023. Projections point to 4.00-4.25% by year-end.
Futures markets have since pulled back. Pricing for an October hike climbed to roughly 70% before dropping to a little over 20% as of last week’s close, as New York Fed President John Williams struck a more patient tone and September payrolls came in weaker than forecast. Coverage immediately after the meeting showed closer to even odds, so these estimates have moved quickly.
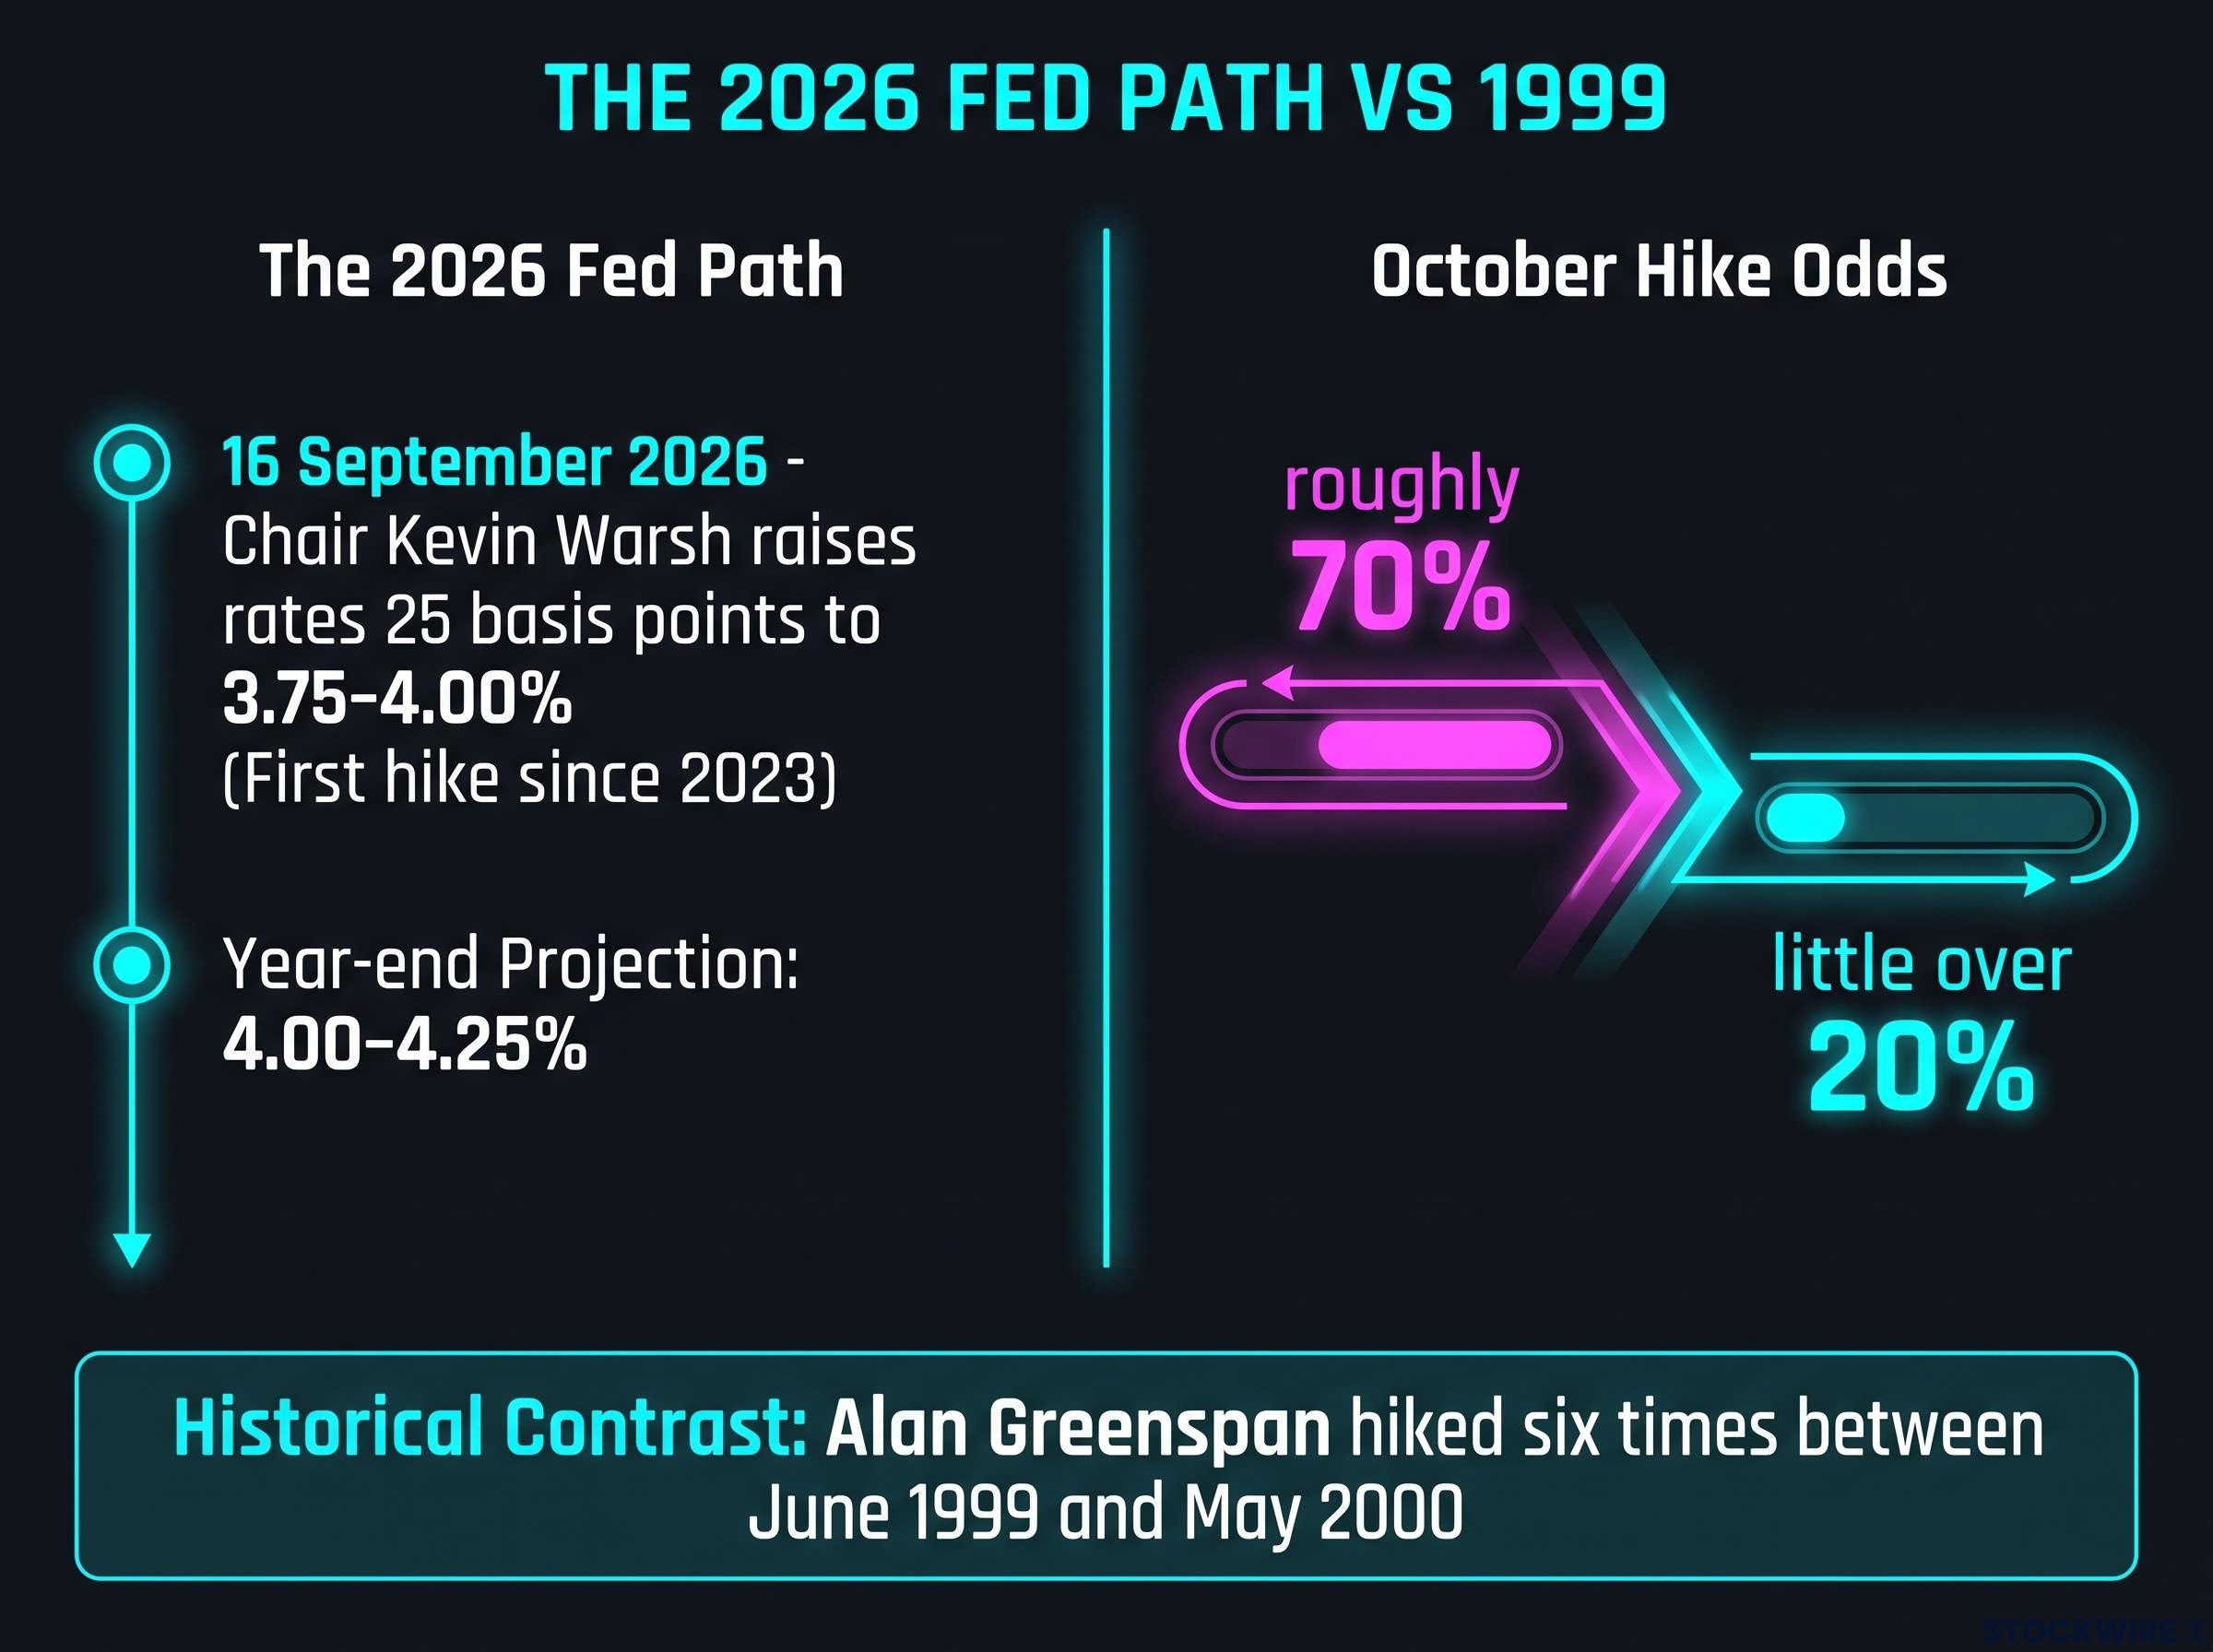
The policy path also differs from 1999. Alan Greenspan hiked six times between June 1999 and May 2000. UBS does not expect a sustained cycle this time, citing slower growth and a softer jobs market.
How should you position, and what could the analogy still get wrong?
From this reading, UBS draws a three-part call:
- Stay invested in AI productivity beneficiaries
- Diversify across equities and high-quality fixed income
- Favour shorter-duration bonds over longer-duration bonds
The logic follows from the analysis above. If abundant supply is keeping the term premium elevated, short bonds reduce your exposure to that risk while still paying meaningful yields.
Keep in mind that coverage of the 1999 analogy is dominated by UBS. No rival strategist views were found, so treat this as one bank’s position rather than a market consensus.
The case against going short
The counter-case has four parts:
- Concentration risk. AI and growth stocks are vulnerable if higher yields compress valuation multiples, and equities already came under pressure at the 10-year high.
- Missing a peak. If the spike in long yields proves cyclical, avoiding long bonds could mean giving up capital gains, as happened after earlier hiking cycles.
- Fed uncertainty. A hawkish Fed clouds the outlook for both stocks and bonds, which may argue for diversified duration rather than a purely short position.
- Lost hedging value. After 1999-2000, long yields fell, long Treasuries delivered strong returns, credit spreads widened and high-beta growth stocks fell sharply. During the 2022-2023 recession scares, long Treasuries also rallied at times.
That history matters. If growth narratives break, long bonds can quickly shift from a source of losses to a hedge, even when starting from a high term premium.
Shorter duration lowers your exposure to term premium risk but gives up that downturn hedge. The decision comes down to which of those two risks your portfolio is better placed to carry.
For readers weighing the shorter-duration call, our dedicated guide to managing bond portfolio duration shows how the 1-5 year curve balances yield against rate sensitivity.
Past performance does not guarantee future results. Financial projections are subject to market conditions and various risk factors.
What the 1999 comparison explains, and what it does not
The 1999 comparison captures the setting but not the cause. The test that holds up is to check any historical analogy against its drivers (supply, inflation, growth and the policy path) rather than the headline yield.
On those drivers, today’s market looks like abundant supply meeting persistent inflation, not scarce bonds meeting a growth boom. Several data points will show whether that reading holds:
- The next Fed meeting and October hike odds
- The pending quarterly GDP release
- Oil prices and inflation data
- Deficit and issuance trends
If supply and inflation pressures ease, the case for holding long bonds strengthens. If they persist, shorter duration remains the more defensible choice.
This article is for informational purposes only and should not be considered financial advice. Investors should conduct their own research and consult with financial professionals before making investment decisions.
—