One stock trades at about 8.5x free cash flow while its revenue shrinks. The other trades at about 7.5x free cash flow while its earnings multiple sits near 50. Read through a single valuation lens, both Lululemon and MercadoLibre look cheap, yet a closer stock analysis shows that neither is obviously a bargain.
The pair attracted attention because Michael Burry’s Scion Asset Management disclosed new positions in both in its Q1 2026 13F, filed on 15 May 2026. A 13F is a quarterly filing that large US investment managers use to report their stock holdings. Burry’s interest is a reason to examine these companies, not a reason to buy them.
The figures below run to early October 2026. Several have shifted since the most widely shared valuation models were built.
After reading, you will know how to tell a genuinely low price-to-free-cash-flow ratio from a trap. You will also see what three-scenario models imply for each company once you account for the inputs that have since moved.
Why does a low price-to-free-cash-flow ratio not always mean cheap?
A single-digit multiple looks like the kind of number value investors search for. It can also be a warning.
Free cash flow (FCF) is the cash a business has left after paying its operating costs and its capital expenditure (capex), which is spending on equipment, buildings and other long-term assets. The price-to-free-cash-flow ratio (P/FCF) divides a company’s market value by that cash. Many investors prefer it to the price-to-earnings ratio (P/E) because accounting choices can bend earnings, while cash is harder to disguise.
On paper, both companies screen well.
| Metric | Lululemon (LULU) | MercadoLibre (MELI) |
|---|---|---|
| Market cap | $11.63B | $92.5B |
| Free cash flow (last year) | $1.35B (5-year avg $1.09B) | $12.4B (headline) |
| P/FCF | About 8.5x | About 7.5x |
| P/E | Not provided in research | About 50x |
| Return on capital (5-year / 1-year) | 29% / 20% | 31% / 19% |
| Gross margin | 56% | 43% |
Return on capital measures how much profit a company earns on the money invested in it. Both companies sit near 30% over five years, but both have slipped to around 20% in the latest year. The quality is real, yet it is fading.
The MELI gap A P/FCF of about 7.5 sitting beside a P/E of about 50 means cash flow and earnings are telling two very different stories about the same business.
That gap does not prove undervaluation. It signals that something is being counted differently between the two measures, and you need to find out what before trusting either number.
The MercadoLibre gap is a live example of free cash flow versus EPS diverging, where a cash measure and an accrual measure describe the same business very differently; investors checking cash conversion before trusting either number avoid the most common trap.
A ratio is also a snapshot. A discounted cash flow model (DCF) estimates what a company is worth today based on the cash it may generate in future. The models examined here run 10 years under three scenarios, varying revenue growth, margins and the exit multiple, against a 9.5% target annual return.
What this tells you is simple: a low P/FCF usually means the market doubts the cash will last or is as clean as it looks. Ask why before you treat the multiple as a margin of safety.
When big ASX news breaks, our subscribers know first
What do the three-scenario models say about Lululemon?
The original presenter’s model makes Lululemon look compelling. Using a share price of $103, it produces this range:
| Scenario | Revenue growth | Margin | P/E | Implied value |
|---|---|---|---|---|
| Low | 2% | 10% | 13 | $125 |
| Mid | 4% | 12% | 17 | $200 |
| High | 6% | 14% | 21 | $315 |
The mid-case implies roughly 20% annual returns. Even the low case sits above the price used. The problem is that the ground under those assumptions has already shifted.
The guidance problem
Lululemon has cut its FY2026 outlook twice in a row:
- 17 March 2026: revenue growth of +2% to +4%, EPS of $12.10-12.30
- 4 June 2026: revenue of about -1% to flat, EPS of $10.95-11.15
- 3 September 2026: revenue of -5% to -7%, EPS of $9.48-9.73
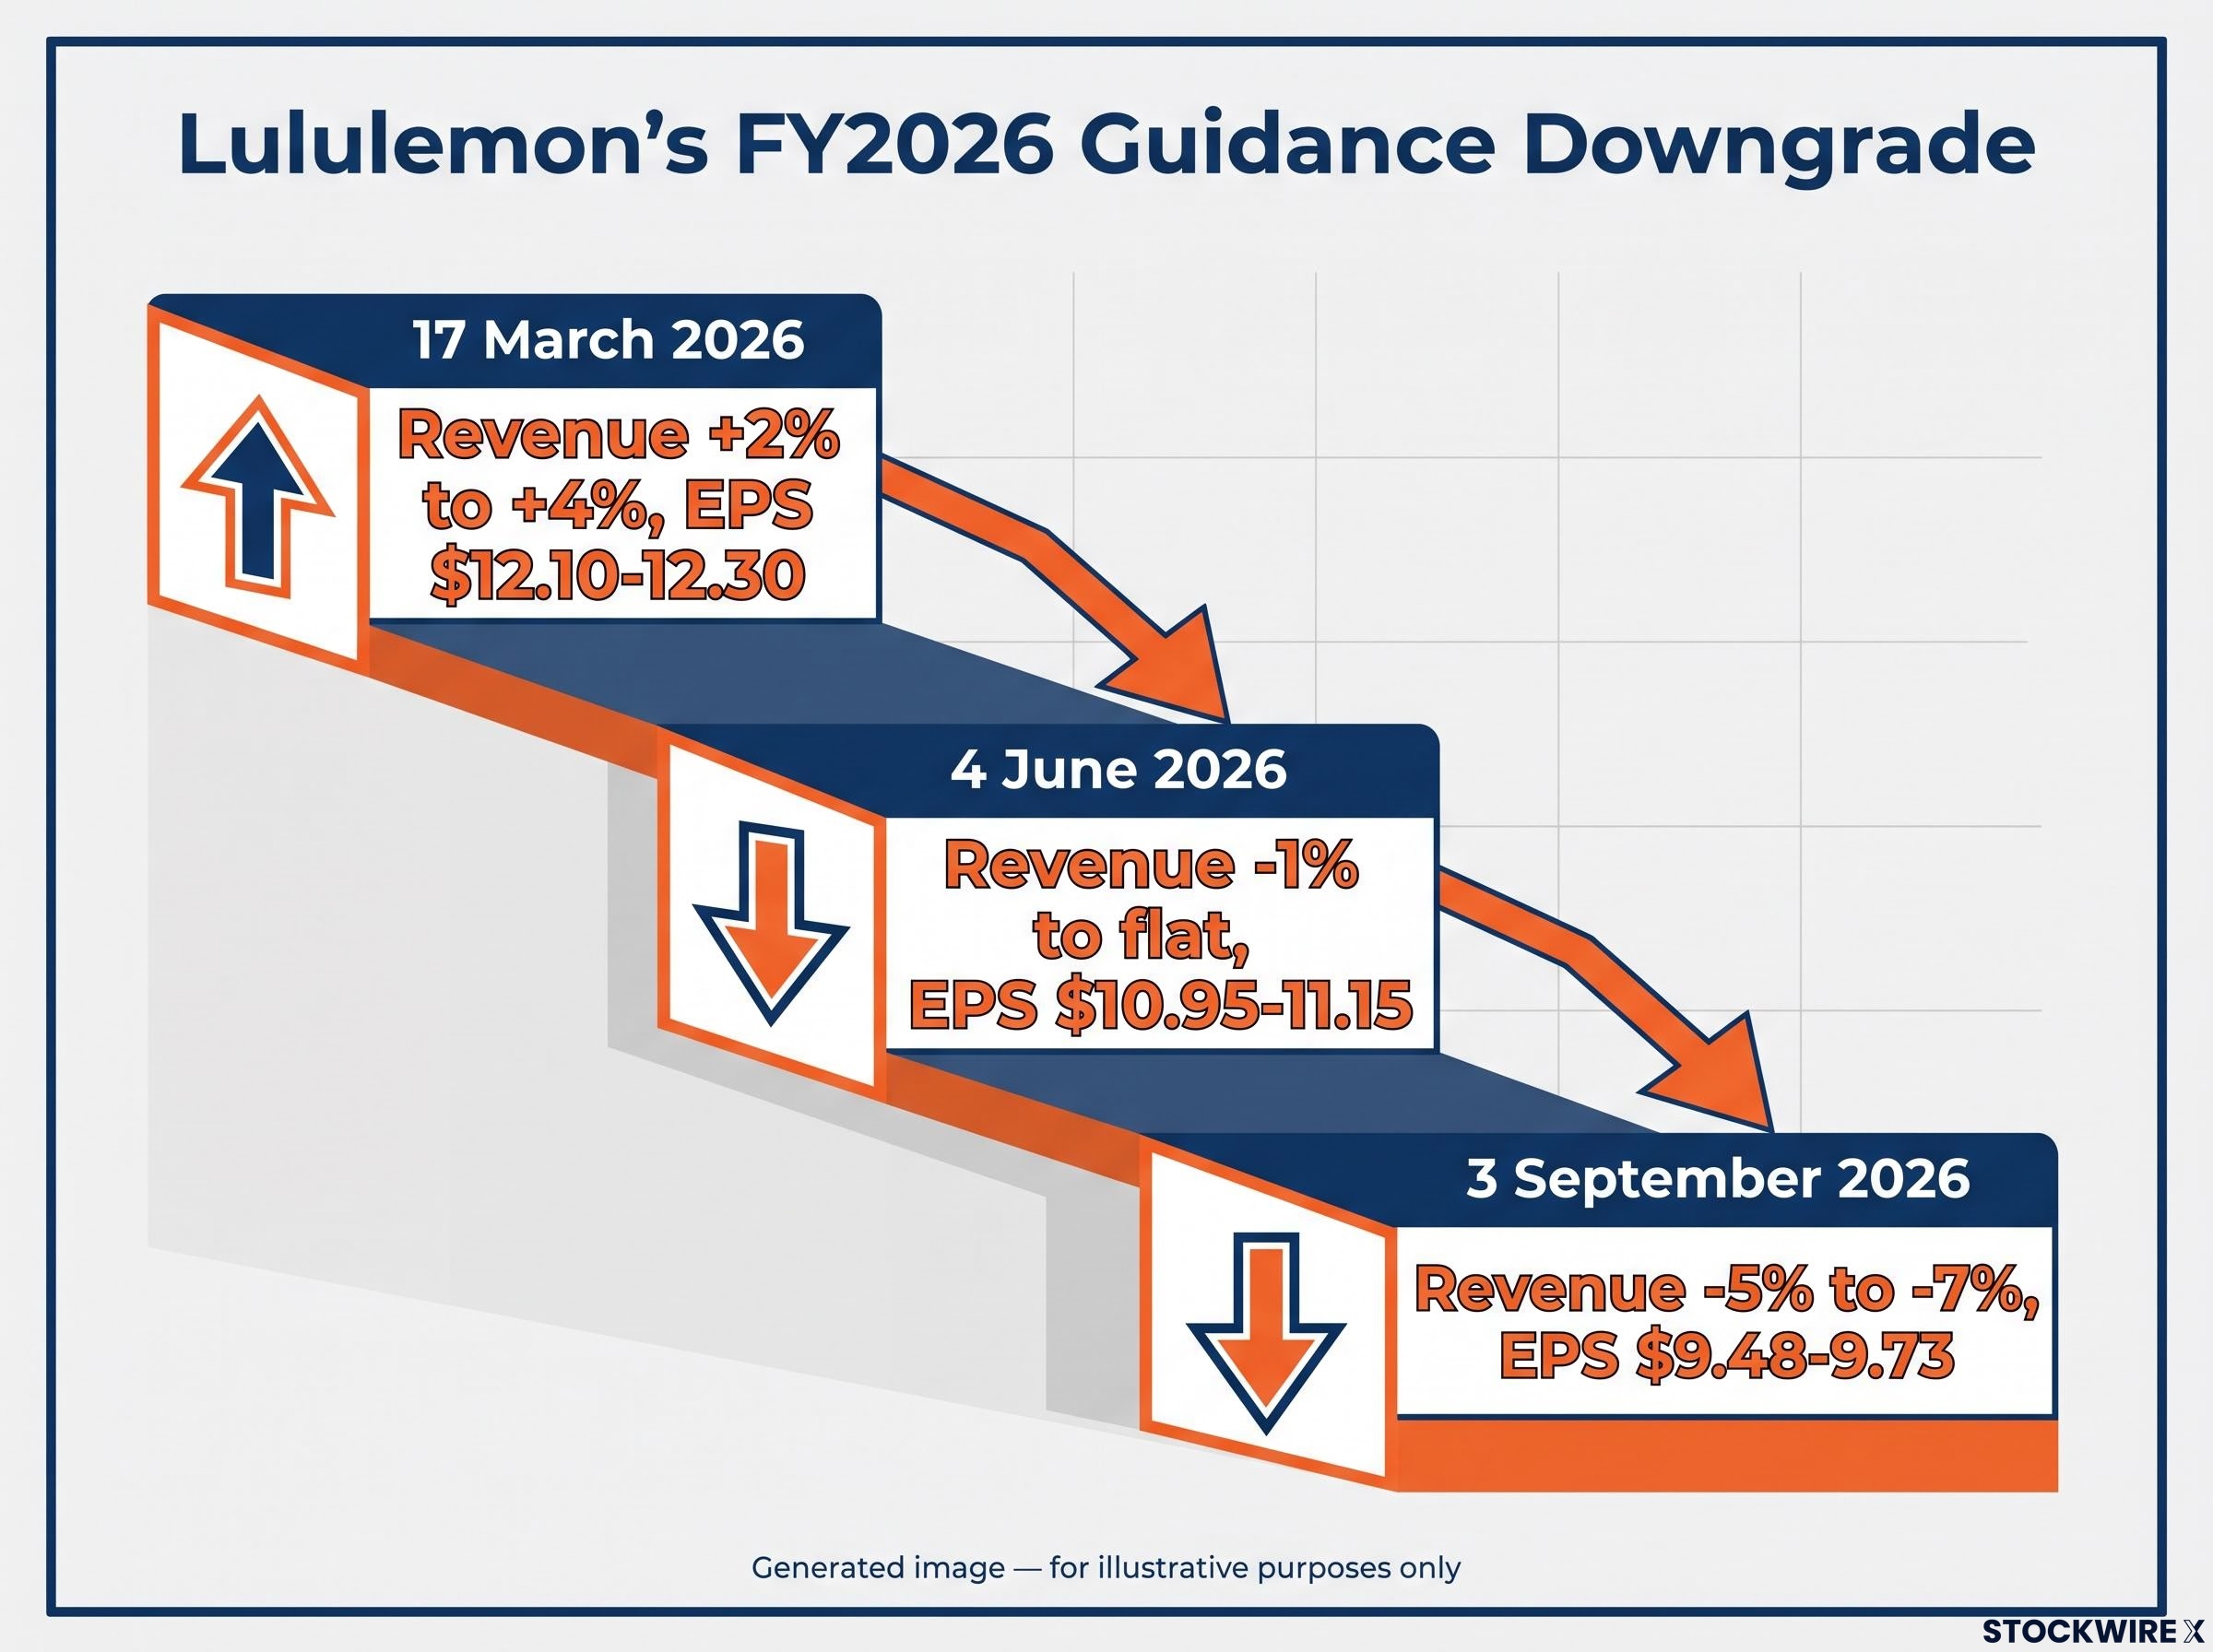
The analyst base of about $11 EPS for the year ending February 2027 matches the June guidance. It predates the September cut.
The Q2 FY2026 result explains the downgrade. Revenue fell 4% to $2.4B, comparable sales dropped 9% and Americas comps slid 12%. Comparable sales measure growth at stores and channels open for at least a year, stripping out new openings.
Even those numbers flatter the business. Tariff refunds added 560 basis points to gross margin and $0.86 to EPS, a benefit that may not recur.
Historical growth shows the trend clearly: 17.6% a year over 10 years, 15% over five, 8% over three, and now negative guidance. That trajectory suggests the model’s 2-6% growth cases may already be optimistic, so you should add a negative-growth case before trusting the $200 mid-case.
The longevity question
The presenter avoids the stock, saying he would not be shocked if the brand vanished or changed greatly within 20 years. A 56% gross margin, against about 40% for Nike, depends on brand strength persisting.
Athleisure fatigue sharpens the concern. In mid-May, Bernstein and Piper Sandler held “Hold” ratings and saw no near-term catalyst. A valuation that only models stabilisation leaves out the scenario that matters most.
What do the models say about MercadoLibre, and which free cash flow figure is real?
MercadoLibre, often called Latin America’s Amazon, produces even more striking numbers. Against a price of $1,831, the presenter’s model uses revenue growth of 10/18/26%, FCF margins of 28/32/36% and P/E multiples of 19/22/25.
The scenario spread Implied values of $5,600, $13,000 and $30,000 per share. A range this wide expresses uncertainty, not precision.
The growth case has support. Historical revenue growth runs at 48% over 10 years, 45% over five and 40% over three. Analysts expect EPS to climb from $38 to $175 within four years, with revenue growth of 45%, 28%, 25%, 30% and 25%.
Q2 2026 delivered the first quarter above $10 billion in revenue: $10.169B, up about 50% (43% excluding currency moves). The cash picture is where it gets complicated.
Which free cash flow is real?
The $12.4B headline figure and the company’s own adjusted measure treat lending very differently. MercadoLibre runs a large credit business, and the money it lends out (its credit book) moves through working capital.
| Measure | Figure | Treatment of credit book | Implication |
|---|---|---|---|
| Headline FCF (last year) | $12.4B | Not deducted as an investment | Supports the ~7.5x P/FCF |
| Adjusted FCF, Q2 2026 | $214M | About $2.1B credit growth treated as investment, plus $441M capex | Cash looks thin relative to size |
| Adjusted FCF, Q1 2026 | -$56M | Same treatment; seasonally weak quarter | Single quarters swing widely |
The model’s 28-36% FCF margin assumptions line up with the headline view, not the adjusted one. If you regard credit growth as a cost of doing business, the cheap-looking multiple disappears. You need to choose a definition before comparing MercadoLibre with anything else.
Margins add a second layer of risk. Q1 revenue rose 49% to $8.85B, yet operating income fell 20% and operating margin contracted 600 bps to 6.9%. In Q2, operating income of $683M gave a 6.7% margin, down 550 bps, with net income of $466M.
Fast growth paired with shrinking margins is the central threat to those FCF margin assumptions.
Management frames the margin squeeze as deliberate investment in logistics and credit scaling rather than competitive deterioration, though the case rests on credit quality holding as the loan book grows.
Value or trap? Risks, analyst caution and how Burry’s positioning fits
Each company carries a distinct set of risks:
- Lululemon: declining revenue, a brand longevity question and weakness concentrated in the US and wider Americas.
- MercadoLibre: competition from Amazon, Shein and Temu, currency and macro exposure in Argentina, Brazil and Mexico, and credit quality on a fast-growing loan book.
| Factor | LULU | MELI |
|---|---|---|
| Bull point | Market may have overreacted; stabilisation could drive large upside | ~50% revenue growth and record quarter |
| Bear point | Two consecutive guidance cuts; athleisure fatigue | Margins down 550-600 bps; credit risk |
| Cash flow quality | Flattered by tariff refunds | Depends on credit-book definition |
| Analyst stance | “Hold” from Bernstein and Piper Sandler | No consolidated consensus found |
The research has clear limits. No delinquency or charge-off data for MercadoLibre was found, no consolidated consensus targets exist for either stock, and no 13F after Q1 2026 was located.
Burry’s positioning in context
The Q1 2026 filing showed Burry exiting Chinese technology, opening positions in MercadoLibre, Adobe, PayPal and Lululemon, and cutting the portfolio to nine holdings.
He bought MercadoLibre in the 1,600s the morning after Q1 earnings, when the stock fell nearly 13% on margin deterioration, according to his Substack post on 9 May. TheStreet reported on 20 May that he built a Lululemon stake around $120, with the stock down 42.1% year-to-date.
That is drawdown buying: concentrated, contrarian bets on out-of-favour names. The presenter views Burry as seemingly short-term oriented. October reports of tax-loss sale and repurchase plans on Lululemon reinforce the point, since his $120 entry already sits above the $103 model price.
Because 13F data arrives late and Burry trades on mispricing rather than holding for a decade, treat his holdings as a prompt to research, never as a signal to follow.
Weighing the evidence: what a cash flow lens can and cannot settle
Lululemon is cheap on cash flow but faces falling guidance and an open question over brand longevity. MercadoLibre is cheap on one free cash flow definition and expensive on another.
Before acting on either, run four checks:
- Confirm which FCF definition the valuation uses.
- Add a decline scenario, not just stabilisation cases.
- Check whether model assumptions predate the latest guidance.
- Match the investment horizon to your own, not Burry’s.
The next markers to watch are Lululemon’s upcoming guidance and comparable sales, and MercadoLibre’s margin and credit-book trends across several quarters rather than one.
Readers wanting broader context on whether growth names are cheap can use our detailed coverage of the growth stock discount, which sets out the macro conditions needed for it to close.
This article is for informational purposes only and should not be considered financial advice. Investors should conduct their own research and consult with financial professionals before making investment decisions. Past performance does not guarantee future results. Financial projections are subject to market conditions and various risk factors.