
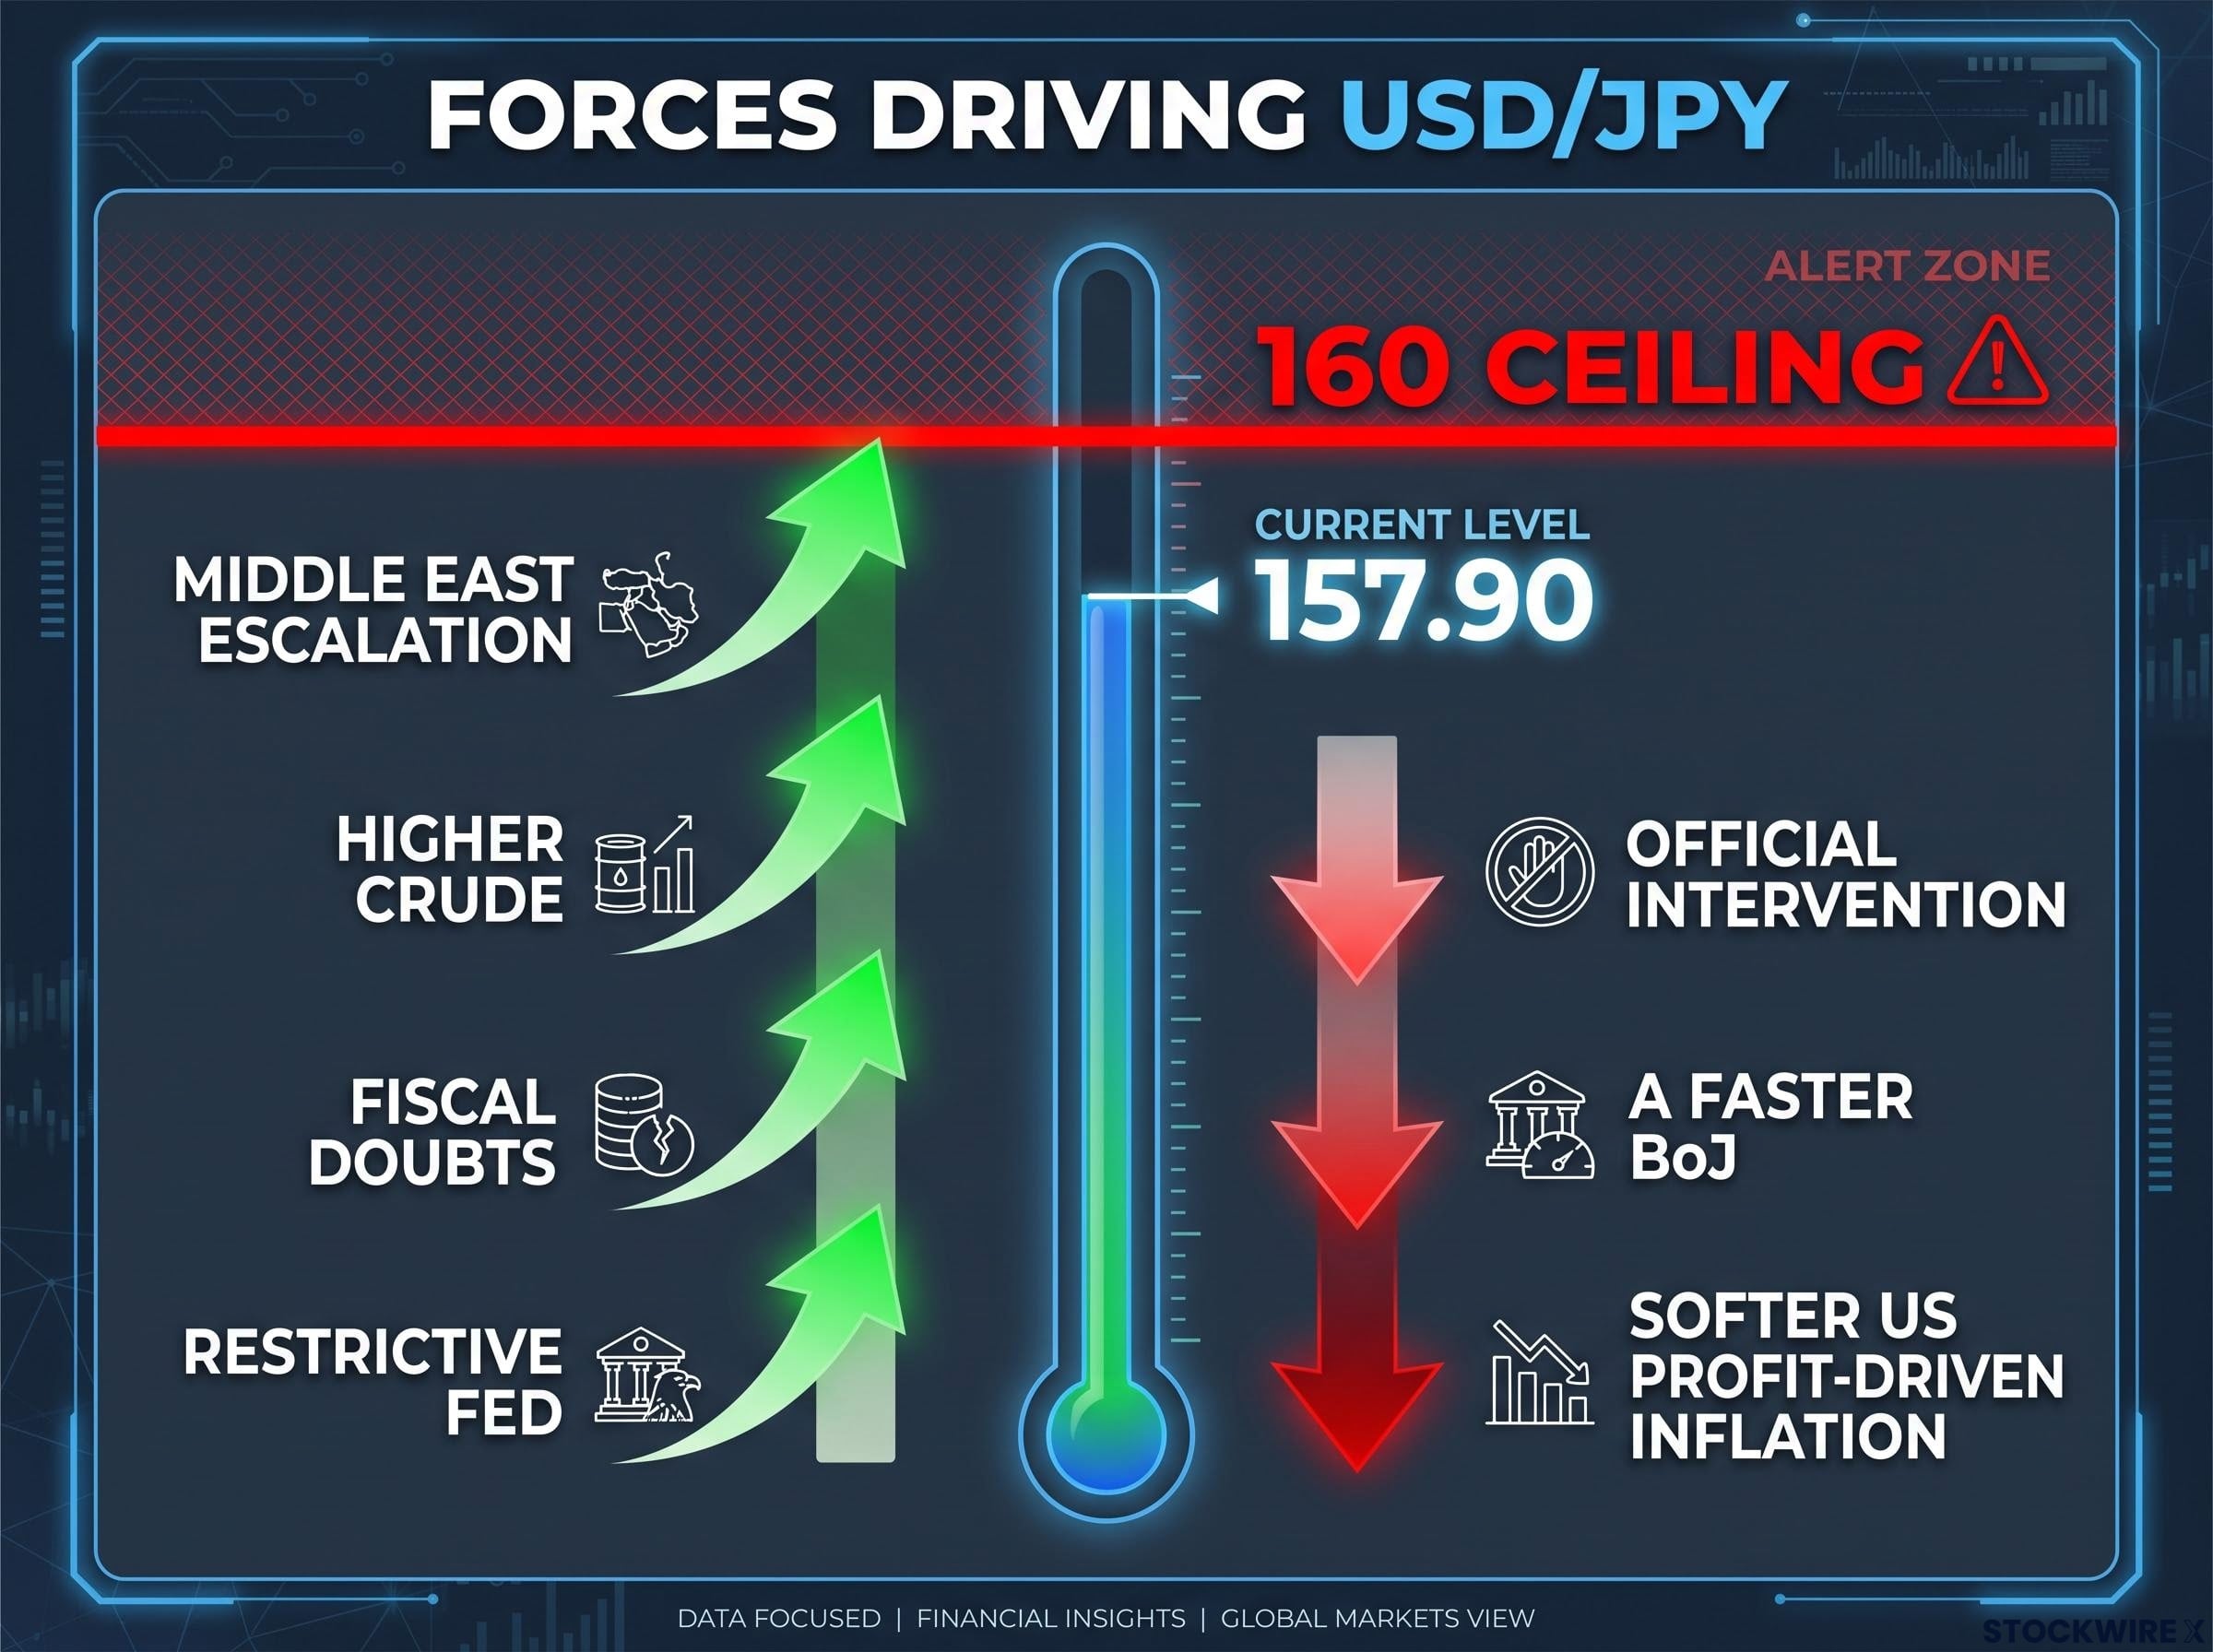
USD/JPY sits near 157.90, and the pair looks calm while the forces beneath it pull in opposite directions. The 160 line is only about 2-3 yen away, and the market knows it.
Three things are live at once: a rare coordinated Tokyo-Washington intervention in August, a Bank of Japan (BoJ) policy rate at a 31-year high, and a costly Japanese tax cut plan. The next move depends on which force wins.
Here is what this USD JPY analysis shows about the drivers that push the pair up, the ones that cap it, and the signals worth watching next.
Why is the pair stuck in the high 150s?
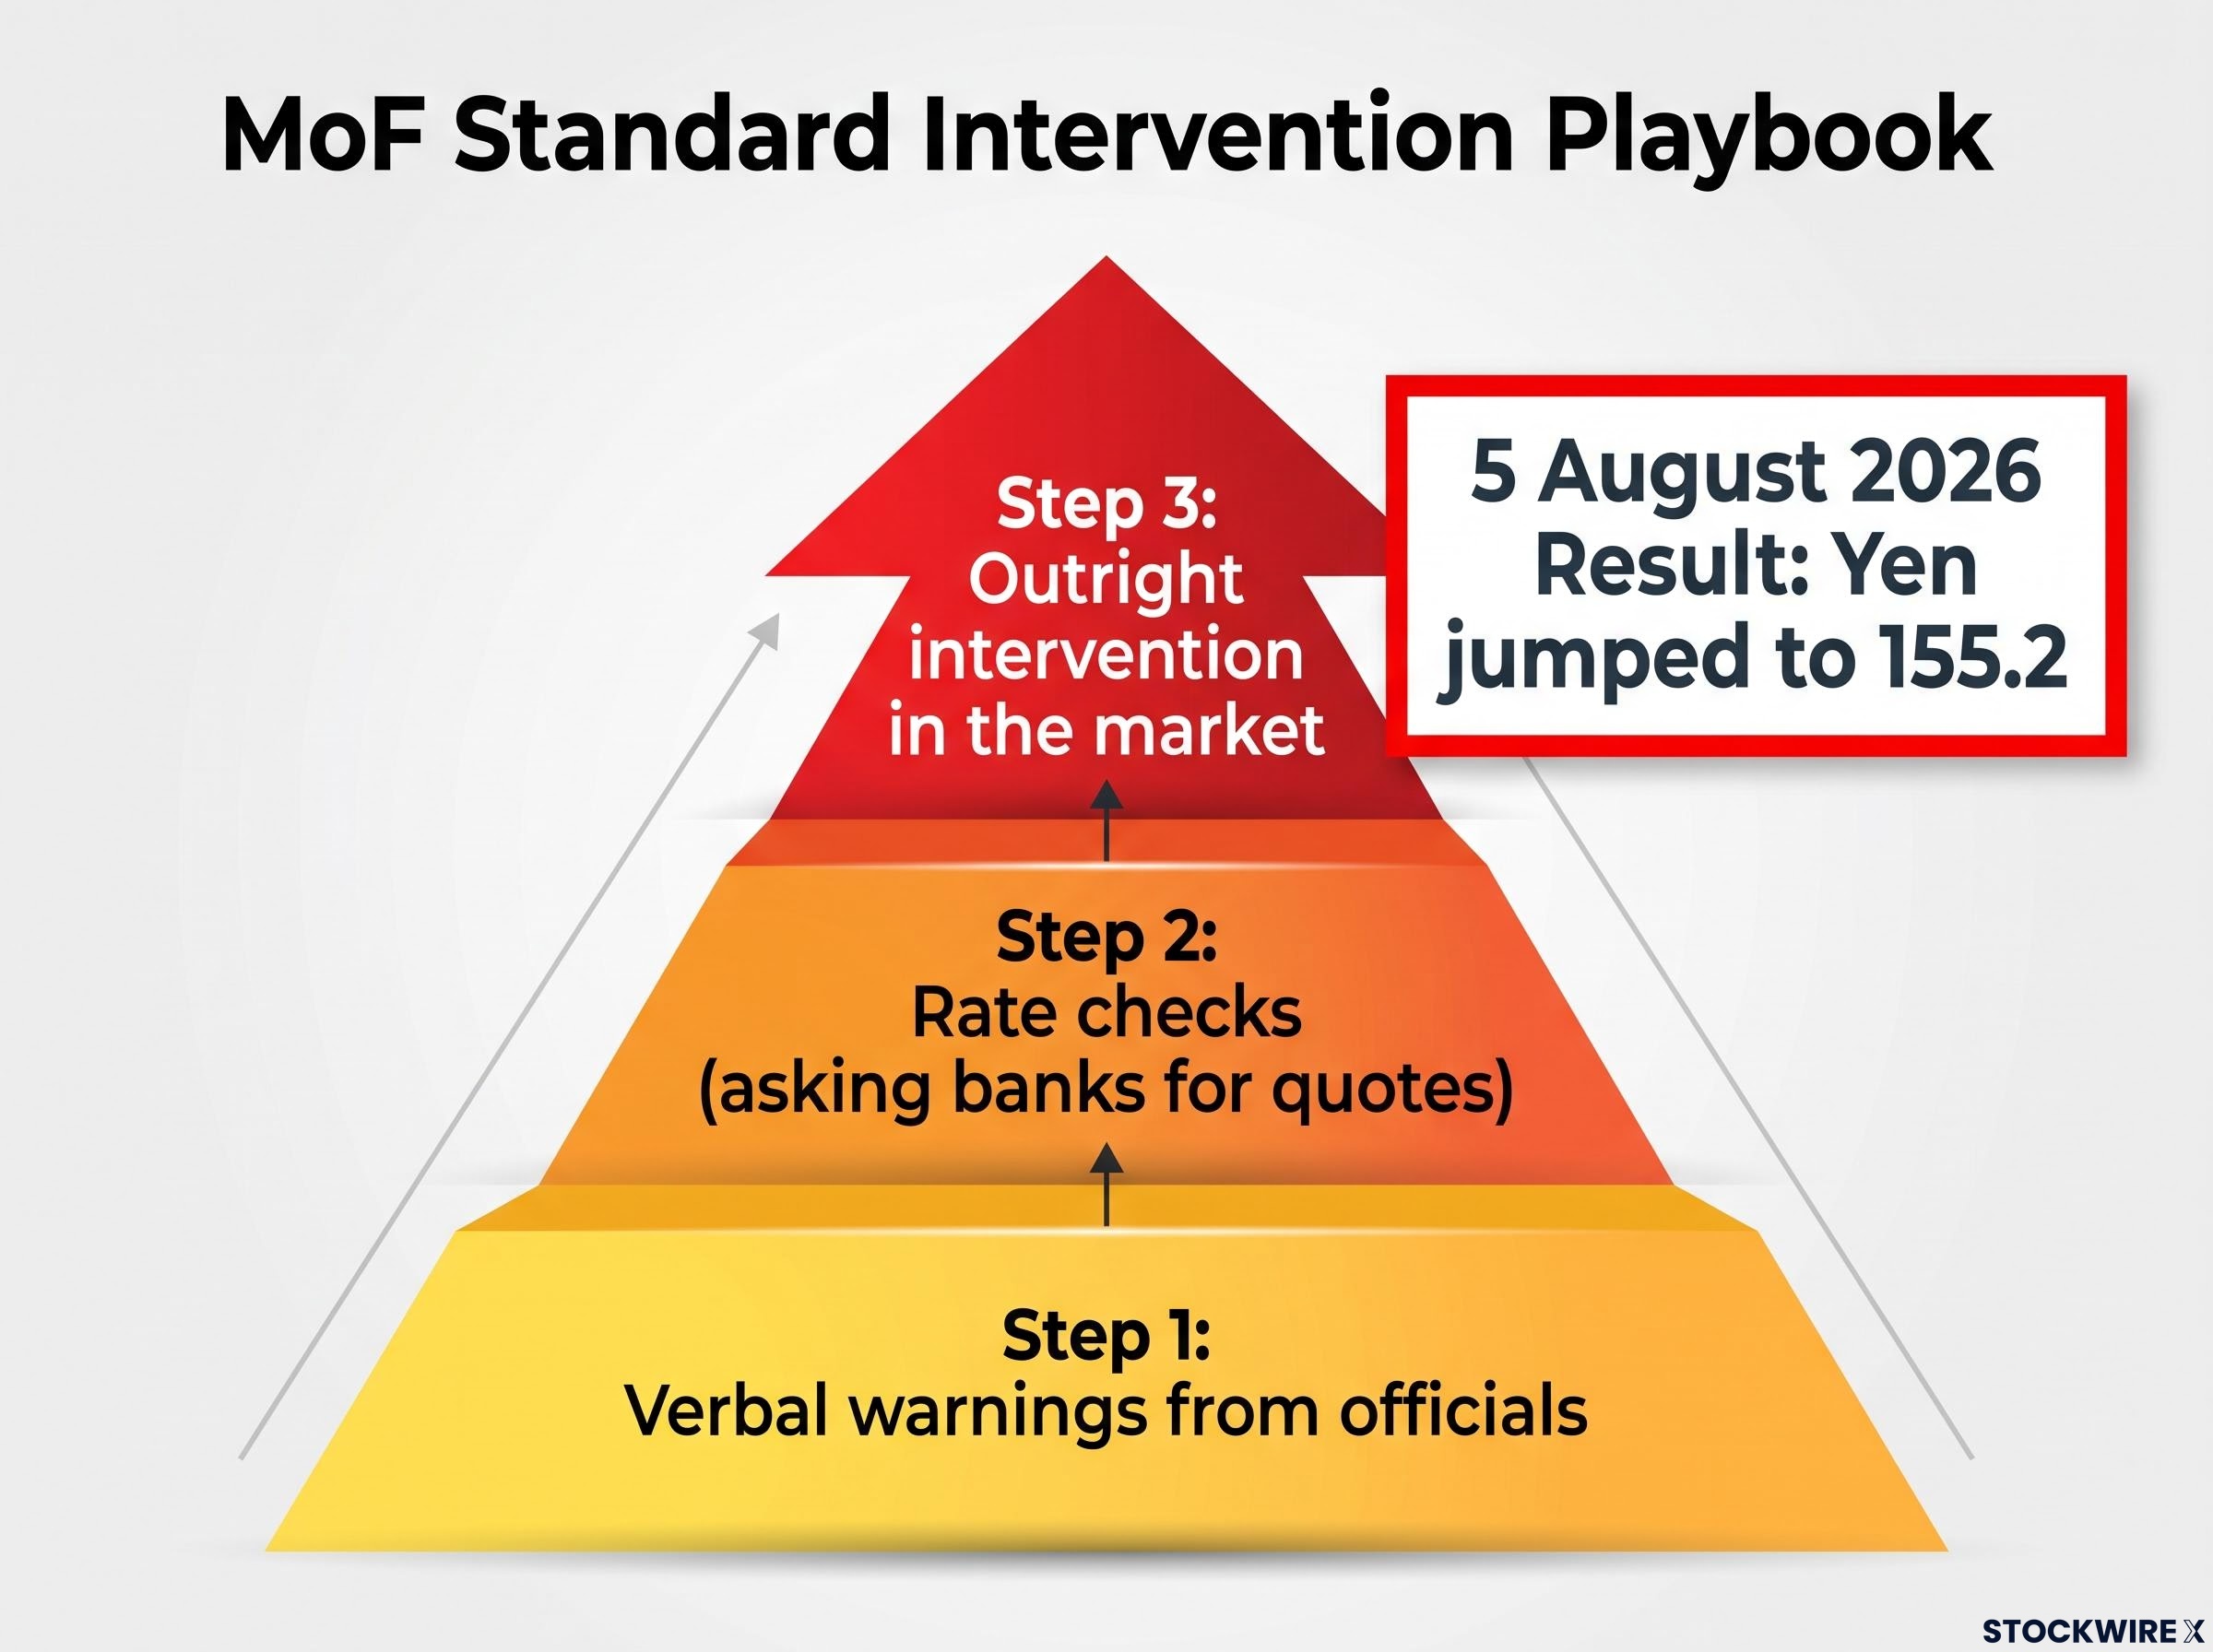
On 5 August 2026, after a coordinated intervention by Tokyo and Washington, the yen jumped to 155.2 per dollar, a three-month high, according to Reuters. Within hours it slid back to about 157.6.
The first coordinated yen intervention since 2011 was designed with the US Treasury market in mind, with Washington selling euro reserves rather than dollars, yet the rate differential it left untouched explains the rebound.
Since then the pair has ground higher. It was range-bound near 157.90 in Tuesday’s Asian session after a slight gain the day before.
Investing.com’s 28 September note captured the pattern: the pair “grinds toward 160 on fundamentals and is knocked back on intervention risk.” The ceiling emerged from the sequence, not from any single announcement.
The quick reversal of the August spike matters. It shows intervention changes the price, not the underlying drivers.
As the pair nears 160, the Ministry of Finance (MoF) follows what Investing.com calls a “standard playbook”:
- Verbal warnings from officials
- Rate checks, where the ministry asks banks for quotes to signal it is watching
- Outright intervention in the market
Societe Generale’s Kit Juckes, quoted by CNBC, put the limits plainly:
Kit Juckes, Societe Generale Further intervention looks likely, but it is “unlikely to deliver a sustained recovery.”
The yen was still the G10’s top performer in Q3, per Deutsche Bank data cited by CNBC. The asymmetry is what matters to you: upside is capped by the threat of sudden official action, while a single-session drop can be sharp, so range-bound does not mean low-risk.
When big ASX news breaks, our subscribers know first
What is pushing the dollar higher against the yen?
Three layers of pressure keep the pair near its ceiling, and they are easy to blur together.
Japan’s fiscal gamble
Prime Minister Sanae Takaichi plans to cut the consumption tax on food from 8% to 1% for two years, starting next April. The cabinet approved the tax reform outline on 15 September, and Reuters estimated the lost revenue at roughly ¥5 trillion (about $31.7 billion).
Takaichi has pledged to fund it without issuing deficit-covering bonds, a promise she repeated on 5 October, according to Bernama. Not everyone is persuaded: senior Liberal Democratic Party (LDP) figure Taro Kono warned, via CNBC, that the plan could push rates higher and weaken the yen.
For you, the point is that the yen is being pulled by credibility as much as by rates. If markets doubt the funding pledge, the cost shows up in Japanese government bond yields and the yen, whatever the BoJ does.
The BoJ’s unclear next step
The BoJ raised its policy rate by 25 basis points to 1.25% on 17-18 September, by a 7-2 vote. Its Summary of Opinions, released 1 October, contained no explicit call for an October hike, and government representatives urged caution near the neutral range.
Inflation gives the bank reasons both ways. National core CPI (consumer prices excluding fresh food) was 1.7% year-on-year in August, while the measure excluding fresh food, energy and special factors hit 2.6%. Tokyo core CPI reached 2.7% in September.
What ultimately moves the pair is convergence speed, meaning how fast the US-Japan rate gap narrows, rather than the size of today’s spread, which is why simultaneous Fed and BoJ hikes can leave USD/JPY unchanged.
The hike was historic, yet it has not broken the pattern. Here is how the pieces fit:
| Driver | Latest development | Pressure on USD/JPY | Key date |
|---|---|---|---|
| Japan fiscal plan | Food tax cut to 1%, outline approved | Higher | 15 September 2026 |
| BoJ policy | Hike to 1.25%, timing of next move unclear | Mixed | 17-18 September 2026 |
| Japan inflation | Tokyo core CPI at 2.7% | Lower, if it speeds BoJ hikes | September 2026 |
| Fed policy | Funds rate at 3.75-4.00% | Higher | September 2026 |
How does the Fed drive the US dollar?
The mechanism is simple: when US interest rates rise, holding dollars pays more, and demand for the currency tends to rise with them. The Federal Reserve (Fed) steers rates to meet its dual mandate of price stability and full employment.
Hikes when inflation runs above 2% support the dollar. Cuts when inflation is low or unemployment is high weigh on it. The dollar’s weight makes this matter, per FXStreet:
Dollar dominance The US dollar accounts for over 88% of global currency turnover, about $6.6 trillion daily (2022 data).
It replaced the pound as the reserve currency after World War II, and stayed gold-backed until the Bretton Woods arrangement ended in 1971.
Rates, QE and QT in plain terms
Quantitative easing (QE) means the Fed creates dollars to buy bonds, as it did in the 2008 crisis, and it usually weakens the dollar. Quantitative tightening (QT) means stopping those purchases and reinvestment, which is usually dollar-positive.
The chain of cause and effect runs like this:
- An inflation reading comes in above or below the 2% goal.
- The Fed signals or makes a policy response.
- The gap between US and Japanese rates widens or narrows.
- The currency pair moves.
August PCE (the Fed’s preferred inflation gauge) ran at 3.4% headline and 3.0% core. You can use this as a decoder: when a Fed headline lands, ask whether it widens or narrows the gap with Japanese rates, and you have a first read on USD/JPY direction.
The Fed’s policy levers are now all pointing the same way, with the funds rate at 3.75-4.00% and the balance sheet still shrinking, which keeps the rate gap with Japan wide and the dollar supported.
What does HSBC’s profit-driven inflation view change?
The common account of US inflation points to rising energy and computing expenses, along with the ongoing effect of tariffs. HSBC offers a different reading, according to a 6 October Mitrade note.
Its gross value-added (GVA) deflator splits inflation into three parts:
- Profits
- Wages
- Non-labour costs
HSBC concludes that stronger profit growth was the main force behind the recent pick-up in headline inflation. That points to corporate pricing power rather than pure cost-push.
Profit-led inflation fits with record corporate margins, where profits have reached about 18% of national income, and that pricing power is also why the margin trend is worth tracking as an inflation signal.
The policy link follows. Sticky, profit-driven inflation keeps the Fed restrictive, while HSBC’s Investment Weekly (5 October) expects profit growth to moderate in 2027, letting the Fed stop at 4.50%.
Markets price only about 20-21% odds of a hike at the late-October meeting, with a high probability of one by December. One caveat: no other institution was found confirming or disputing the GVA-deflator claim, so treat it as one bank’s view.
This tells you that the dollar’s support may depend on corporate pricing power rather than commodity prices, so earnings and margin data become inflation signals worth watching.
Do Middle East tensions and intervention risk change the picture?
Geopolitics cuts through two channels. Xinhua reported that Yemen’s Houthi group claimed drone and missile attacks on Saudi targets, and escalation can lift the dollar through safe-haven demand.
The second channel is oil. Shipping disruption around the Strait of Hormuz has contributed to surging crude prices, which raise Japan’s imported inflation and support the dollar through US energy costs and restrictive policy. No source found argues the yen’s safe-haven status has weakened, though the research also offers little detail on the 2022 and 2024 intervention episodes.
The Straits Times warned that the tax cut could trigger reactions that weaken the yen further:
The Straits Times The plan could trigger “negative market reactions that would weaken the yen further.”
The risks pull in different directions:
- Upside for the pair: Middle East escalation, higher crude, fiscal doubts, restrictive Fed
- Downside for the pair: Official intervention, a faster BoJ, softer US profit-driven inflation
Investing.com warns that sudden one-session drops can catch leveraged carry traders off guard. For you, the lesson is that a headline can push the pair up and trigger official resistance at once, so position sizing matters more than direction.
What to watch before the next move in USD/JPY
Fundamentals push the pair higher, the 160 area acts as an intervention ceiling, and the range holds until one side shifts. The catalysts are specific:
- BoJ meetings in October and December
- The late-October FOMC (about 20-21% hike odds)
- The legislative path of the food tax cut
- Middle East developments
- Any MoF verbal warnings
The decision for you is whether your exposure assumes a breakout or a reversal. Neither is guaranteed, and the next catalyst will show which force is gaining.
This article is for informational purposes only and should not be considered financial advice. Investors should conduct their own research and consult with financial professionals before making investment decisions. These statements are speculative and subject to change based on market developments.
—