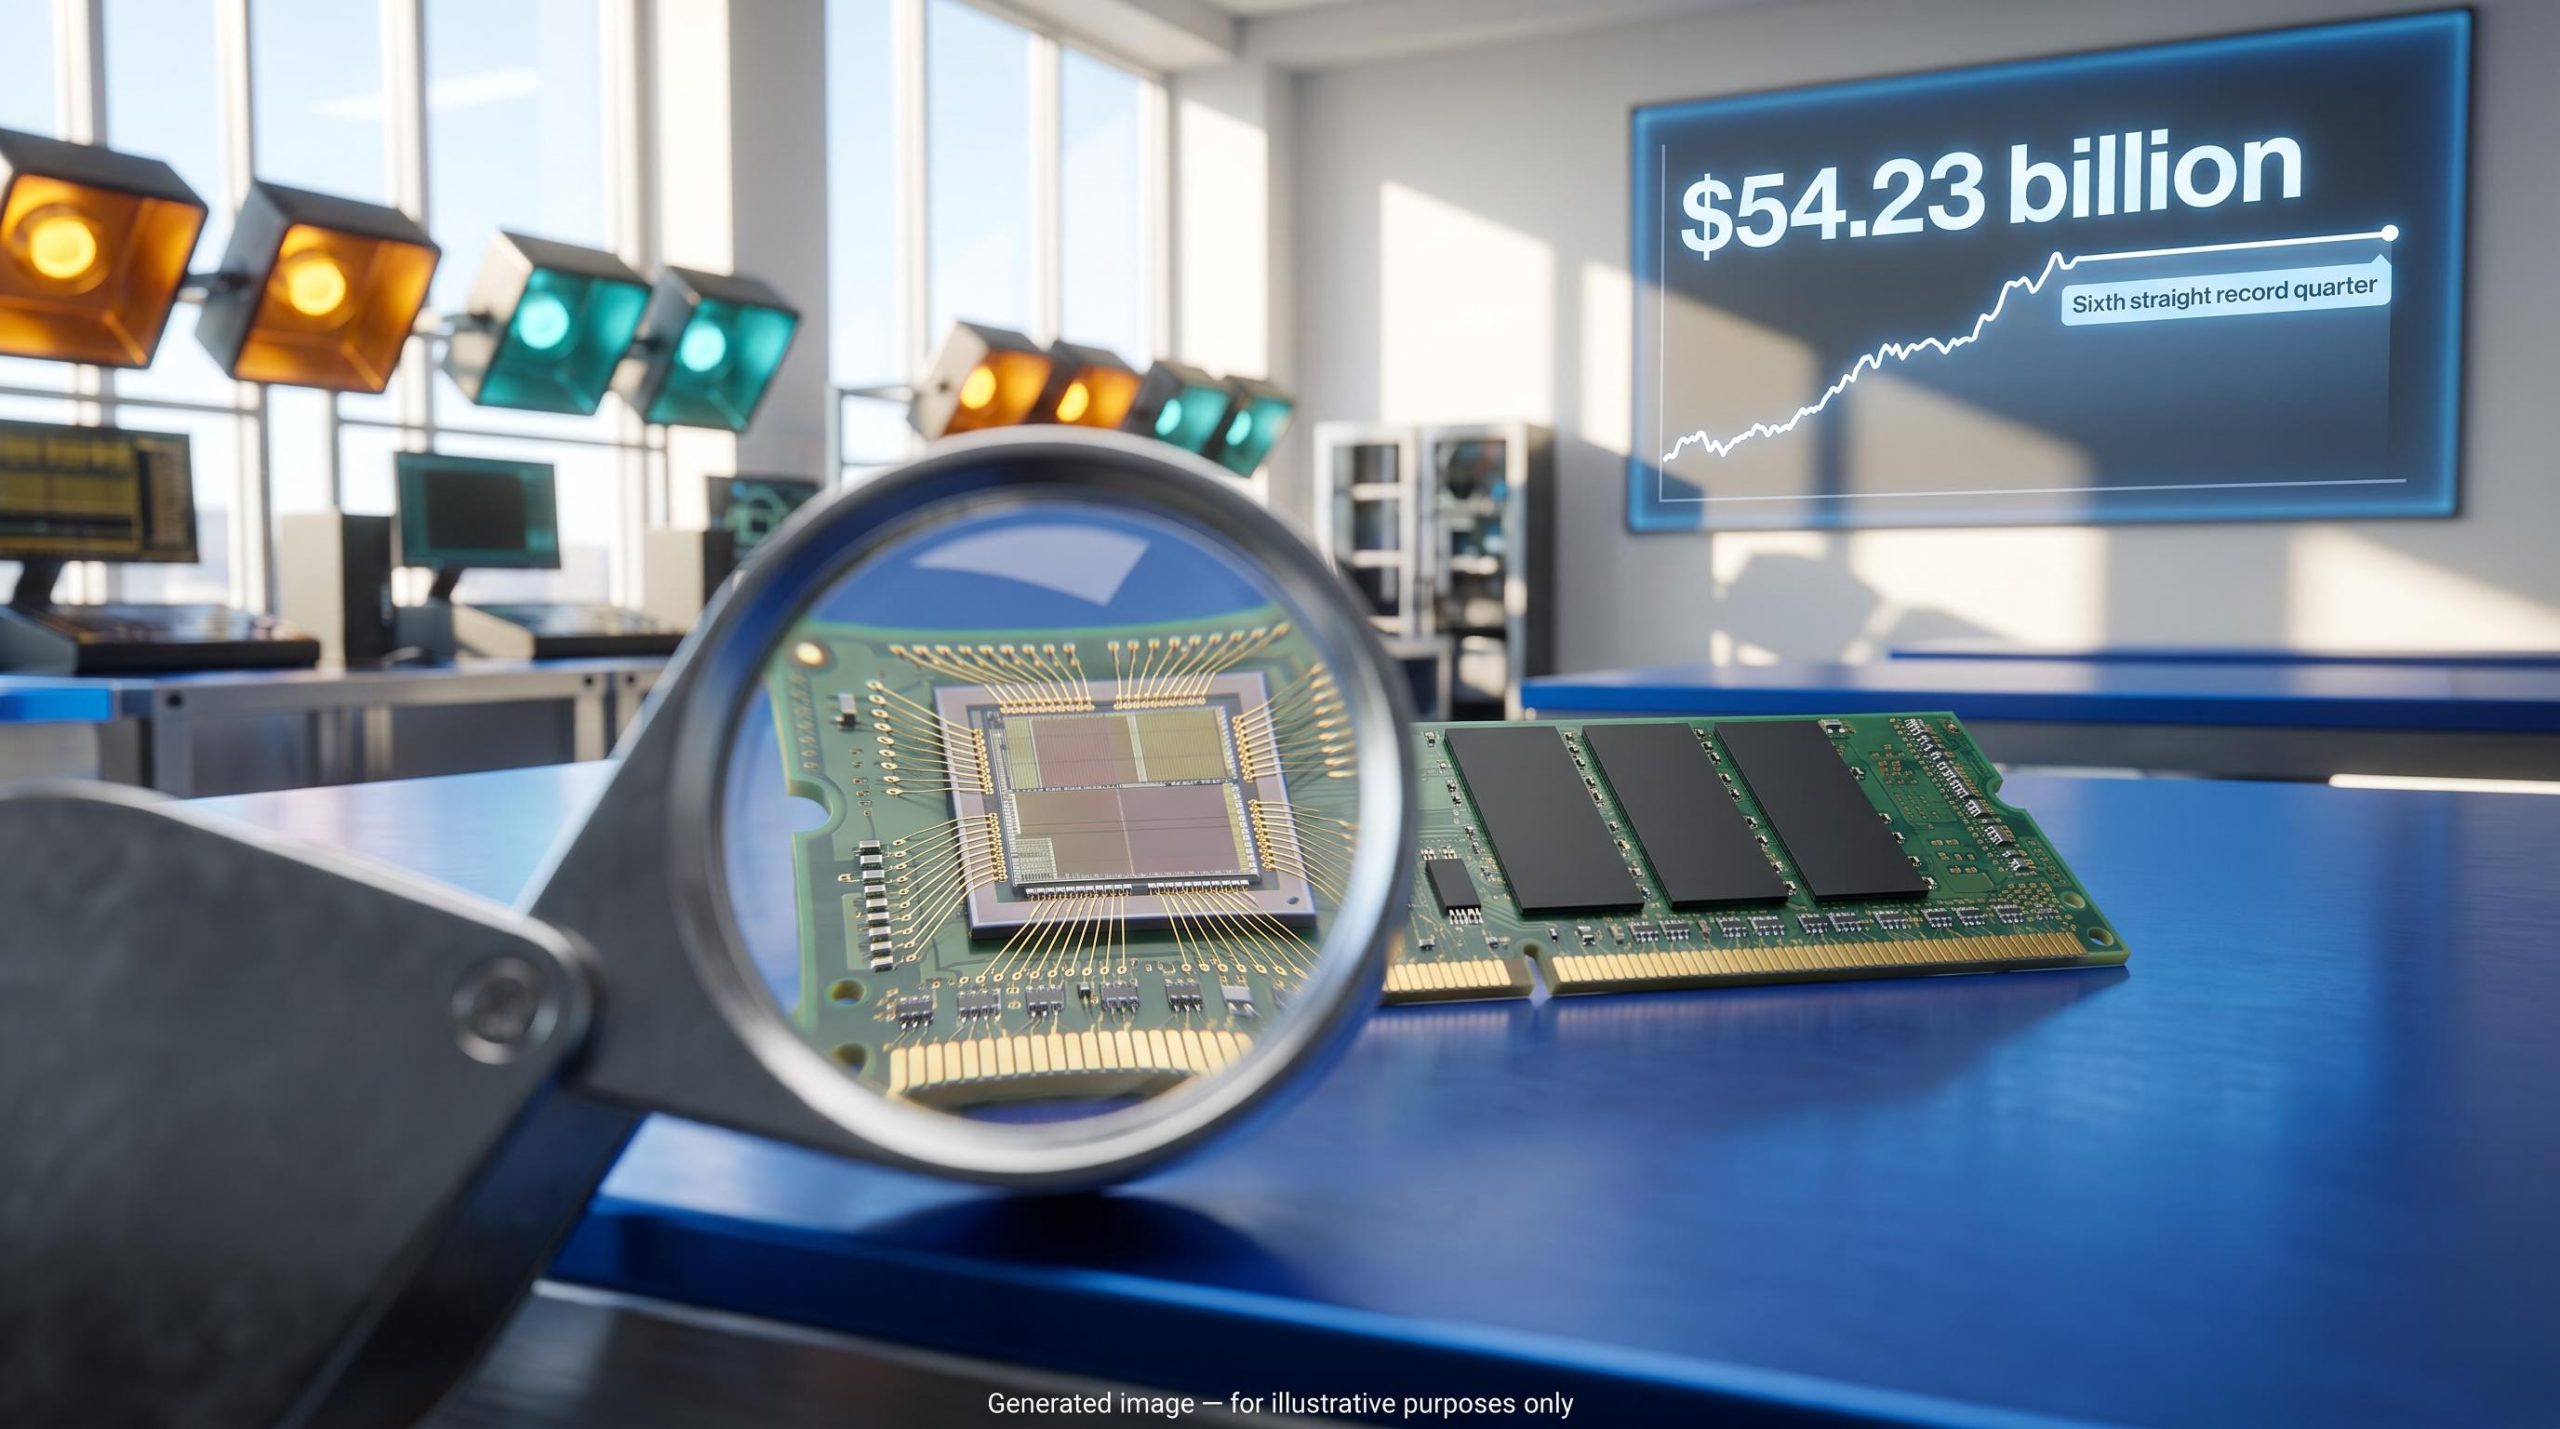
Micron stock analysis: Micron posted revenue of $54.23 billion, up 379% from a year earlier, with an 87% gross margin and guidance roughly 8% above consensus, and the stock barely moved. When great news fails to lift a share price, what does the market know that the headline does not? That question sits at the centre of any serious Micron stock analysis right now.
This was the sixth straight record quarter. After the prior report, shares hit a record close of $1,213 and then fell about 20%, leaving the stock roughly 12.5% below that high today.
Within days, five large bullish options trades worth about $10.57 million in premium appeared. Investor Michael Burry placed the opposite bet.
Here is a way to weigh the bull and bear cases, plus a practical method for reading earnings reactions and options flow without over-trusting either.
Why did Micron stall after a blowout quarter?
Revenue of $54.23 billion, GAAP earnings per share (EPS) of $32.87 ($33.42 non-GAAP), an operating margin of 82.3%. By any measure, Micron delivered. The stock still closed near $1,065-$1,066 before the report and traded in a narrow band afterwards.
What the numbers said
Sources cite different consensus figures. LSEG, via CNBC and Yahoo Finance, put expectations at about $51.07 billion and $31.61 EPS, while Investing.com cited about $50.45 billion and $31.16.
| Metric | Actual or guide | Consensus | Difference |
|---|---|---|---|
| Q4 revenue | $54.23B | $50.45B-$51.07B (varies by source) | Beat on both sets |
| Q4 adjusted EPS | $33.42 | $31.16-$31.61 | Beat on both sets |
| Q1 FY2027 revenue guide | $61.5B | About $57B | About 8% above |
| Q1 FY2027 adjusted EPS guide | $38.15 | About $35.14-$35.40 | Above street |
The guidance matters more than the quarter just reported. A forecast this far above the street shows management expects demand to keep accelerating.
Why the price did not follow
Shares slipped in after-hours trading, with one report citing a dip to around $1,040, before trading near $1,083 afterwards. The range reflects different timestamps.
The documented reason is investor concern over heavy capital spending (capex), which hit $10.77 billion in the quarter, set against the outlook. Other mechanisms are general market behaviour, not Micron statements:
- Heavy capex against the outlook: documented in coverage of the reaction.
- Expectations already priced in: general market behaviour after prior rallies.
- Cyclicality fears: general market behaviour; memory has a history of peaks and reversals.
- Crowded positioning: general market behaviour; heavy call buying leaves few new buyers.
The prior-quarter pattern After a 24% beat with record margins, Micron hit a record close of $1,213, then fell about 20% the following week.
One presenter in the source material compared the pattern to Nvidia, whose repeated beats eventually stopped impressing investors. That is opinion, not fact.
What this tells you is that the market trades on the change in expectations, not the quality of results. A record quarter is not by itself a buy signal.
The beat landed inside the options market’s implied move of roughly $75, which helps explain why a record quarter produced such a flat tape once positioning and expectations are accounted for.
When big ASX news breaks, our subscribers know first
What do five bullish options trades actually tell you?
The headline figure is hard to ignore: about $10.57 million in premium, the price paid for options contracts, across five trades on the Friday after earnings. Four were calls bought at the ask (the price sellers are asking, which suggests urgency to buy). One was a put sold at the bid, which is also bullish, because the seller keeps the credit as long as the stock stays above the strike.
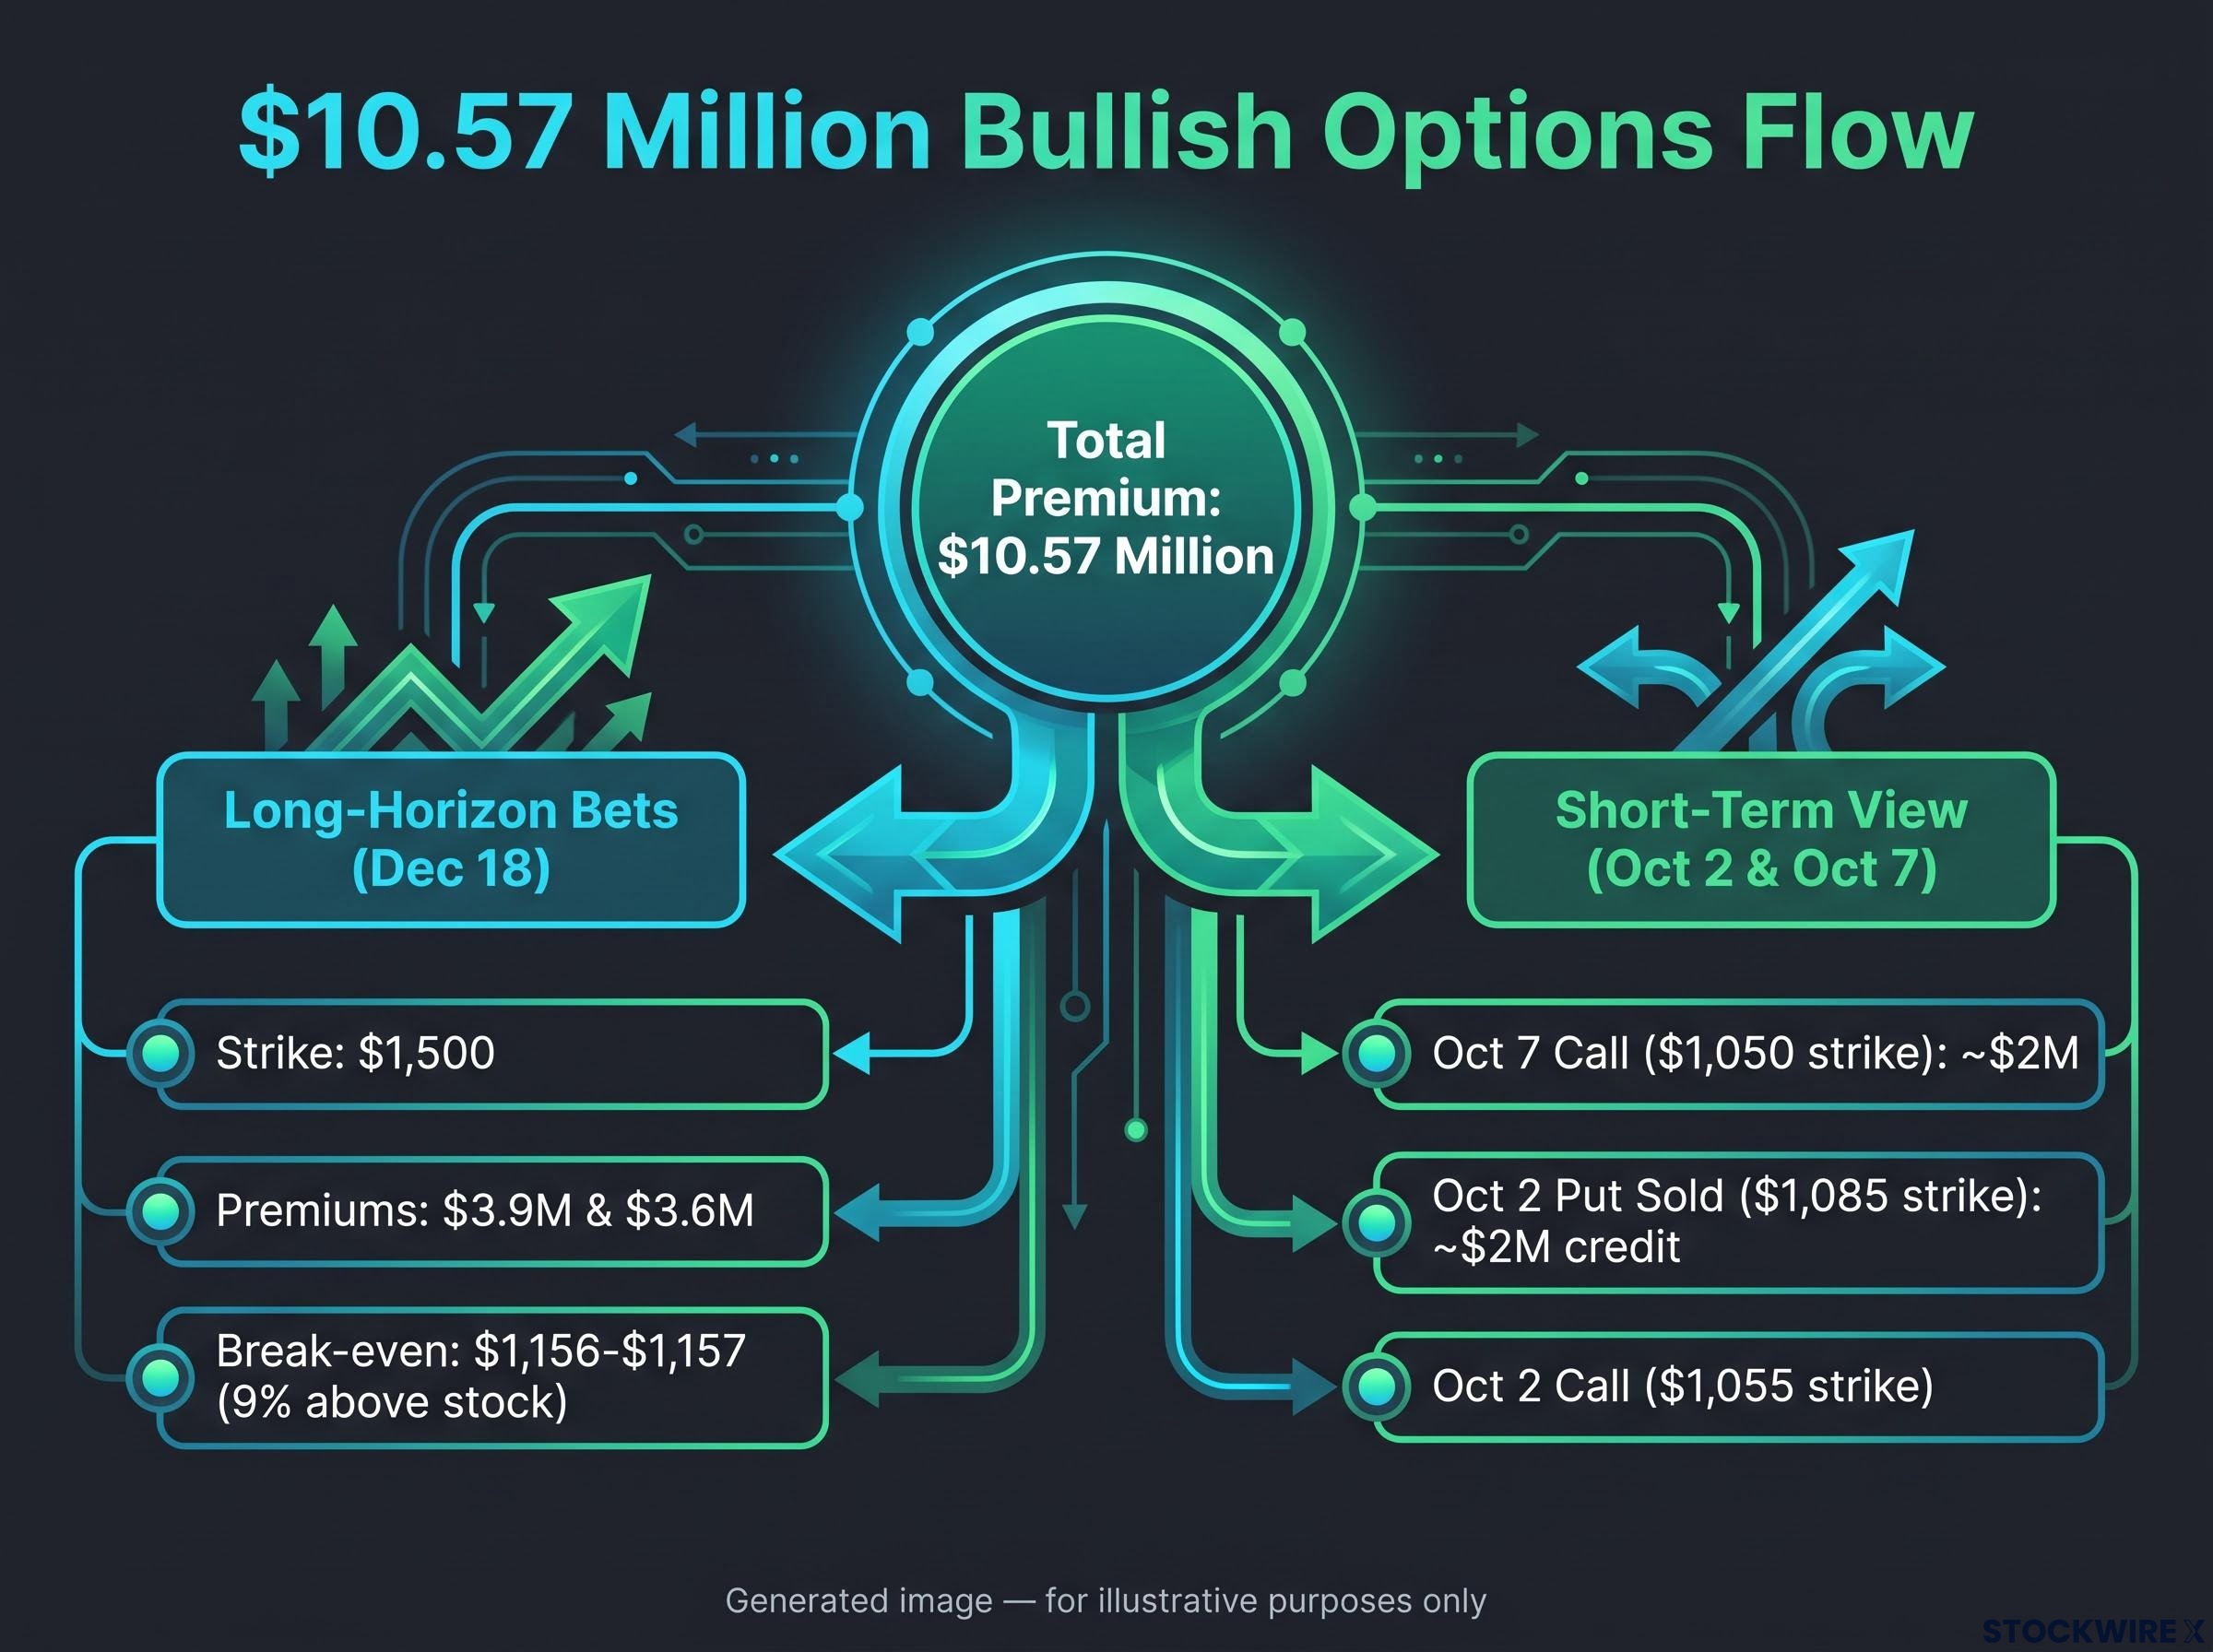
The flow splits into two bets. Two December 18 orders at the $1,500 strike, one a sweep (an order split across exchanges to fill quickly) and one a split trade, cost about $3.9 million and $3.6 million. Together they made up about 71% of the day’s premium, with 77-78 days to expiration.
| Trade | Strike and expiry | Approx. premium | What it implies |
|---|---|---|---|
| Calls (sweep and split) | $1,500, December 18 | $3.9M and $3.6M | Long-horizon bet that fundamentals reach the price |
| Calls bought | $1,055, October 2 | Not specified | Short-term bet the reaction was too pessimistic |
| Calls bought | $1,050, October 7 | About $2M | Same short-term view |
| Put sold | $1,085, October 2 | About $2M credit | Bullish if shares hold above $1,085 |
The December calls break even around $1,156-$1,157, about 9% above the stock. That strike choice says more than the dollar total: these buyers need a real rally, and they gave it time.
The backdrop helped. Semiconductors were strong, the Nasdaq was up over 1%, and the VanEck Semiconductor ETF (SMH) was back above 630. Broader trackers showed call premium at 76% of the total and open interest above 710,000 contracts.
A caution on options flow Options flow is noisy. Large trades are often hedges or relative-value structures rather than pure directional views.
For you, this shows where some large players see value. A handful of trades cannot tell you whether they are outright bets or one leg of a hedge.
For readers wanting to go deeper on flow, our dedicated guide to reading unusual options activity shows how to tell genuine institutional conviction from hedges using strike ladders and expiry timing.
Is the AI memory boom structural or cyclical?
Both cases are strong, which is why the stock is stuck.
The structural case
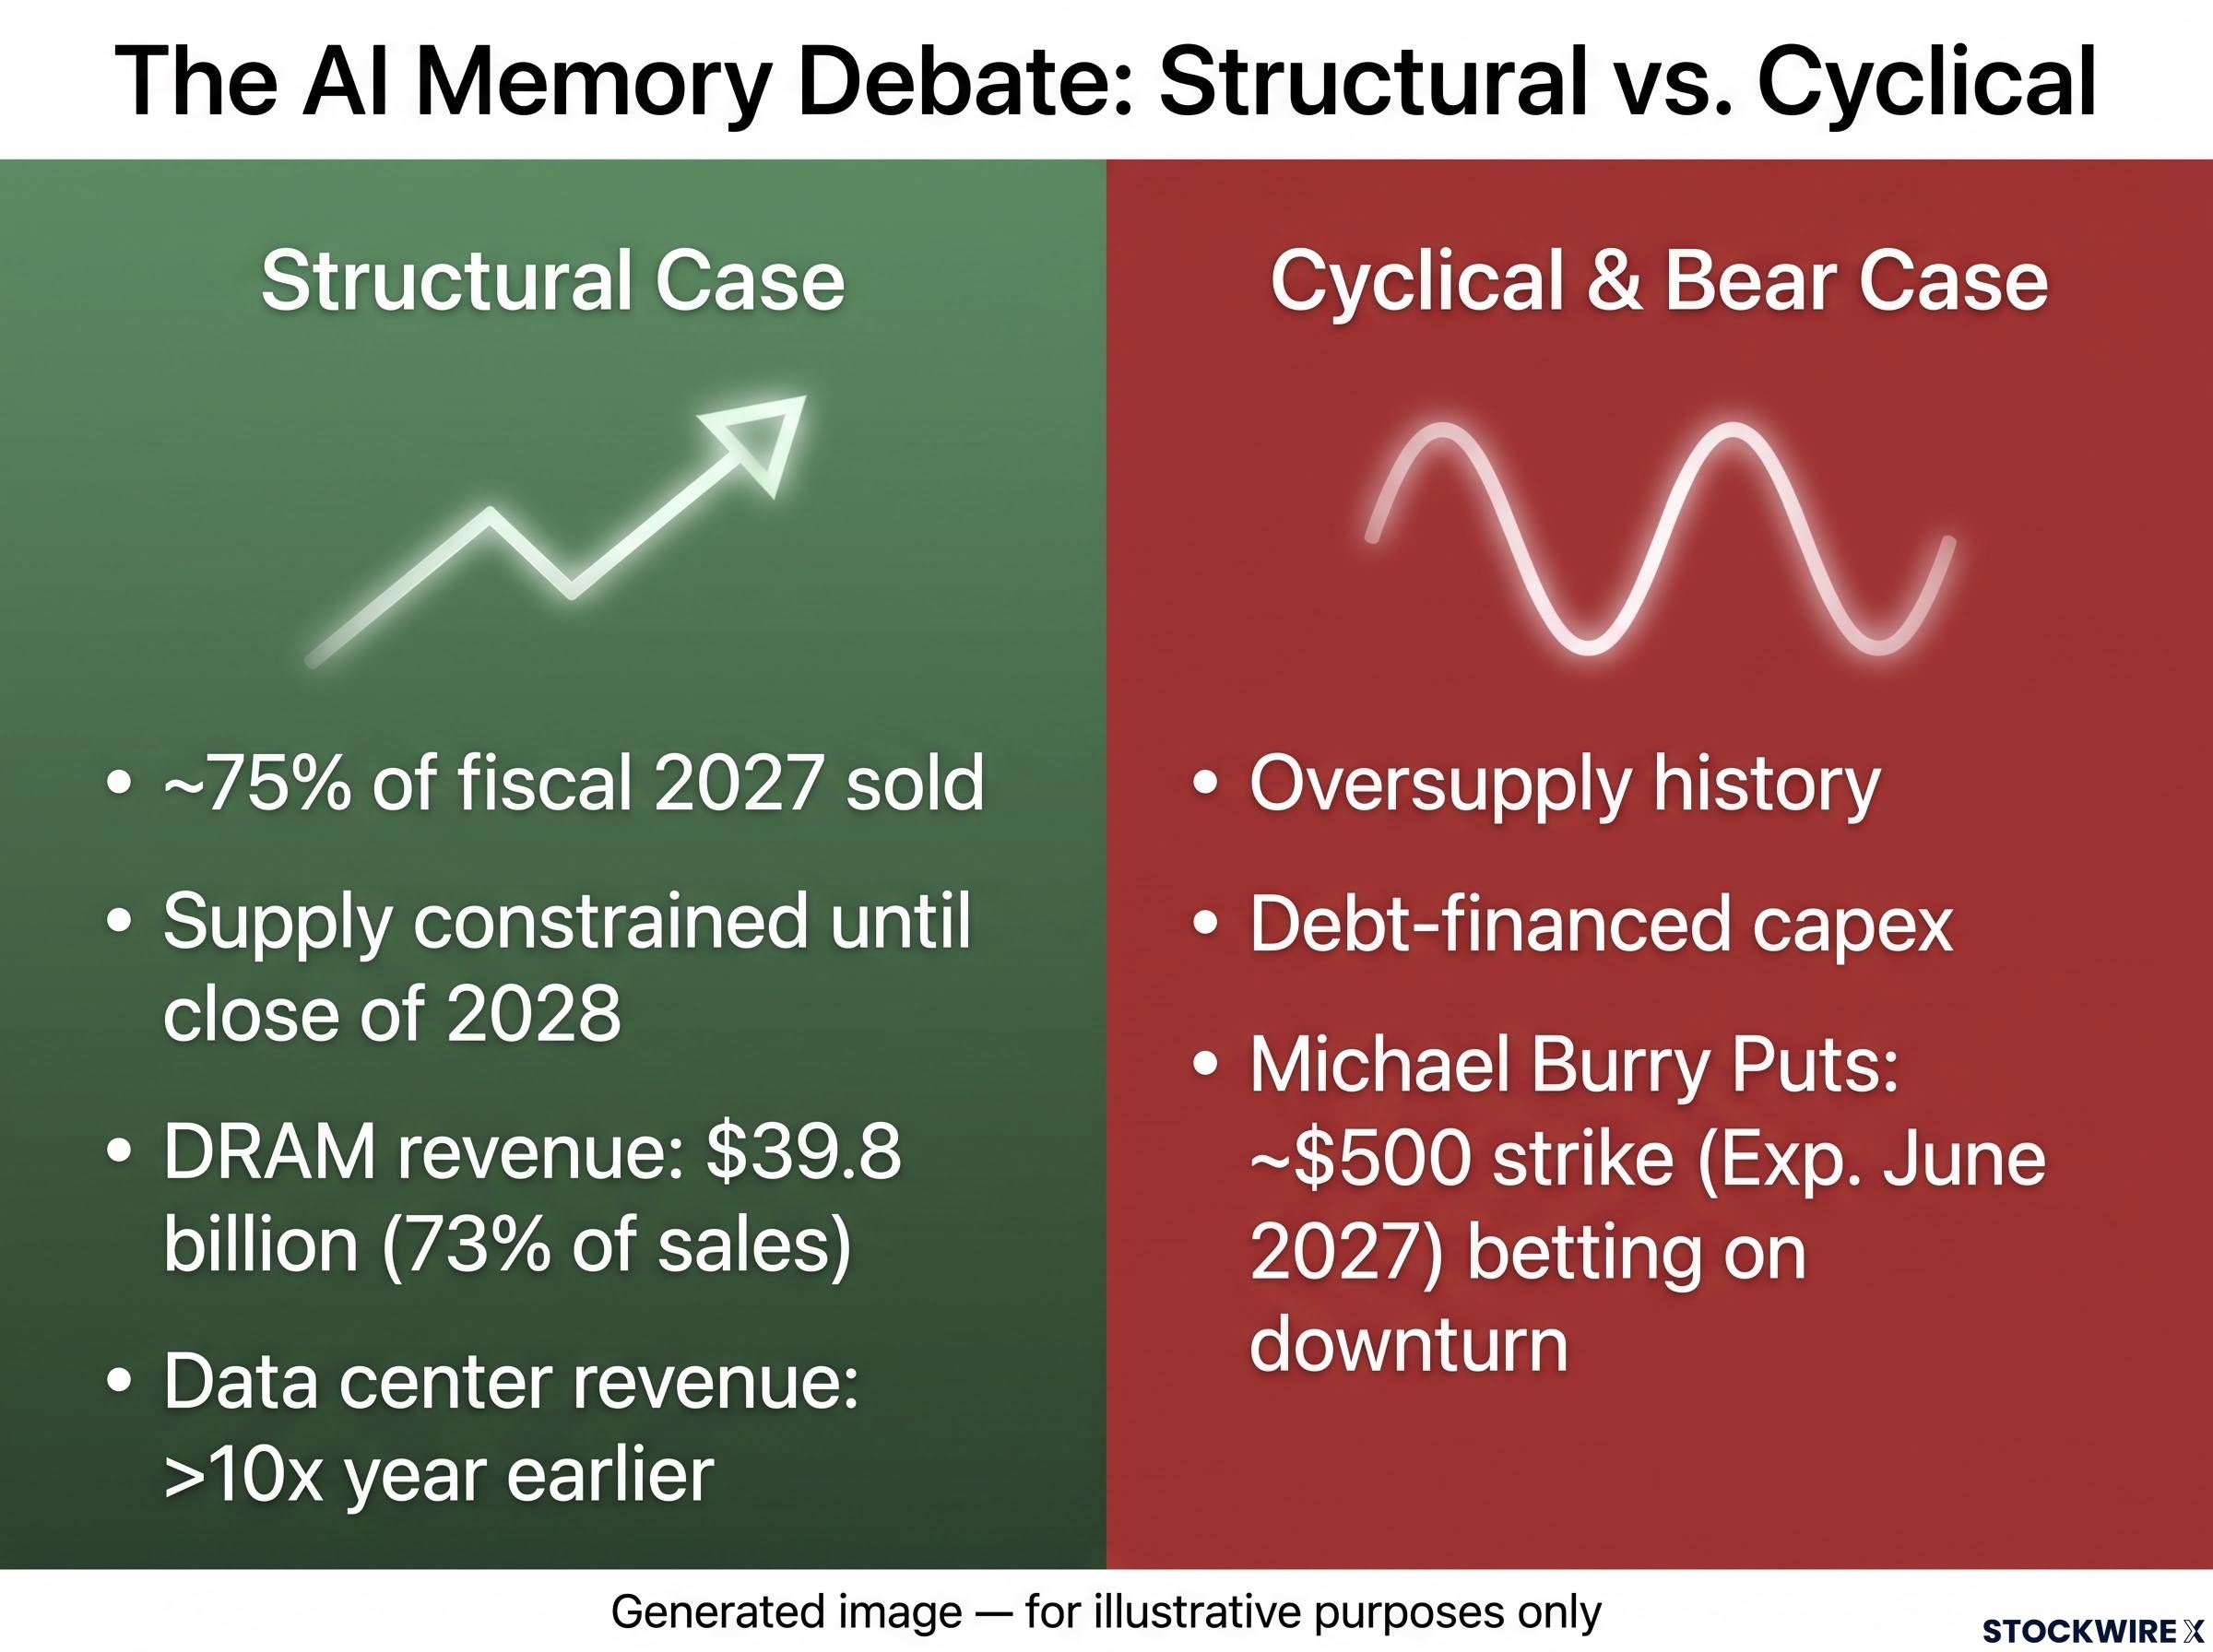
According to management summaries, roughly 75% of what Micron will make in fiscal 2027 has already been sold, with buyers now haggling over their 2028 supply. Next year’s high-bandwidth memory (HBM), the stacked chips AI servers rely on, is mostly under contract at markedly higher prices, and management expects supply to stay constrained until the close of 2028.
The numbers back the story: data center revenue is more than ten times a year earlier, and DRAM revenue reached $39.8 billion, or 73% of sales. Micron is now resisting price concessions on long-term agreements, a reversal from the period after the late-2010s crypto bust, when customers declined such deals.
One presenter argues that compute is being treated like energy or national security policy, which would support lasting demand. That is opinion, not management commentary.
The cyclical case
Memory has a long record of oversupply after high-price periods. Capacity expansion by Micron, Samsung and SK Hynix could overshoot demand, and customer concentration and capex intensity add risk.
Burry’s long-dated puts
Burry moved from shorting the stock to buying puts with a strike near $500, expiring June 2027 (some reports say September 2027). The conversion caps his risk while keeping the bet on a downturn.
“More confident than ever” in an AI-related downturn within about a year, Burry said, according to his Substack as relayed by Crypto Briefing and Motley Fool.
Bank of America has pushed back on the semiconductor bubble narrative, citing 20%-plus earnings revisions and positioning at about half the 2017 peak, a view that sits against Burry’s more cautious stance.
| Case | Evidence and key risk | What would change the view |
|---|---|---|
| Structural | Pre-sold supply, **87%** margin; risk is demand digestion | Signs of weaker 2028 allocations |
| Cyclical | Oversupply history, debt-financed capex; risk is being early | Rival capacity additions outpacing demand |
No named sell-side analyst debate turned up in the research. You should read the stalled price as the market pricing a real disagreement about durability, not a verdict that the quarter was weak.
How to read earnings reactions and options flow without fooling yourself
Reading options flow
Premium size is not conviction. A $3.9 million order tells you money moved, not why.
Check the order type, strike and expiry. Then ask whether the trade could be a hedge. For the December calls, a $1,500 strike with a break-even about 9% above spot means the buyer needs a sizeable rally.
Reading the reaction
Large beats in AI-linked names, such as Nvidia in 2023-2024 and earlier Micron cycles, often drew muted or negative immediate reactions. The presenter claims that after past Micron post-earnings selloffs the stock was usually higher 3, 6 and 12 months later, with June a recent exception. Precise return statistics were not found, so treat that as unverified.
Here is a five-step checklist for the next print:
- Compare the result and guide against more than one consensus figure.
- Judge the price reaction against how far the stock had already run.
- Identify each options trade’s type (ask, bid, sweep) and whether it may be a hedge.
- Check the strike and expiry against the break-even.
- Note the timestamp, since figures here ranged from $1,040 to $1,083.
The risks to keep in view:
- Oversupply from Micron and rivals
- Customer concentration among a few hyperscalers
- Capex intensity weighing on free cash flow
- Demand digestion and macro risk
- Options-flow ambiguity
- Saturated expectations
Treat any single options print or earnings reaction as one input, weighed against positioning, expectations and cycle stage.
What the muted reaction changes, and what it leaves open
The results were exceptional, the price signal ambiguous, the options flow leaned bullish, and Burry’s puts point the other way. None of these settles the debate.
Watch five variables: next quarter’s delivery against the $61.5 billion guide, progress on 2028 allocations, the capex trajectory, any supply additions from rivals, and the December options horizon.
Weigh the evidence rather than following any single signal. Past performance does not guarantee future results, and these statements are speculative and subject to change with market developments.
This article is for informational purposes only and should not be considered financial advice. Investors should conduct their own research and consult with financial professionals before making investment decisions.
—