
Gold has seen significant gains since early 2024, yet as of Friday morning it sits in a technical no-man’s-land, unable to break higher and unwilling to collapse, waiting for a single number to decide its next move.
The September Non-Farm Payrolls report drops at 8:30 a.m. ET today. What the labour market reveals in the next few hours flows directly into Federal Reserve rate expectations, Treasury yields, and the US Dollar, the three transmission channels that push the gold price in either direction.
With consensus sitting at roughly 90,000 new jobs and the probability of an October Fed rate hike already down to below 40% after last week’s soft inflation reading, the setup is genuinely binary: a strong number revives tightening fears, a weak one removes them. This piece maps the exact technical levels that define each outcome, explains the mechanics connecting payrolls data to gold pricing, and gives you a framework for trading the market’s reaction rather than guessing the headline.
Where gold stands technically before the number lands
Gold is pressed up against the upper edge of its recent range, and the chart tells two stories at once. The metal is trading beneath every major daily simple moving average (SMA), which is a bearish near-term signal. At the same time, the long-term structural bid that has carried gold through its multi-year climb remains firmly intact.
That tension is the whole point. The market has compressed into a tight band, and the payrolls print is the catalyst that resolves it. The space between support near $4,100 and the moving average wall near $4,325 is narrow enough that a decisive move in either direction implies a significant run, not a drift.
Support levels and the $4,000 floor
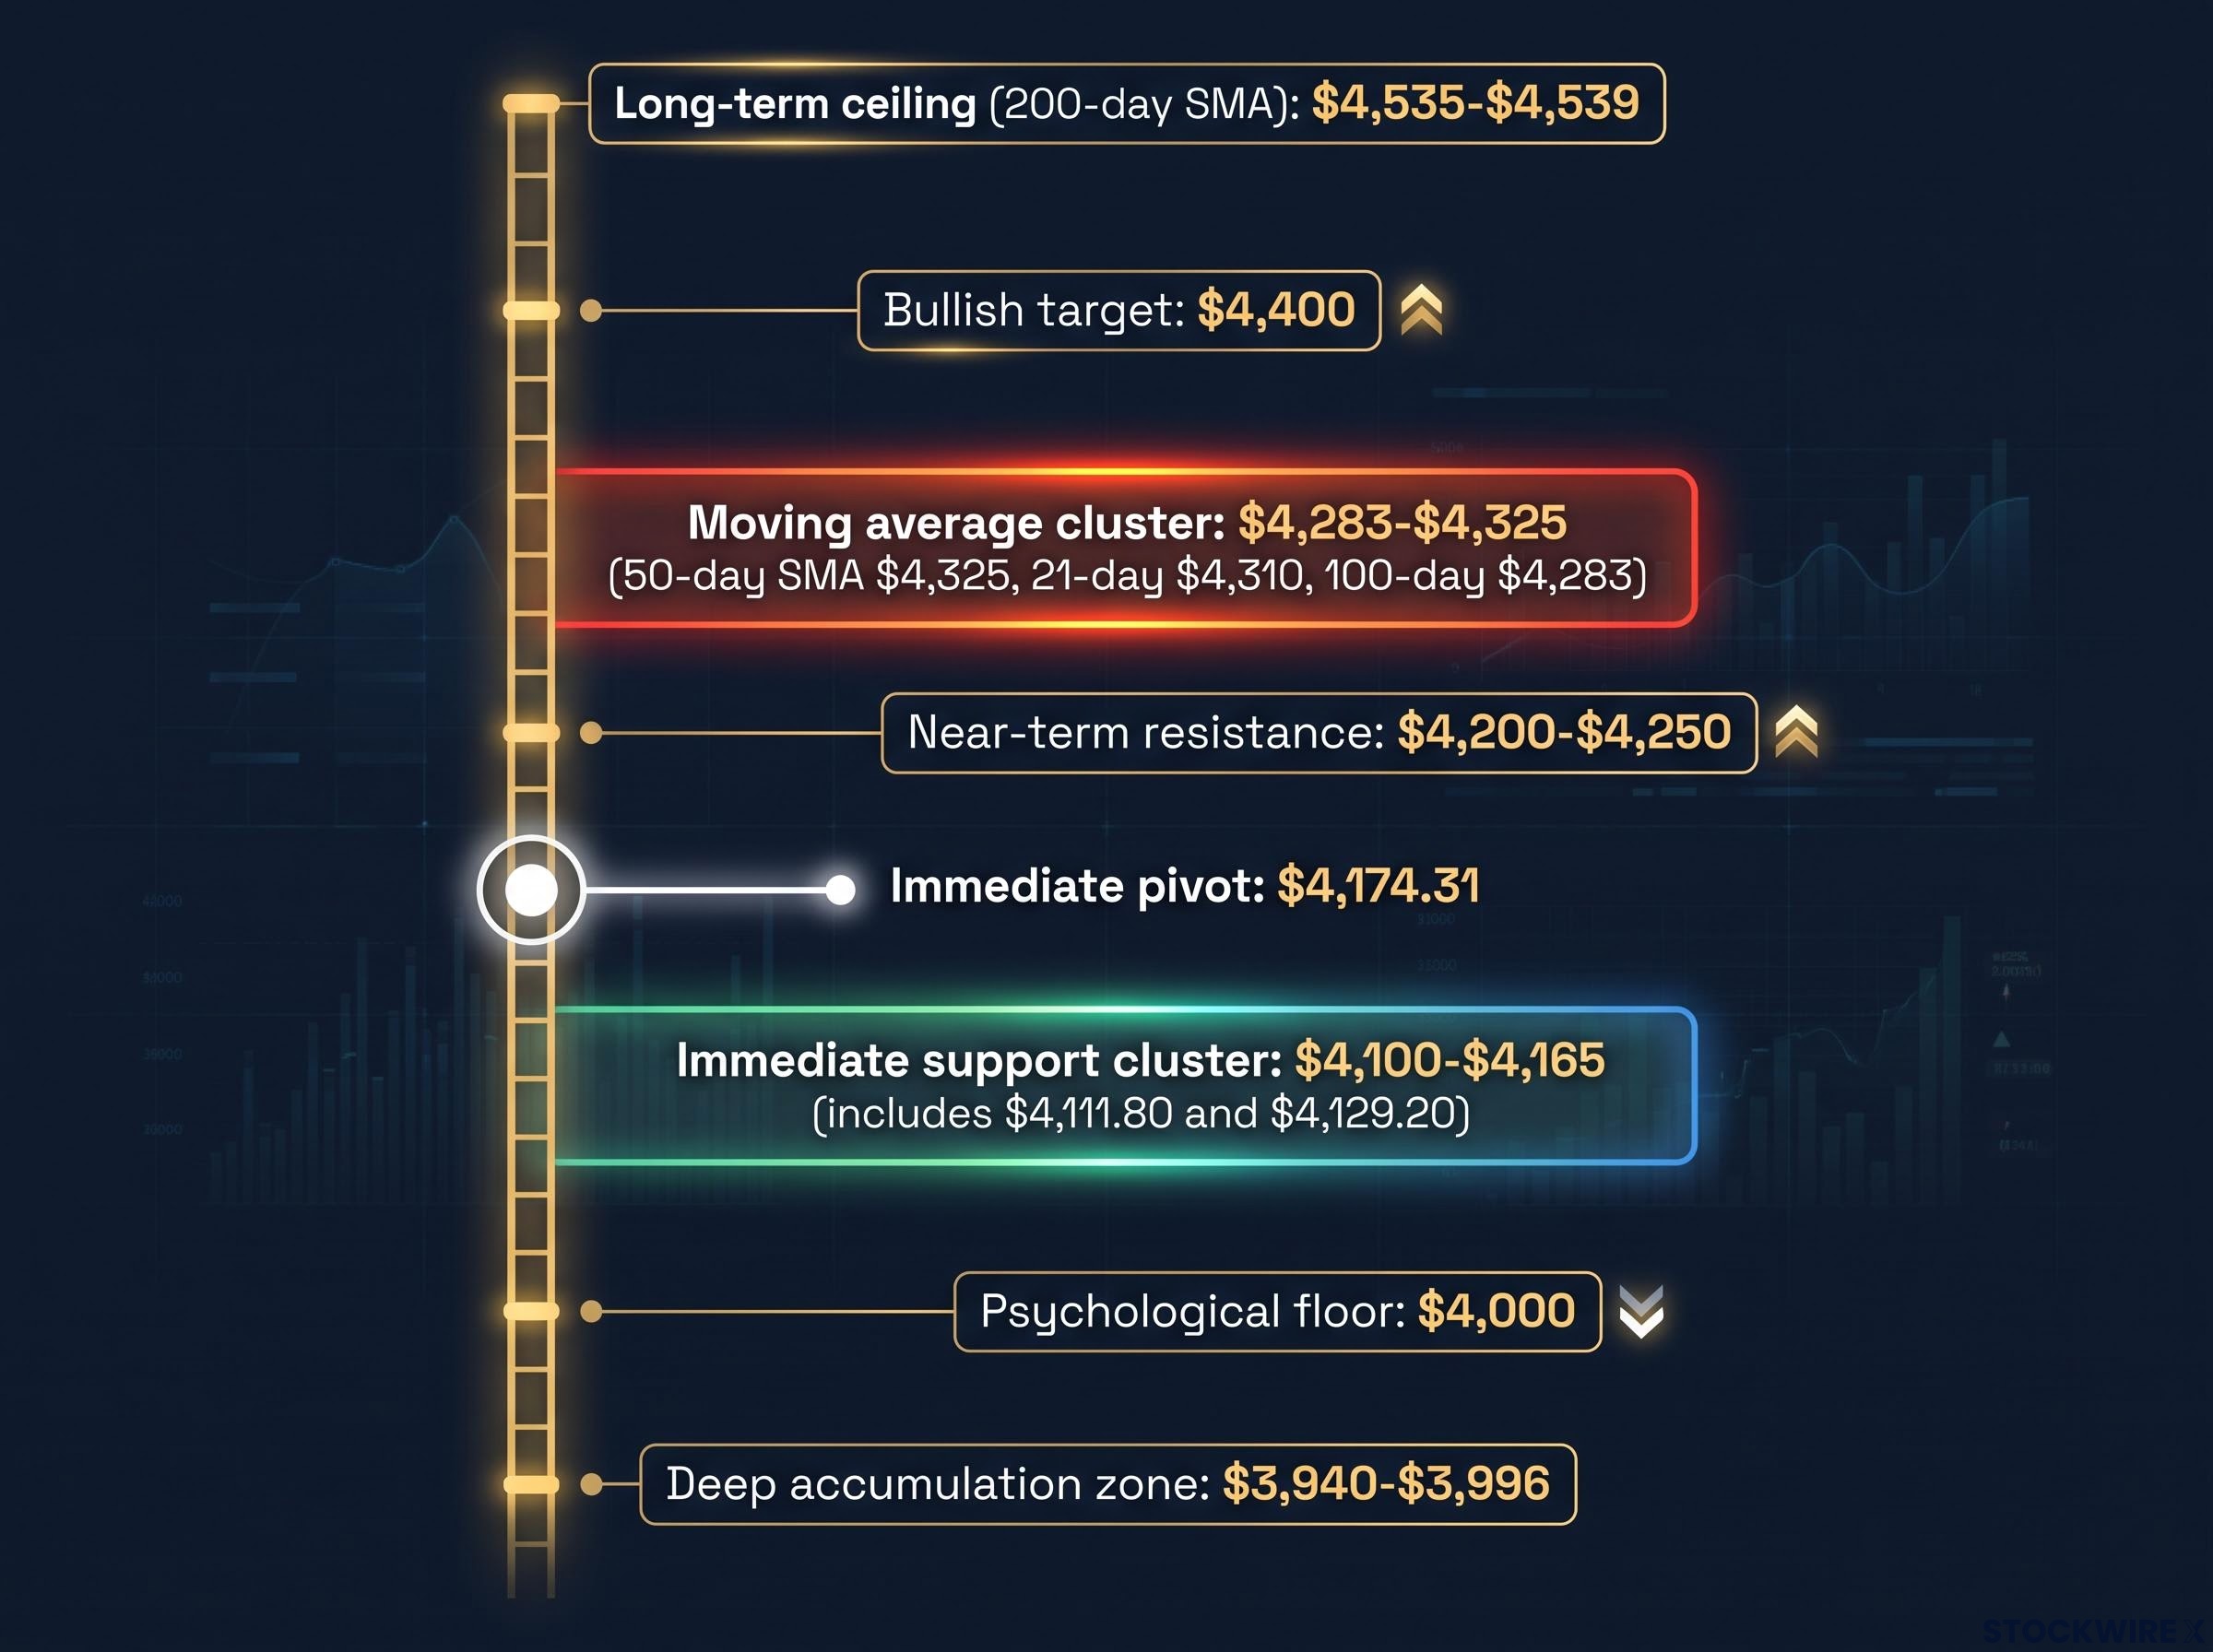
Immediate support clusters between $4,100 and $4,165, with specific technical floors identified at $4,111.80 and $4,129.20. As long as gold holds this zone, the downside stays contained.
A clean break below $4,100 changes the picture entirely. It would signal to market participants that buyers have stepped back, opening a direct path to the $4,000 psychological floor.
Below that sits the deep accumulation zone between $3,940 and $3,996, a band of Fibonacci and swing-bottom support. This is where long-term investors and hedgers have historically stepped in aggressively on dips, making it the realistic maximum downside in any severe sell-off.
The resistance stack gold must clear
On the way up, the first hurdle is the $4,200-$4,250 band, a former support zone that has flipped to resistance, with an immediate pivot level near $4,174.31.
The more consequential barrier is the moving average cluster between $4,283 and $4,325. This zone stacks the 100-day SMA near $4,283, the 21-day SMA near $4,310, and the 50-day SMA near $4,325. A sustained break above it would meaningfully flip the near-term technical outlook in the bulls’ favour.
Beyond that, the 200-day SMA near $4,535-$4,539 stands as the macro-level ceiling for the bullish scenario.
| Level / Zone | Price |
|---|---|
| Deep accumulation zone | $3,940-$3,996 |
| Psychological floor | $4,000 |
| Immediate support cluster | $4,100-$4,165 |
| Immediate pivot | $4,174.31 |
| Near-term resistance (flipped support) | $4,200-$4,250 |
| Critical moving average cluster | $4,283-$4,325 |
| Long-term ceiling (200-day SMA) | $4,535-$4,539 |
Knowing where these lines sit before the number drops is the difference between reacting strategically and reacting emotionally. You have the map before the terrain shifts.
When big ASX news breaks, our subscribers know first
Why today’s jobs number has this much power over a commodity
Gold pays no interest and generates no cash flow, so its appeal rises and falls with the opportunity cost of holding it. That cost is set by one chain of events, and the payrolls report is the first link.
Here is how the mechanism works. A strong jobs number tells the Fed the economy can absorb tighter policy, which lifts the probability of another rate hike. Higher rate expectations push Treasury yields up and strengthen the US Dollar. Both make a non-yielding asset like gold less attractive, so gold falls. A weak number runs the chain in reverse.
The current policy backdrop makes this release unusually loaded. The Federal Reserve delivered a 25-basis-point rate hike in September, lifting the target range to 3.75%-4.00%, and signalled a restrictive path ahead. Then the inflation data softened.
The FOMC September 2026 statement confirmed the 25-basis-point hike to 3.75%-4.00% and signalled a restrictive path ahead, giving the labour market data an outsized role in determining whether the committee moves again in October.
The pivot that set up today Core Personal Consumption Expenditure (PCE), the Fed’s preferred inflation gauge, rose 3.0% year-over-year against a 3.3% consensus. Following that release, the probability of an October rate hike dropped from above 70% at the start of the week to below 40%, according to the CME Group’s FedWatch Tool.
That leaves the NFP as the deciding variable. The Fed does not just read the headline job count; it scrutinises the composition of the report. Three components carry independent weight:
The NFP report composition matters far more than the headline count: average hourly earnings can move markets sharply even when jobs additions land near consensus, and revisions to the prior two months routinely reshape the narrative within minutes of the release.
- Headline job additions, consensus around 90,000
- Labour-force participation and the unemployment rate, expected to hold at 4.1%
- Average hours worked and wage growth, projected at +0.3% month-over-month
Fed official Kevin Warsh has pointed to rising job openings and working hours as evidence of resilient labour conditions, which is exactly the kind of strength a strong print would reinforce.
There is a counter-intuitive wrinkle worth holding onto. Gold can rise on a strong headline if the detail shows softer wages, because what ultimately matters to gold is real yields, not the raw jobs figure. For that reason, the most useful thing you can do when the data hits is not read the headline. Track the October hike probability on the FedWatch tool in real time; that number is where the market’s actual verdict shows up.
The two scenarios traders are pricing in right now
The compression in gold’s chart means two clean outcomes are on the table, and each maps to a specific price target with its own confirming signals. Before you sit down with the data at 8:30 a.m., build the decision tree.
Scenario one: strong jobs, hawkish repricing, gold under pressure
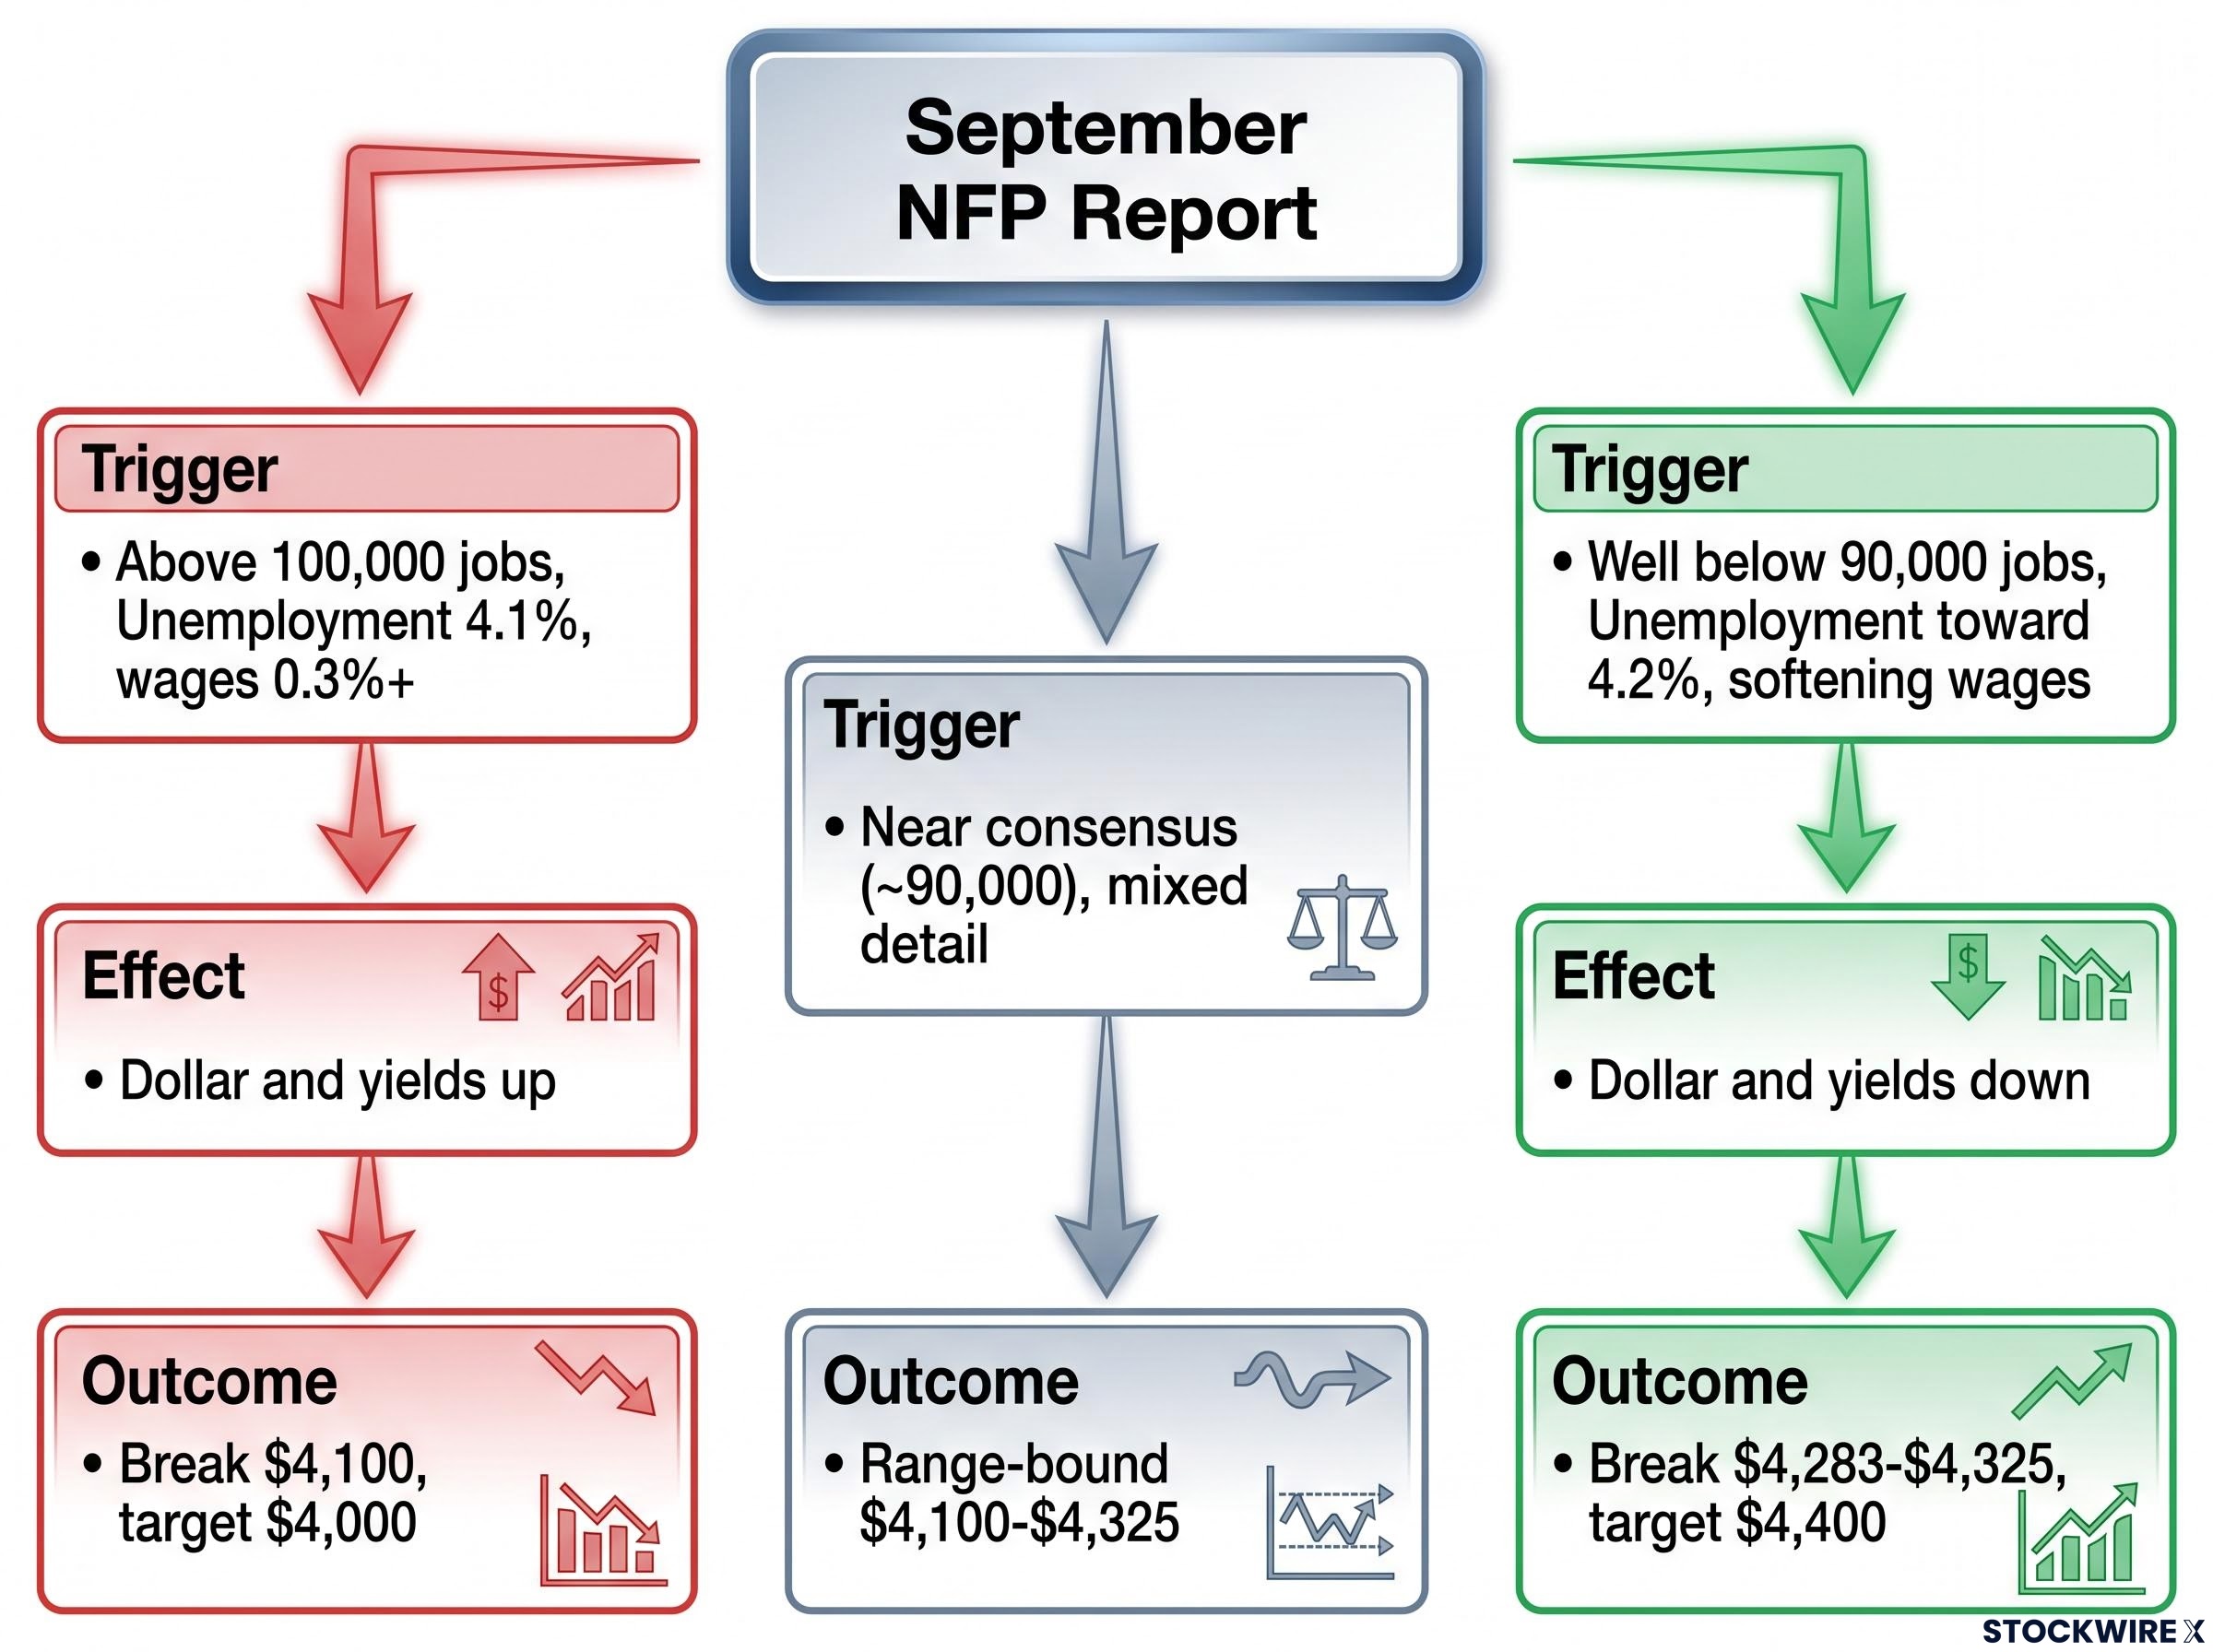
The bearish case triggers on payrolls significantly above 100,000, with unemployment steady near 4.1% and wages firm at 0.3% or higher month-over-month.
That combination proves labour market resilience and revives expectations for an October hike. Yields climb, the Dollar strengthens, and the opportunity cost of holding gold rises. The technical confirmation is a break beneath $4,100, which opens the door to the $4,000 target, with the $3,940-$3,996 accumulation zone as the maximum downside.
The August NFP blowout and gold selloff, in which a 162,000 print against a 56,000 consensus drove gold down more than 2% within minutes as the 10-year yield hit 4.81%, is the most recent real-world test of exactly the bearish scenario mapped here.
Scenario two: labour market softness, rate cut expectations return, gold breaks higher
The bullish case triggers on payrolls well below the 90,000 forecast range, with unemployment climbing toward 4.2% and wage growth softening.
Broad-based weakness drains rate-hike expectations, pulling yields and the Dollar lower and handing gold its catalyst. The confirming signal is a convincing breakout above the $4,283-$4,325 resistance band, which would establish buyer control and set sights on the $4,400 target, with $4,535 as the longer-dated ceiling.
Between these two sits the soft-landing middle ground, where the labour market decelerates but does not deteriorate. In that case neither trigger fires cleanly and gold stays range-bound, grinding between support and resistance until a later catalyst breaks the deadlock.
| Scenario | NFP Trigger | Confirming Signals | Technical Target |
|---|---|---|---|
| Bearish | Above 100,000 | Unemployment 4.1%, wages 0.3%+, Dollar and yields up | Break $4,100, target $4,000 |
| Bullish | Well below 90,000 | Unemployment toward 4.2%, softening wages, Dollar and yields down | Break $4,283-$4,325, target $4,400 |
| Soft landing | Near consensus, mixed detail | No clean directional read | Range-bound $4,100-$4,325 |
One caution from the historical record: significant revisions to prior months often carry more sustained directional weight than the initial print. Your three-variable checklist before the data lands is the jobs count, the unemployment rate, and the direction of wage growth.
Trading the reaction, not the number
The single most useful discipline around a payrolls release is also the hardest to follow: do not chase the initial spike. Gold’s knee-jerk move often fades as the market digests the full report, and the first candle frequently points the wrong way.
The core principle Trade the market’s reaction to the data, not the data itself.
What validates a genuine directional move is alignment across three signals. The Dollar, Treasury yields, and gold’s position relative to its key technical levels all have to agree before a position is justified. Work through them in order.
- Dollar Index direction. Strengthening supports the bearish case; weakening supports the bullish case.
- Treasury yield direction. Rising 10-year yields confirm bearish pressure; falling yields confirm bullish momentum.
- Gold’s level confirmation. For the bearish read, watch gold fail to reclaim the $4,174 pivot on any bounce. For the bullish read, watch gold close above $4,250 on the first hourly candle after the data.
There are also data quirks that can produce a misleading first impression. TD Securities has cautioned that seasonal distortions, particularly government hiring and gains in sectors such as healthcare, leisure, and hospitality, can skew the headline figure. Analysts have separately warned against over-reading early proxies like the ADP private-payrolls and Challenger layoff reports, which have diverged from the official BLS numbers.
This is why composition matters more than the headline. The Fed looks past the top-line count to participation and hours worked, and so should you.
For anyone considering a position today, the practical takeaway is that the initial spike after the release is the least reliable window. The tradeable signal emerges once the spike settles and the Dollar, yields, and price action start telling the same story. Waiting for that confirmation is not hesitation; it is the edge that separates systematic traders from those reacting to noise.
What the jobs report changes, and what it does not
Whatever the 8:30 print delivers, it is a short-term volatility catalyst inside a long-term bull structure, not the thing that made the structure. Gold has seen substantial gains since early 2024 on forces that sit well above any single data release: persistent geopolitical demand, sustained central-bank accumulation, and sensitivity to real yields.
The current backdrop supports that durability. Economists view the labour market as slowing but still solid, a soft-landing setting that lets the Fed hold or move gradually rather than pivot sharply, while structural demand limits severe downside.
Three technical signposts will define the next phase regardless of today’s outcome: the $4,000 floor that long-term buyers have historically defended, the $4,283-$4,325 moving average band that gates any fresh upside, and the $4,535 long-term ceiling that marks the bull case destination.
The 200-day SMA as a regime signal carries particularly high analytical weight when Fibonacci retracement levels and prior breakout structure converge at the same price point, a condition that applied at $4,527 in late August and that frames why the $4,535-$4,539 ceiling in the current setup demands the same level of scrutiny.
Today’s number feeds directly into the committee’s next deliberations, so the real sequence runs beyond this morning. Three variables will shape the next leg:
- The trajectory of future FOMC rate decisions
- The direction of real Treasury yields
- Whether the soft-landing narrative, and the labour market composition behind it, holds through the coming months
The reader who understands the $4,000-to-$4,535 range has a framework that survives whichever scenario fires this morning. A surprising print may move the price, but it does not rewrite the thesis.
This article is for informational purposes only and should not be considered financial advice. Investors should conduct their own research and consult with financial professionals before making investment decisions. Past performance does not guarantee future results, and financial projections are subject to market conditions and various risk factors. The scenarios described are speculative and subject to change based on market developments.