In the two weeks ending 15 September 2026, speculative traders accumulated 216,000 Yen futures contracts worth roughly $17.3 billion. That is not a position built on patience.
It is a crowded bet, assembled at speed, by traders who largely agreed on the same outcome. Agreement at that scale is not reassuring. It is its own risk.
Here is where the story sits now. USD/JPY trades at 157.01, and although the net long has been trimmed from a peak near 120,000 contracts, it still ranks at the 88th historical percentile. The Bank of Japan’s September rate decision moved against the consensus yen bull thesis, and part of the position was unwound. But 71,982 contracts remain.
The trimming was a reaction, not a resolution.
What follows in this analysis is a reading of what the positioning data actually tells you about the risk still on the table, how to recognise a crowded trade before it breaks, and what the USD/JPY technical structure reveals about where the whole thing could resolve. The lens is forward-facing, because the data demands it.
What 216,000 contracts in two weeks actually signals
Start with the source of record. The Commitments of Traders (COT) report, published weekly by the US Commodity Futures Trading Commission (CFTC), breaks futures positioning into two camps: commercial traders, who use futures to hedge real business exposure, and non-commercial traders, the speculators placing directional bets. When analysts talk about “the position” in yen futures, they mean the speculative, non-commercial side. That is the money with a view.
As of 22 September 2026, the speculative side was positioned like this.
| Category | Contracts | Date |
|---|---|---|
| Speculative long | 192,274 | 22 September 2026 |
| Speculative short | 120,292 | 22 September 2026 |
| Net long | 71,982 | 22 September 2026 |
The net long of 71,982 contracts is the headline number, but the path it travelled is the real signal. Consider how the position was assembled.
- Pre-peak build: A record-pace accumulation of 216,000 net contracts, roughly $17.3 billion, over the two weeks ending 15 September 2026.
- Peak: A net long of approximately 120,000 contracts, the highest in 14 months.
- Trim: A pullback to 71,982 contracts by 22 September 2026, after the BoJ decision moved against the bulls.
That accumulation pace is the part that should hold your attention. A position built that fast is not the product of patient conviction accumulating over months. It is a crowd arriving through the same door at the same time, which is exactly the structure that produces disorderly exits when sentiment turns.
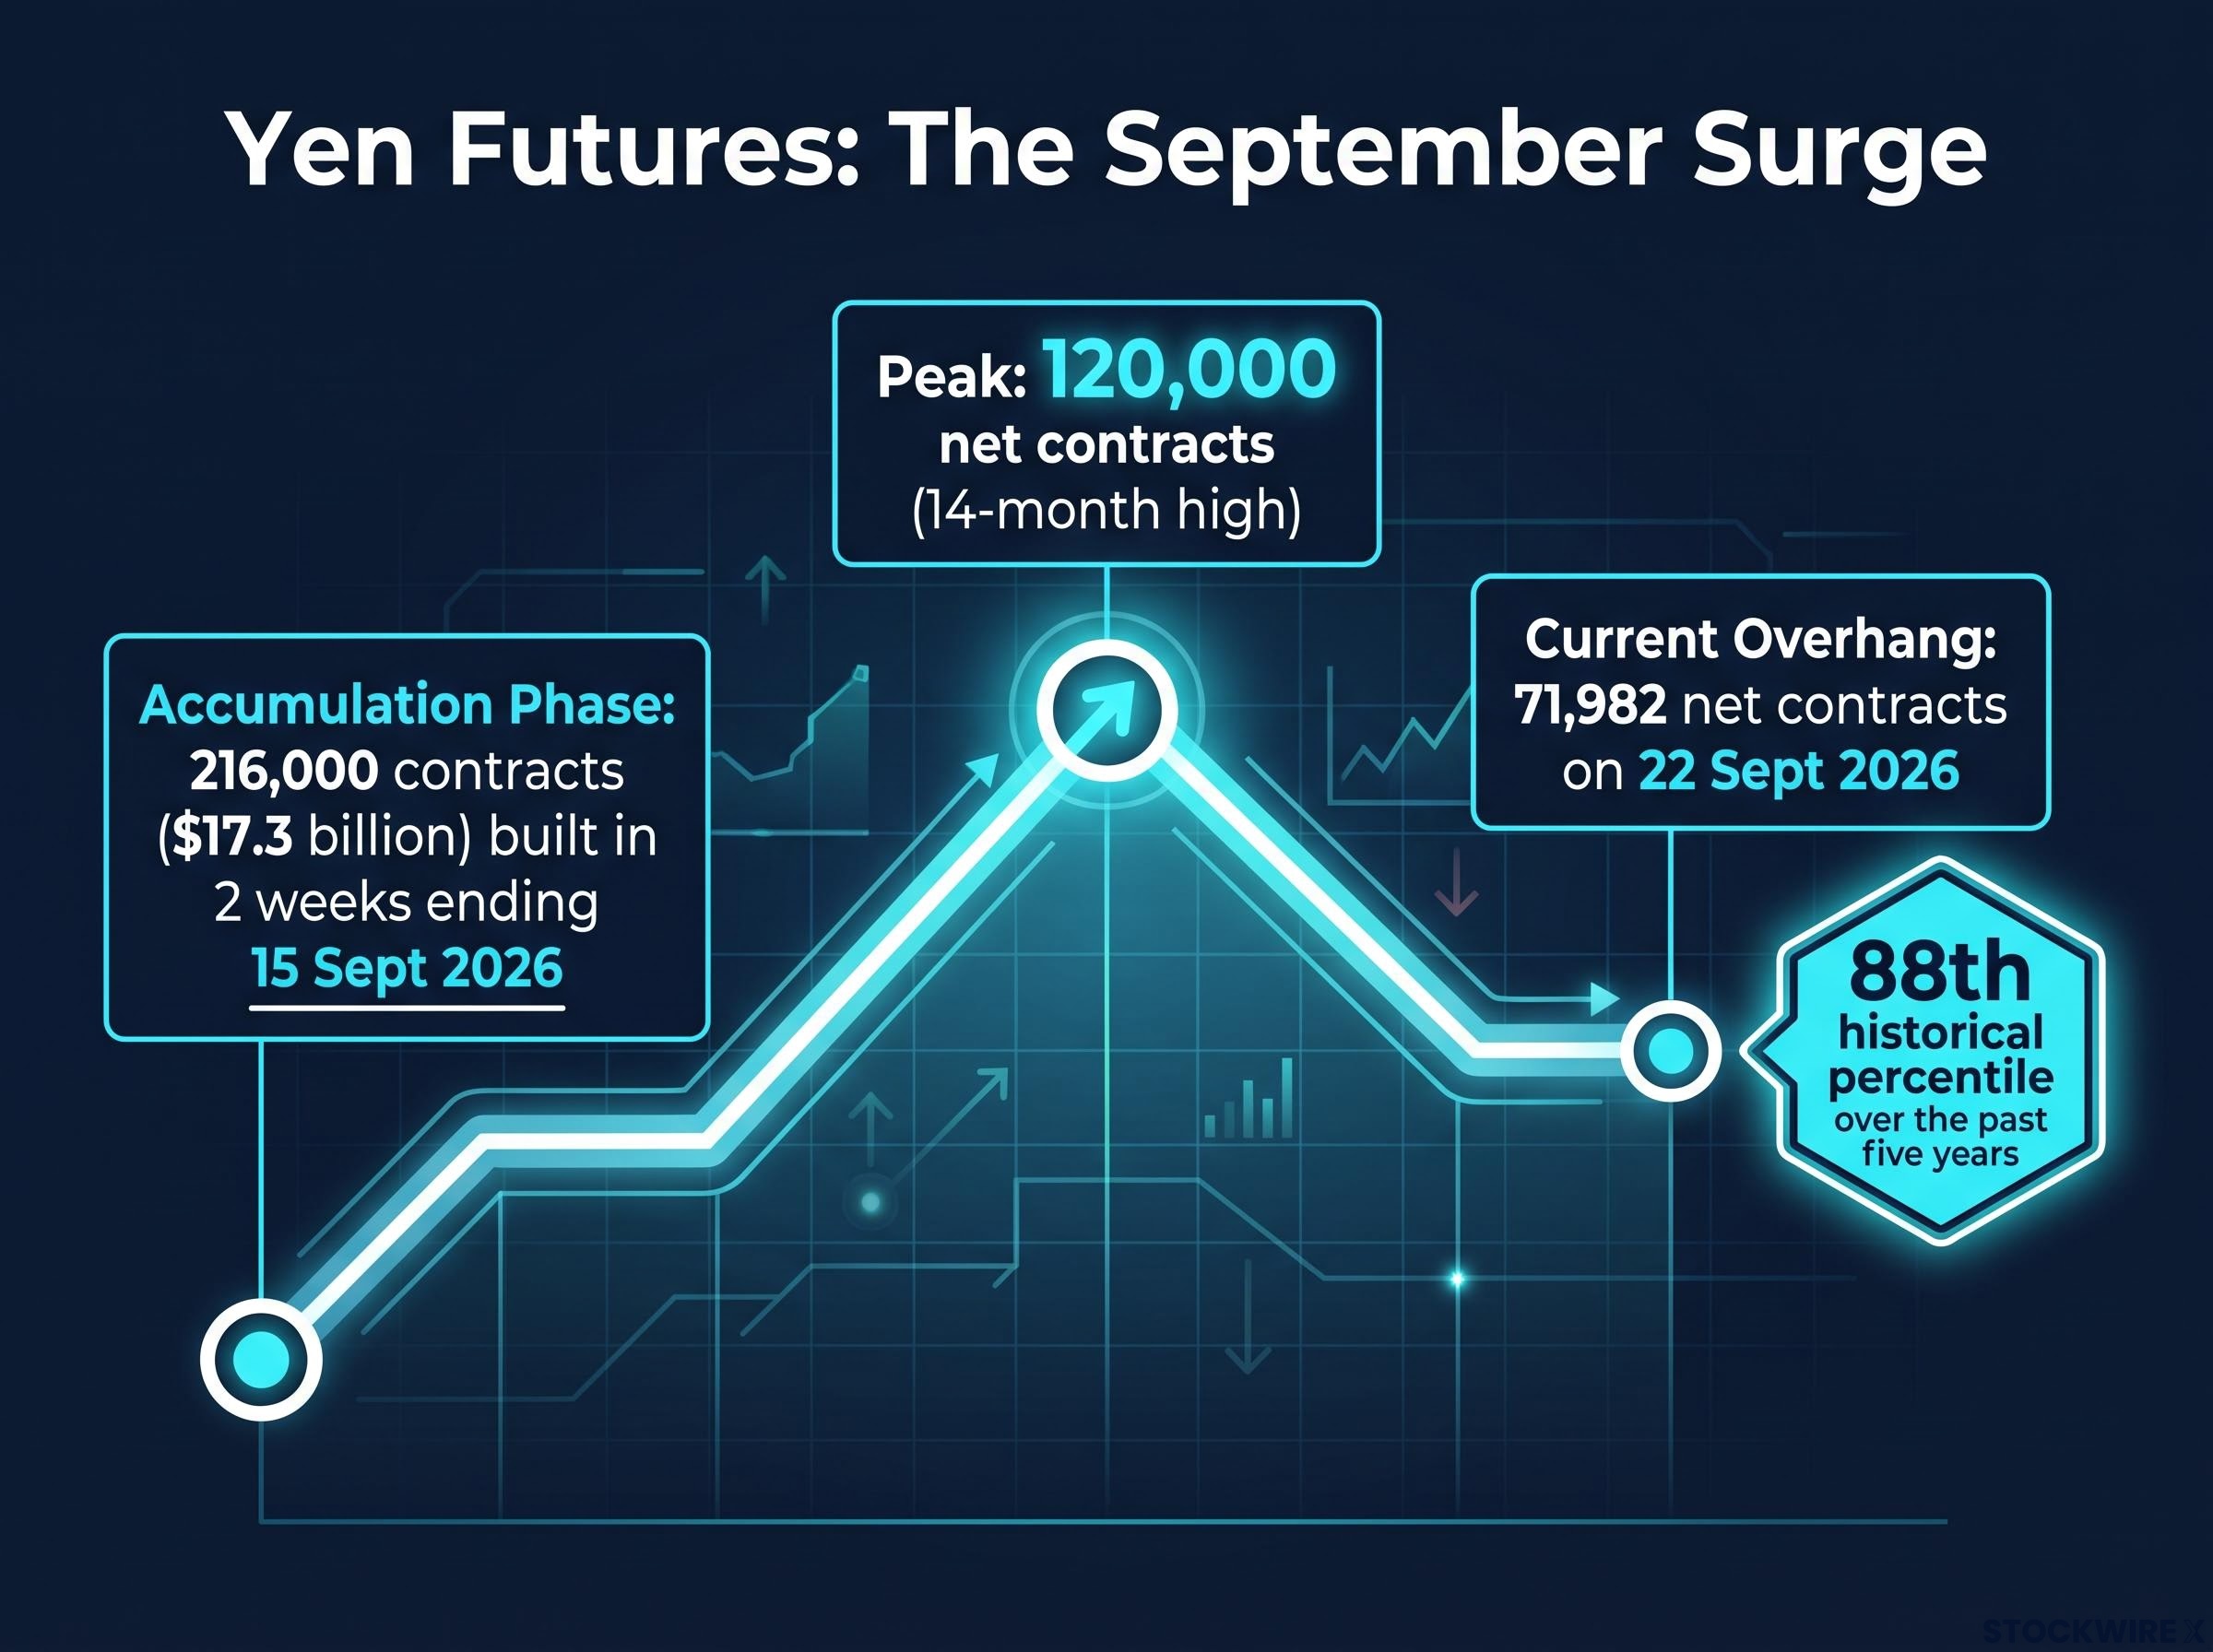
Now the trim. Cutting from 120,000 to 72,000 contracts looks like meaningful de-risking, and it is. But here is what the 88th-percentile reading tells you: even after that cut, the market is still more one-sidedly bullish on the yen than it has been 88% of the time over the past five years.
Put plainly, the overhang is a live risk, not a resolved one. The crowd thinned. It did not leave the room.
When big ASX news breaks, our subscribers know first
The August 2024 unwind as a live template for what happens next
To understand why an 88th-percentile position matters, you need the precedent that shows what happens when crowded yen positioning meets a policy surprise. The clearest recent example is August 2024, and it is worth watching the sequence unfold rather than reading it as a single statistic.
It began with the opposite trade. Before 31 July 2024, speculators were crowded into short-yen carry trades, borrowing cheap yen to fund higher-yielding assets elsewhere. The assumption underpinning all of it was a BoJ that stayed dovish indefinitely.
Then the BoJ hiked by 25 basis points on 31 July 2024, sooner and more decisively than much of the market had positioned for. Days later, a soft US jobs report landed on top of it, raising doubts about US growth and narrowing the rate-differential appeal of the dollar over the yen.
The crowded short-yen position unwound all at once. On 5 August 2024, the Nikkei 225 fell 12.4% in a single session, its worst day since 1987.
A 25 basis point move does not, on its own, justify a 12.4% equity crash. What turned a modest policy surprise into a market event was the mechanism of the unwind itself, operating in sequence.
Academic research on crowded carry trade unwinds shows that leveraged speculators amplify negative shocks non-linearly, with margin calls and forced selling compounding initial losses well beyond what the originating policy move would justify on its own, a dynamic the August 2024 sequence illustrated in live markets.
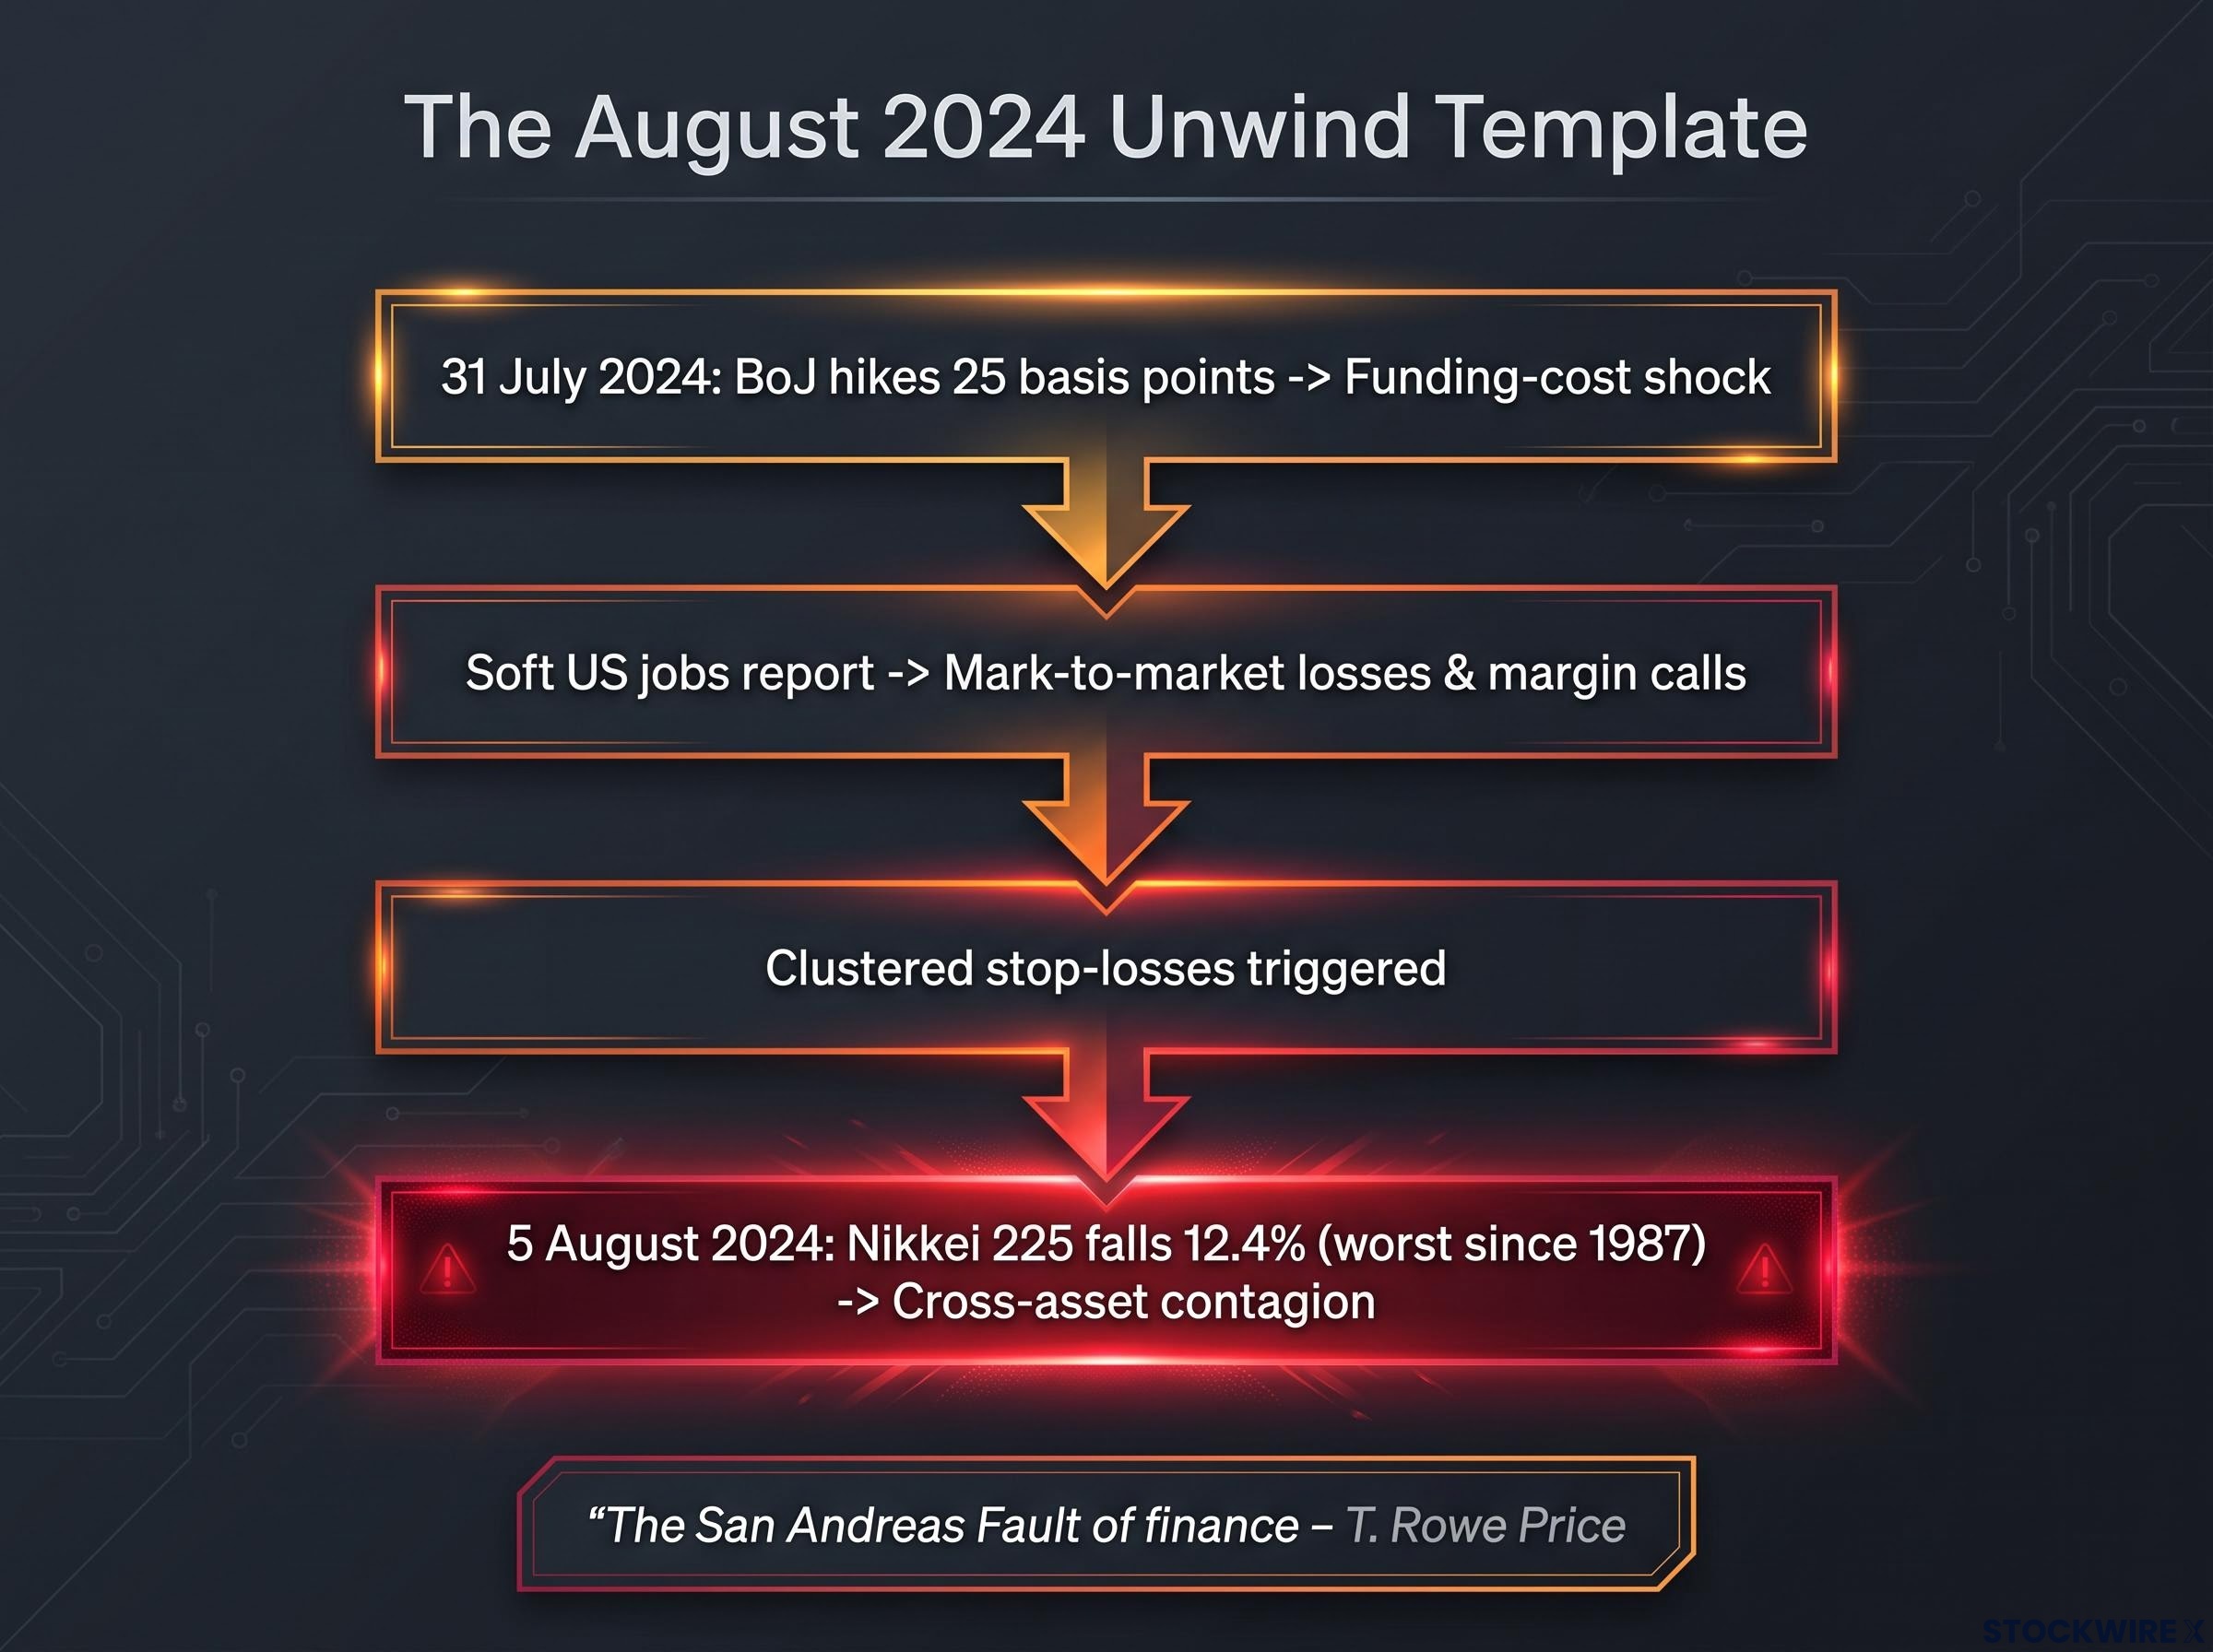
- Funding-cost shock: The rate hike raised the cost of holding leveraged short-yen carry trades, forcing the first wave of exits.
- Mark-to-market losses and margin calls: A strengthening yen and falling equities generated simultaneous losses, triggering margin calls and forced selling.
- Clustered stop-losses: With positioning heavily one-sided, large intraday moves tripped stop-loss orders in both futures and spot FX, each fill pushing the price further against those still in the trade.
- Cross-asset contagion: Yen-funded positions span global equity and credit markets, so the unwind did not stay contained in currency futures. It propagated outward.
T. Rowe Price captured the non-linear nature of this risk in its Q3 2024 commentary with a phrase worth sitting with.
The San Andreas Fault of finance. T. Rowe Price’s framing for how even small BoJ policy adjustments can trigger outsized, non-linear reactions across portfolios built on the assumption of stable Japanese yields and a weak yen.
The detail that makes this more than a history lesson comes from Midas Analytics, which noted that Japan’s carry trade was “quietly rebuilt after crashing.” The preconditions did not disappear after August 2024. They reconstituted.
The history of yen carry trade panic is instructive here: the 2024 episode resolved within weeks with 40-60% of speculative positioning cleared in that window, yet no cascading structural breakdown in global equity markets followed, which is the precedent that separates episodic stress from systemic collapse.
That is why the current 88th-percentile net long matters. It is not historical colour. It is the operational template for what today’s positioning could produce if the BoJ again deviates from consensus. Approach the current data with that sequence explicitly in mind.
Two views on the same position: macro conviction versus crowding risk
So is the current yen long a smart macro bet or a crowded accident waiting to happen? Both cases are stronger than a simple bull-versus-bear framing allows, and it is worth presenting each at full strength before the asymmetry between them becomes clear.
| Yen bull case | Crowding risk case |
|---|---|
| BoJ normalisation is structural: a 25bp hike plus a plan to halve monthly bond purchases by early 2026. | The net long sits at the 88th percentile, so the position itself becomes a source of volatility regardless of the thesis. |
| Narrowing yield differentials between Japan and the US reduce the appeal of shorting the yen. | Carry trades rebuilt after August 2024, showing positions can reconcentrate and unwind cyclically. |
| The structural shift away from ultra-loose policy undermines the yen’s role as the global carry funding currency. | Even a correct view carries execution risk: sideways or slightly adverse moves can trigger stop-outs with no new catalyst. |
Here is the crux. According to Midas Analytics, the payoff on this position is asymmetric: if the BoJ behaves as expected, the incremental gains are modest, because most of the normalisation story is already priced in. If the BoJ surprises against consensus, the losses can be severe, because every trader has to exit through the same door at once.
That asymmetry is what you need to internalise. A correct macro call on yen appreciation can still produce a painful trade outcome when the position is this crowded. Being right about the direction and being well-positioned for it are not the same thing.
The same asymmetry appears across asset classes: crowded positioning signals do not predict reversals, they predict magnitude, with the exit-door danger concentrated in markets where a single catalyst can force all holders to liquidate simultaneously.
Four risks that apply regardless of which view you hold
Whichever side of the debate you find more convincing, four caveats sit on top of the trade.
- BoJ gradualism: The central bank has consistently signalled slow, measured normalisation, which limits the pace of yen appreciation even when the direction is right, potentially exhausting carry before the thesis plays out.
- Official intervention risk: August 2024 showed that severe yen moves and associated equity volatility can prompt official intervention to smooth excessive strength, capping the upside on crowded long positions.
- US yield dynamics: If US yields stay elevated or rise, the rate-differential story may keep favouring the dollar over the yen despite BoJ normalisation, undermining the bull case.
- Positioning overhang: With net longs near the 88th percentile, the position is itself a risk. A stretch of sideways or modestly weaker yen could cascade into stop-outs simply because too many investors are on the same side.
The honest read is that this is not a question of who is right about the yen. It is a question of whether a right answer can survive the structure of the trade.
What the USD/JPY chart reveals about where this resolves
The positioning data tells you the risk is loaded. The chart tells you where the tug-of-war between yen bulls and dollar strength becomes legible in price. Treat it as a map, not a prediction.
As of 30 September 2026, USD/JPY traded at 157.01, down 0.17%, having retreated below 158.00 after a Tokyo inflation release yet holding positive on the week. That failure to sustain a move above 158.00 following the BoJ decision is the near-term signal: dollar strength is still winning on balance, but not decisively enough to break into higher ground.
One momentum reading sharpens the picture.
Daily Stochastic RSI near 82. A reading toward the upper end of its historical range, signalling elevated momentum and leaving room for short-term dips without, on its own, changing the broader directional bias. Read it as a warning light, not a directional call.
Here are the levels that matter on both sides of the trade.
| Category | Price level | Indicator / pattern | Significance |
|---|---|---|---|
| Resistance | 158.00 | 50-day EMA | First major ceiling; recently rejected |
| Resistance | 158.50 | 200-day SMA, head-and-shoulders pivot | Key medium-term pivot (OANDA) |
| Resistance | 159.50 | 38.2% Fibonacci, 100-day MA | Secondary upside target (Investing.com) |
| Resistance | 160.00 | Psychological ceiling | Medium-term resistance |
| Support | 157.50 | Bullish bias threshold | Daily closes above keep bias upward |
| Support | 155.00-155.03 | Head-and-shoulders neckline | Primary structural support (OANDA) |
| Support | 152.55-153.75 | Deeper support cluster | Downside targets if neckline breaks |
Resistance levels and what a breakout above 158.50 would mean
Take the ceiling in sequence. 158.00, the 50-day EMA, is the first hurdle, and the pair’s recent rejection there is the immediate tell. Above it sits 158.50, the 200-day SMA and the pivot of a potential head-and-shoulders reversal pattern flagged by OANDA. A sustained break above 158.50 would neutralise that bearish pattern and signal dollar momentum reasserting itself.
Beyond that, 159.50 aligns the 38.2% Fibonacci retracement with the 100-day moving average, and 160.00 is the psychological ceiling. A clean move through those levels would tell you the yen bull thesis is losing structural ground, forcing crowded longs to reconsider from a position of weakness.
Support structure and the neckline scenario
On the downside, the first line is 157.50. Daily closes above it keep the bias tilted upward; a daily close below 157.00 invalidates the near-term bullish setup.
The level that carries the most weight is 155.00-155.03, the neckline of that head-and-shoulders formation. Here is the part worth absorbing: a confirmed break below the neckline would validate the reversal pattern and open deeper targets at 153.75 and the 152.55-151.90 zone. That is a technically defined scenario in which the yen bull thesis fails at chart level, before any BoJ surprise arrives.
In other words, the technical structure is an independent risk layer stacked on top of the positioning one. Investing.com’s consensus year-end range of 155-160 frames the whole board: the neckline sits right at the floor of expected trading.
What the next BoJ move changes, and what it does not
Pull the threads together and the forward question becomes practical: what would actually trigger a repeat of August 2024, and what remains outside anyone’s ability to price in advance?
Three conditions would need to line up.
- Positioning reconcentrates at extreme levels, as it did in the record-pace 216,000-contract build ending 15 September.
- BoJ policy deviates from consensus, in either direction, the way the 25bp hike surprised the market in July 2024.
- An external shock lands simultaneously, such as soft US data or a broad risk-off event, exactly the combination that broke the carry trade in August 2024.
For August-style volatility to return specifically, one of two things would most plausibly need to be true: the BoJ accelerating normalisation beyond its signalled pace, with the next structural milestone being the planned halving of monthly bond purchases by early 2026, or a deterioration in US macro data that erodes rate-differential support for the dollar just as yen longs sit at scale.
Yen carry trade persistence after the June 2026 hike to 1.0% is explained by a structural arithmetic problem: closing the roughly 2.5-2.75 percentage point spread against the Fed would require approximately ten additional BoJ hikes, a path the BoJ’s own neutral rate estimate makes implausible in any near-term horizon.
What the 88th-percentile reading does not do is tell you when. It is a risk indicator, not a directional call and not a timer. Markets can sit at extreme positioning for long stretches before a catalyst arrives, which means the correct use of this data is monitoring, not urgent action.
A practical watchlist for the weeks ahead:
- BoJ communications: The pace and tone of guidance, especially anything that signals faster normalisation than markets expect.
- US employment and growth data: Surprises here shift the rate differential that anchors USD/JPY.
- Weekly COT releases: Watch whether the net long rebuilds toward its September peak or continues to unwind.
The year-end consensus range of 155-160 puts the stakes in context: a move to either boundary is well within normal, but the manner of that move, orderly drift versus cascading unwind, is what the positioning data is warning about.
This article is for informational purposes only and should not be considered financial advice. Investors should conduct their own research and consult with financial professionals before making investment decisions. Past performance does not guarantee future results, and these scenarios are speculative and subject to change based on market developments.
Reading the spring without predicting when it releases
The core tension holds in a single sentence: the yen bull thesis may well be directionally correct given BoJ normalisation, but the position structure at the 88th percentile makes the risk-reward asymmetric in a way that a correct macro view cannot fully overcome.
The 71,982-contract net long is two things at once. It is a reflection of genuine conviction about policy convergence, and it is a structural fragility assembled at a $17.3 billion pace in a fortnight. Markets rarely resolve that kind of tension gradually, and the August 2024 precedent is the pattern marker for how quickly it can snap.
The San Andreas Fault of finance. T. Rowe Price’s phrase remains the most useful frame here, because the rebuild-and-unwind pattern makes this cyclical rather than episodic.
The value of this analysis is not in knowing which way USD/JPY breaks next. It is in knowing precisely which data points to watch, BoJ communications, US surprises, and the weekly COT net, for the signal that the spring has finally released.