Here is a paradox worth sitting with. Japan’s national inflation has run below the Bank of Japan’s 2% target for eight straight months, yet the central bank has raised interest rates twice anyway. And now Tokyo’s core inflation reading has blown past forecasts by 30 basis points.
That tension is the story. The usual logic (inflation below target means no hikes) has broken down, and the data arriving over the next three weeks will decide whether it breaks down again in October.
The timing matters because the decision window is open right now. The next BoJ policy decision lands at the end of October, August wage data are imminent, and national September CPI arrives on 22 October. The evidence is still coming in.
So here is what the data actually tell you about whether October is a live meeting, and the three releases to watch before the BoJ speaks.
Tokyo’s September inflation read just changed the calculus
A 30-basis-point miss on a forecast the market had already nudged higher is not a rounding error. It is a signal.
Tokyo core inflation, which strips out fresh food, came in at 2.7% year-on-year in September 2026, against a 2.4% forecast and up from 1.8% in August. That is Tokyo’s hottest core reading since November 2025, and it sits comfortably above the BoJ’s 2% target.
Here are the three figures that matter, set against the prior month:
- Tokyo core CPI (excluding fresh food): 2.7% YoY, up from 1.8%
- Tokyo headline CPI: 2.7% YoY, up from 1.9%
- Tokyo CPI excluding food and energy: 3.0% YoY, up from 2.0%
The last figure is the one that should hold your attention.
The broadest measure of underlying price pressure Tokyo inflation excluding both food and energy hit 3.0% in September, up a full percentage point from 2.0% in August. When the measure that removes the most volatile categories accelerates this sharply, the price pressure is broad-based, not a single category distorting the average.
Why does a regional number carry this much weight? Because Tokyo CPI is widely treated as a leading indicator for national inflation. The capital’s price data tend to arrive first and point the way for the nationwide figure that follows. For the prior two months, national core CPI tracked roughly one-tenth of a percentage point beneath Tokyo’s reading, which gives the September print outsized relevance relative to its geographic scope.
The practical read for you is this. A 30-basis-point beat on a figure the BoJ already watches as a forward indicator means October should be treated as a genuinely live decision, not a placeholder meeting where nothing happens. If you hold yen-exposed positions or track BoJ policy, the September data have just made the October meeting harder to call from the sidelines.
When big ASX news breaks, our subscribers know first
Why national CPI has been below target for eight months and why that has not stopped the BoJ
If Tokyo inflation is running this hot, why has the national headline number stayed stubbornly below target? The answer is a mechanical distortion, and understanding it is the difference between forecasting the BoJ accurately and anchoring to the wrong number.
Japan’s government subsidises electricity and gas bills. Those subsidies directly reduce the utility tariffs that feed into the CPI basket, which mechanically lowers measured inflation for those categories even when underlying costs and demand are unchanged.
That is the entire reason national core CPI sat at 1.7% in August 2026, below 2% for the eighth consecutive month, while Tokyo core inflation (subject to the same subsidy regime) accelerated to 2.7%. The suppression is a feature of how the basket is measured, not a signal that domestic price pressure has faded.
Here is the evidence that the BoJ is not treating the national headline as a binding constraint:
| Indicator | Period | Figure | Policy relevance |
|---|---|---|---|
| Tokyo core CPI (ex-fresh food) | September 2026 | 2.7% YoY | Leading indicator; above target |
| National core CPI | August 2026 | 1.7% YoY | Subsidy-distorted; sub-target 8 months |
| BoJ policy rate (after June hike) | June 2026 | Raised | First hike during sub-target period |
| BoJ policy rate (after September hike) | September 2026 | 1.25% | Second hike during sub-target period |
The BoJ has lifted rates twice (in June and September) while national core CPI stayed beneath target. It did so by focusing on core and “underlying” inflation measures that strip out temporary policy interventions, including its own CPI indicator sets, last updated on 25 September 2026.
BoJ forward guidance delivered alongside the September hike carried more market-moving potential than the rate move itself, because hawkish language on the pace of further normalisation was the variable that carry-trade holders had not fully priced into their positions.
The takeaway for you is to stop anchoring your BoJ expectations to the national headline CPI figure. For anyone trying to forecast the next move, those eight sub-target months are close to policy-irrelevant. What matters is the underlying inflation the subsidies are masking, and the central bank has already shown you which signals it follows instead.
What happens when subsidies are phased out
When the government reduces or removes these utility subsidies, prices snap back toward market levels, producing a one-off jump in the national headline figure. The BoJ generally describes such moves as transitory and tries to look through them, emphasising medium-term inflation expectations and wage behaviour rather than the mechanical spike itself.
The complication is that even a technically transitory spike can feed into public expectations and wage negotiations. That makes the timing of any subsidy unwinding a practical input into the rate decision, even where the BoJ treats it as a pass-through rather than a structural shift.
The wage data that matter more than any single CPI print
The BoJ has been unusually explicit about what it needs to see before continuing to normalise policy: wages durably outpacing prices. On that specific test, the most recent data suggest the threshold has arguably already been met.
The BoJ’s September policy meeting opinions document shows the board actively debating the interaction between wage growth and underlying prices, with members emphasising that durable, broad-based wage gains remain the gating condition for continued normalisation rather than any single CPI print.
Consider the hierarchy of the July 2026 figures, because the single averaged number hides the real signal:
- Total cash earnings rose 4.7% year-on-year, against a 3.9% forecast, the largest annual increase since January 1997.
- Regular pay climbed 4.1% YoY, showing the gain is base-driven, not a one-off.
- Bonuses and special payments surged 6.3% YoY, and overtime added 3.1%.
- Real wages, meaning pay adjusted for inflation, rose 2.4% YoY, the seventh consecutive monthly gain and the strongest since May 2021.
That real-wage figure is the crucial distinction. It means pay is outpacing prices rather than merely tracking them, which is precisely the wage-price dynamic the BoJ has said signals self-sustaining reflation rather than imported or subsidy-driven inflation.
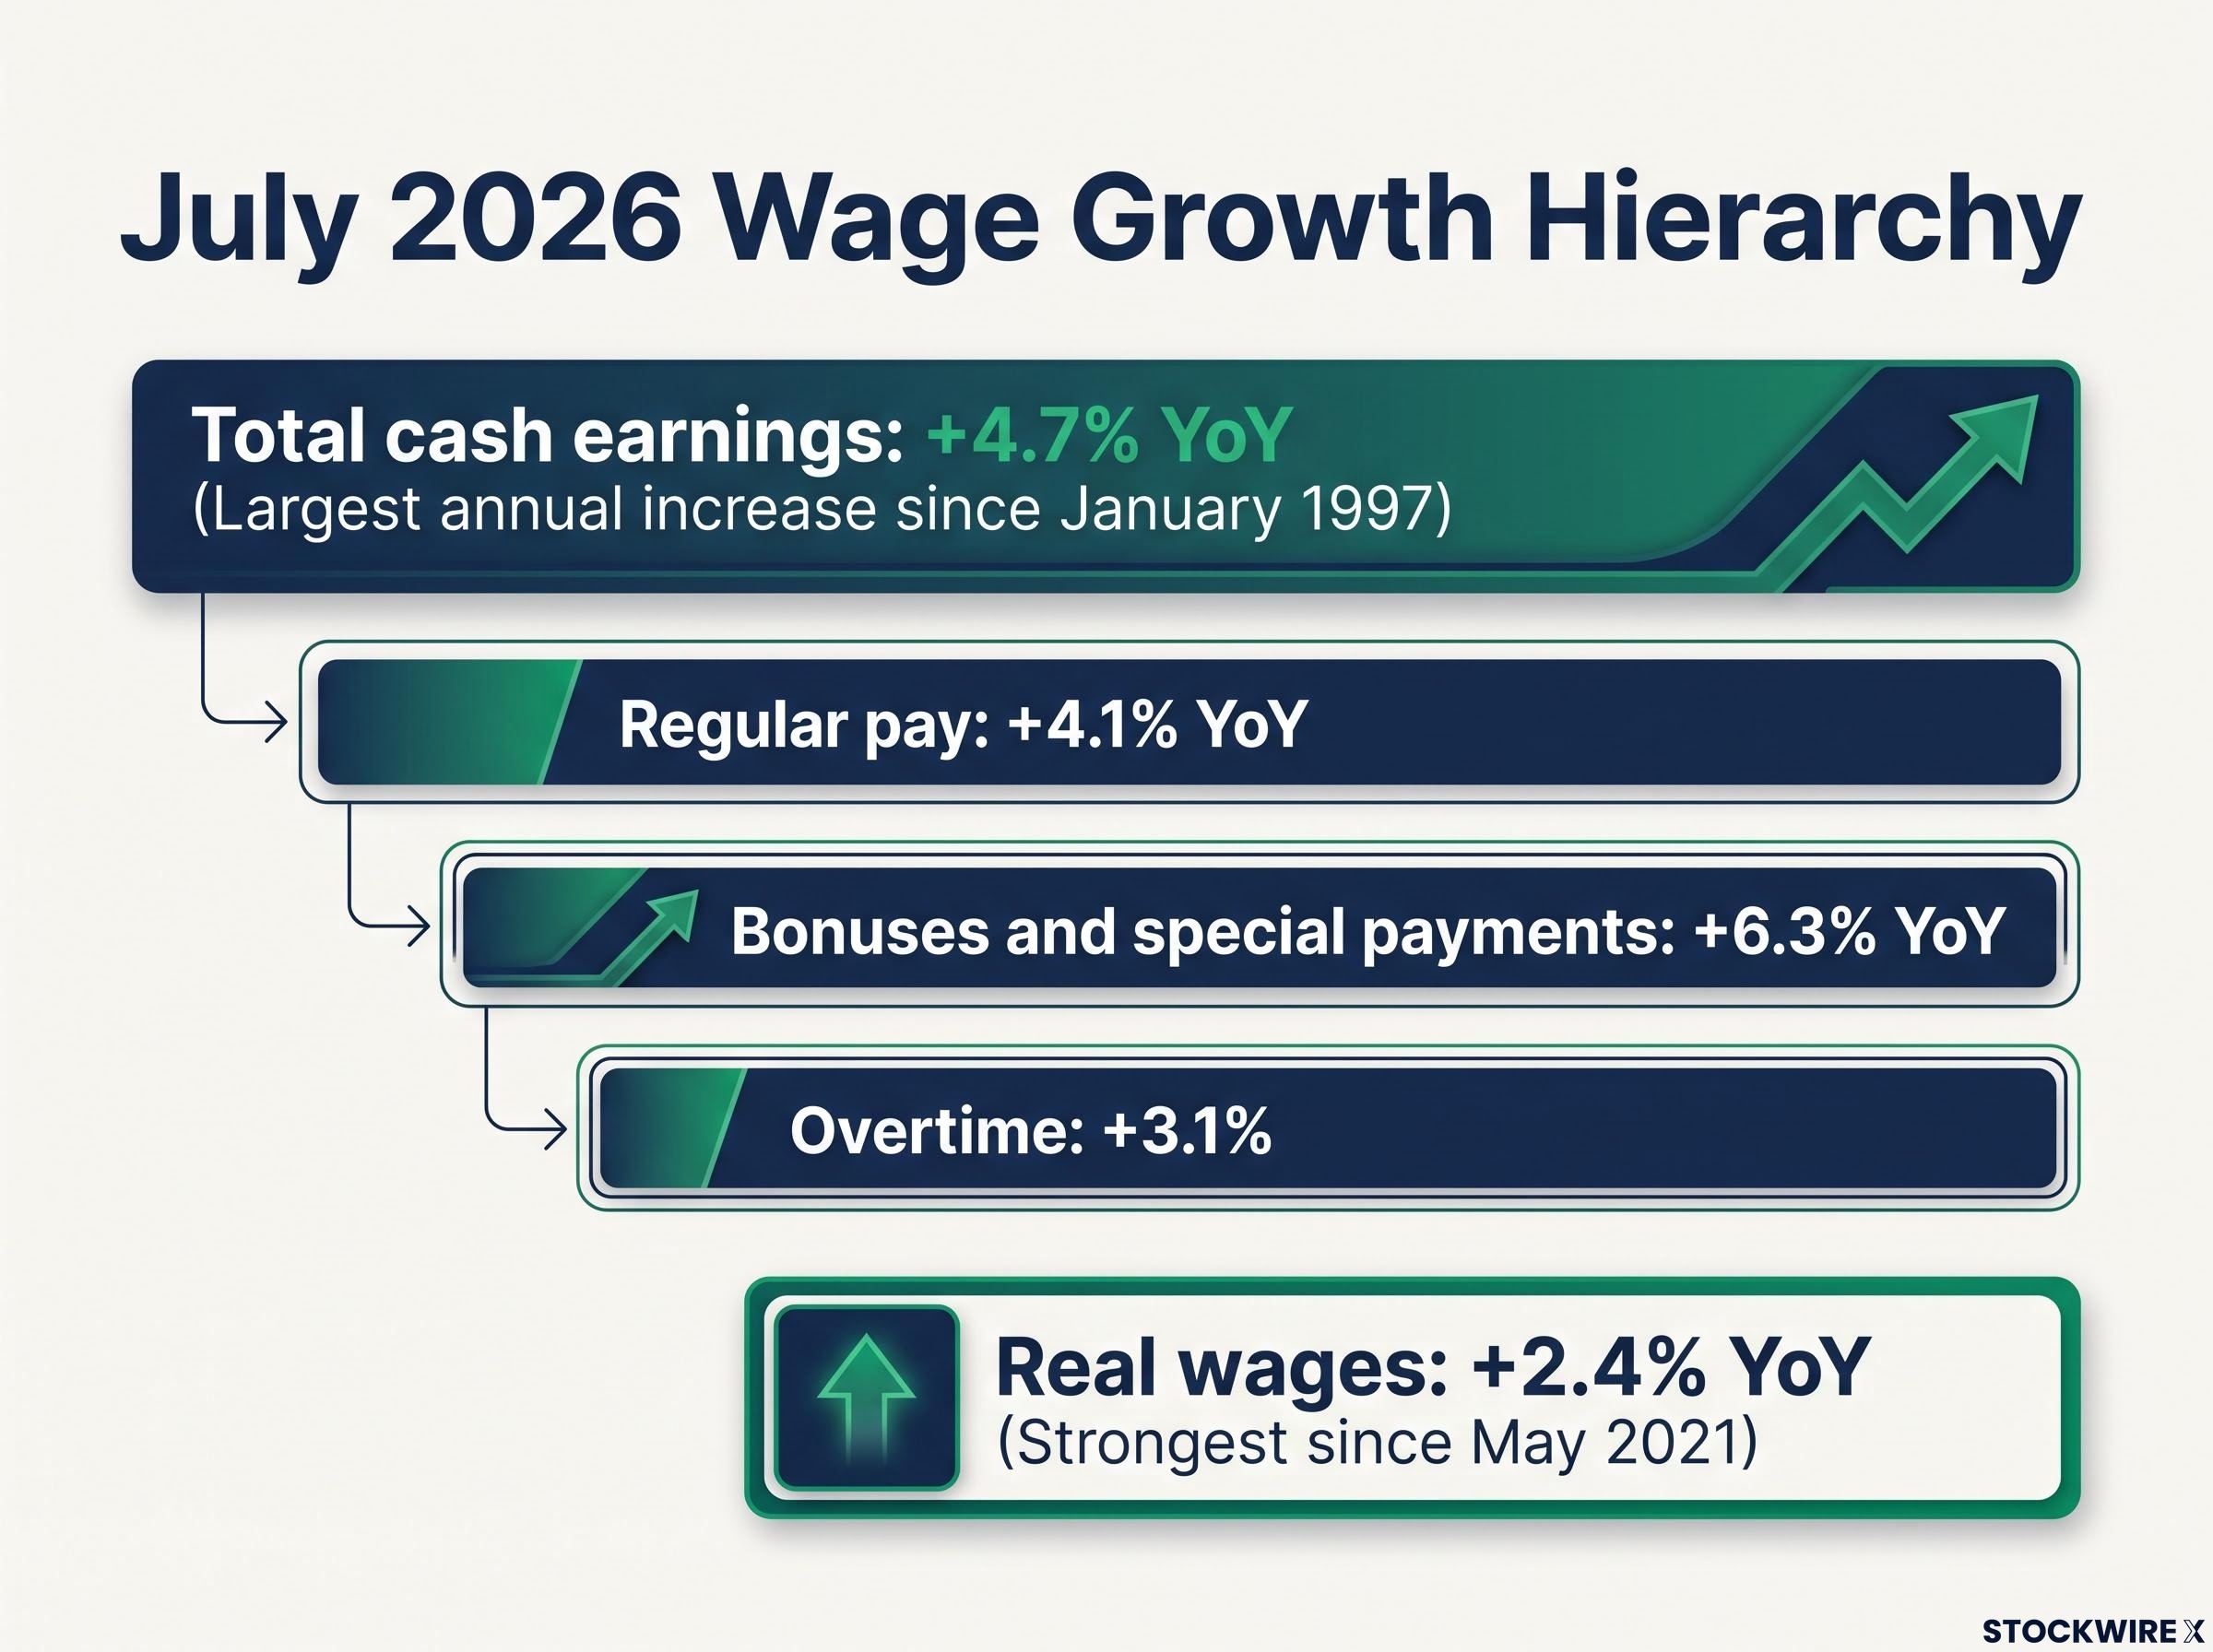
The strongest wage momentum in a generation July total cash earnings rose 4.7% year-on-year, the largest annual increase since January 1997. Nominal wage growth has now held above 3% for six consecutive months, the longest such streak in 34 years.
For context on the trajectory, June total cash earnings rose 3.4% YoY with real wages up 1.6%. July’s acceleration to 4.7% nominal and 2.4% real shows the momentum building, not fading.
This reorders the priority list. Anyone positioning around the October meeting on the basis of CPI alone is watching the wrong variable. The BoJ has placed wages at the centre of its decision framework, which makes the next release the one to watch.
August wage data are due at 23:30 GMT on the Tuesday following the US nonfarm payrolls report, making this the single most decision-relevant release before the October meeting. If August holds anywhere close to July’s trajectory, the BoJ will have in hand the exact evidence base it said it needed. At that point, the argument for pausing becomes structurally harder to sustain.
What the US jobs report adds to the equation
The yen does not move on Japanese data alone. It moves on the gap between Japanese and US policy, which is why the September US nonfarm payrolls figure is best read as a modifier to the USD/JPY equation rather than a standalone American story.
September payrolls came in at 98,000, above the 90,000 consensus but well below August’s 162,000. The unemployment rate held steady at 4.1%, with average hourly earnings forecast to rise 3.2% year-on-year.
Here is how the payrolls trio reads:
- Actual 98,000: enough to prevent a sharp dollar selloff
- Consensus 90,000: the figure was a modest beat, so no downside shock
- Prior month 162,000: a clear deceleration, which signals a softening labour market
That combination (above consensus but sharply below the prior month) is a deceleration signal rather than a collapse. It affects the pace at which the Federal Reserve diverges from the BoJ, without resolving the direction.
The yen carry trade, with notional exposure estimated between several hundred billion and over one trillion dollars, means a sharper-than-expected October hike could force simultaneous deleveraging across FX, credit, and equity markets well beyond Japanese borders, as the August 2024 episode confirmed.
This explains the muted yen reaction to the Tokyo CPI beat. Currency markets did not treat the inflation surprise as the catalyst, which tells you where the real USD/JPY trigger sits: in the incoming US and Japanese data combined, not in a single CPI print.
The practical read is that the 98,000 figure is good enough to prevent a sharp dollar selloff but not strong enough to reinforce dollar-bullish positioning. That leaves the next meaningful USD/JPY move hinging on the BoJ’s October communication rather than on US employment momentum.
The interest rate differential and yen structural support
The gap between US and Japanese 10-year government bond yields has been the structural driver of yen weakness. Through the BoJ’s ultra-loose policy years from 2013 to 2024, that widening differential made the yen progressively less attractive to hold, particularly once the Fed began tightening aggressively from 2022.
BoJ normalisation since 2024 has started to narrow that gap from the Japanese side. A softening US labour market, which pulls US yields down, combined with continued BoJ tightening, which lifts Japanese yields, would represent the first configuration in years where both sides of the differential move in yen-supportive directions at once.
What the October BoJ meeting actually turns on
Strip away the noise and the October decision turns on three variables, each of which tips the outcome in a knowable direction. This is a matrix, not a forecast.
The three inputs are August wage data (imminent), national September CPI (due 22 October), and the BoJ’s own communication in the weeks before the meeting. Here is how each cuts:
| Variable | Hike-supportive scenario | Hike-pause scenario |
|---|---|---|
| August wage data | Holds near July’s 4.7% nominal, real wages positive | Sharp retreat below 3% nominal, real wages flatten |
| National September CPI | Breaks above 2%, tracking Tokyo’s acceleration | Stays suppressed below 2% on subsidy effects |
| BoJ communication tone | Officials flag confidence in durable wage growth | Officials stress caution and data dependence |
The BoJ’s caution is not arbitrary. It carries institutional memory of its 2000 and 2006 tightening cycles, when modest hikes had to be reversed as disinflationary pressure returned.
The precedents the BoJ is trying not to repeat In both 2000 and 2006, the BoJ raised rates on inflation momentum that proved short-lived, then had to reverse course. Those episodes explain why the current leadership insists on evidence of durable, wage-driven inflation rather than acting on a subsidy-distorted headline move.
The difference in 2026 is the quality of the wage data. The fastest nominal gains since 1997 and the longest above-3% streak in 34 years are a qualitatively different foundation than the fragile momentum that unravelled in those earlier episodes.
The two-sided risk deserves equal weight. Move too fast, and the BoJ could choke the wage-led recovery before it is self-sustaining (real wage gains are only seven months old) and trigger a yen overshoot that compresses export competitiveness. Move too slowly, and a structurally weak yen keeps import costs high, squeezes real household incomes as subsidies fade, and forces sharper, more disruptive hikes later.
Private consumption remains the most contested variable in the growth picture: Japan’s Q1 2026 GDP grew at a 2.1% annualised rate driven overwhelmingly by the private sector, yet monthly household consumption fell 2.9% in March 2026, flagging a tension between the aggregate growth story and household-level spending capacity that wage data alone cannot resolve.
What this means for you is a conditional read, not a guess. If August wages hold near July’s 4.7% and national September CPI breaks above 2%, the October meeting is a live hike rather than a communications exercise. Current rate: 1.25%.
Three variables to watch before the October decision lands
The next three weeks resolve this in sequence. Follow these releases in calendar order and you will know whether October is directionally settled before the BoJ says a word.
- August wage data (imminent, 23:30 GMT the Tuesday after US payrolls). A reading near July’s 4.7% nominal with positive real wages opens the case for a hike. A sharp retreat below 3% nominal closes it.
- National September CPI (22 October). A break above 2%, tracking Tokyo’s acceleration, confirms underlying pressure is broad. A reading suppressed below 2% keeps the subsidy-distortion debate alive.
- BoJ October policy decision (end of October). With the current rate at 1.25%, this is where the first two signals either compound into action or justify another pause.
One market signal is worth flagging. The muted yen reaction to the Tokyo CPI beat suggests participants have not yet priced October as a live meeting. If August wages and national CPI confirm the tightening bias, the re-pricing could be sharper than the inflation print alone produced, because the market would be adjusting from a starting point of complacency.
For investors monitoring the re-pricing risk flagged in the final section, our detailed coverage of the carry trade unwind examines how $3.2 trillion in yen-funded global exposure and GPIF repatriation flows interacted with the September hike to drive USD/JPY to 153 without a single yen of official intervention.
Place this moment inside the longer normalisation arc. Two hikes already delivered during a sub-target national CPI stretch, historically strong wages, and a Tokyo inflation signal above 2% give the BoJ a far firmer footing than the episodes where it tightened and had to reverse.
A reader following these three data points in sequence will know, before the announcement, whether the October decision is a formality or genuinely in the balance. That is more useful than any single prediction.
This article is for informational purposes only and should not be considered financial advice. Investors should conduct their own research and consult with financial professionals before making investment decisions.
These statements are speculative and subject to change based on market developments and central bank communication. Past performance does not guarantee future results.