


Copper is trading near $14,400 per metric ton while bond markets price in a slowdown. Silver has run a supply deficit for six straight years, carries a formal U.S. critical mineral designation, and draws more than half its demand from industry.
Neither metal is behaving the way its fundamentals suggest it should. And that gap, between what the textbooks predict and what prices are actually doing, is the real story.
Both metals are being repriced by forces that sit outside the traditional commodity playbook. Structural electrification demand, a decade of underinvestment in mining, tariff-driven capital flows, and silver’s deepening role as a monetary safe-haven are all pulling these metals away from the GDP-sensitive, cycle-driven patterns investors have long relied on.
Here is what the data actually tells you about how to read copper and silver right now, and why the usual mental models may steer you wrong. By the end, you will have a framework for separating the structural forces from the behavioural ones, and for knowing which price signals to trust.
Why copper is defying the bond market
Copper sits between $14,225 and $14,438 per metric ton as of late September 2026, according to Bloomberg and Markets Insider data, with one earlier intraweek reference from MKS PAMP placing it closer to $15,000 per metric ton. At the same time, bond markets have been flashing recessionary warning signs. Historically, those two things do not coexist. Copper is the metal that falls when growth slows.
So which one is wrong?
Copper by the numbers Spot price: $14,225-$14,438 per metric ton (late September 2026). Up roughly 40% year-on-year after reaching nearly $13,000 per tonne in 2025.
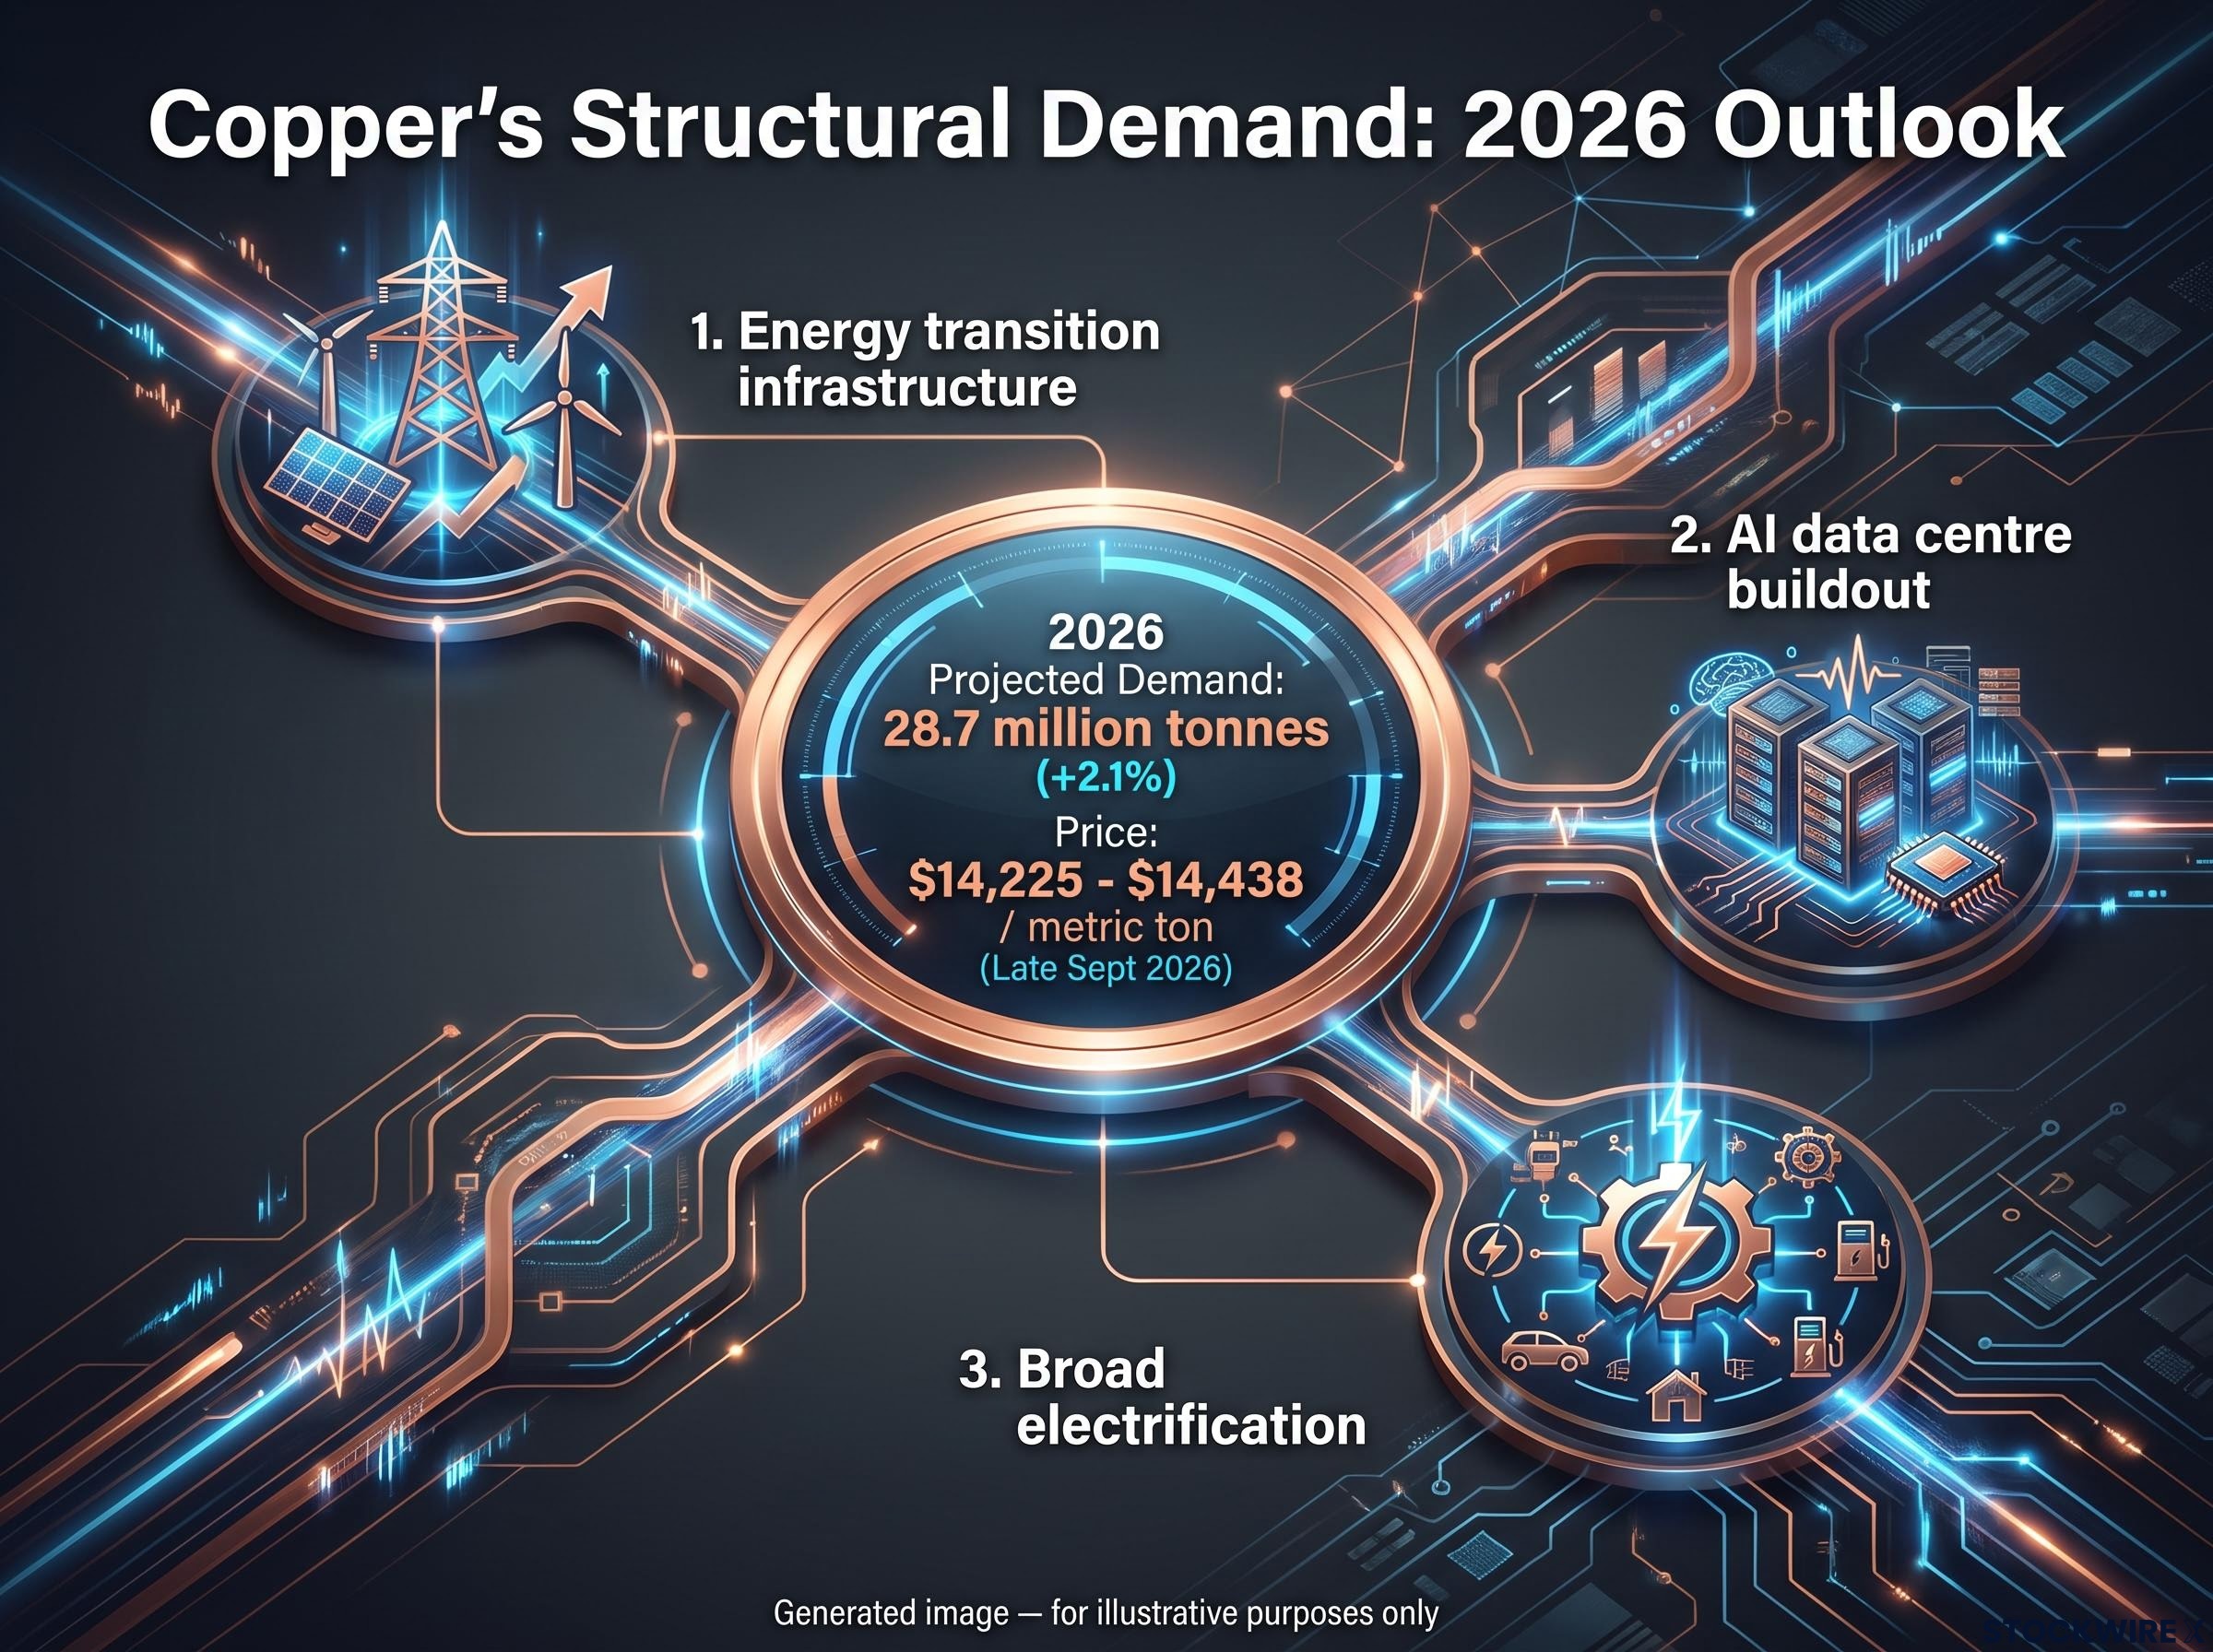
The answer is neither. The bond market is pricing cyclical risk accurately. Copper is simply no longer a pure cyclical metal. Its demand base has been rebuilt around commitments that do not flex with quarterly output, and those commitments fall into three broad categories:
- Energy transition infrastructure: grid expansion, renewables, electric vehicles, and transmission networks
- AI data centre buildout: power-hungry facilities that require copper-intensive electrical systems
- Broad electrification: the slow replacement of combustion and mechanical systems with electrical ones across the economy
These are multi-decade programmes, not discretionary purchases that get cancelled in a soft quarter. The MOFSL Commodities Review projects global refined copper demand to grow more than 2.1% to 28.7 million tonnes in 2026, even against the recessionary backdrop. Tariff-related policy uncertainty has added another layer, driving significant capital inflows into the market on top of the physical demand.
AI data centre copper demand illustrates why the structural thesis is insensitive to a single quarter’s output: hyperscale facilities consume 15,000 or more tonnes of copper per site, and those commitments are locked into multi-year capex cycles tied to technology investment plans rather than to any contemporaneous GDP reading.
What this means for you is direct. If you are still treating copper as a leading macro indicator, you are reading a signal whose predictive relationship has weakened. Copper holding firm during a slowdown is not a market anomaly to fade. It is a feature of the new demand mix.
The supply side of the structural floor
Demand is only half the story. The supply side builds the floor under it.
Mine development runs on timelines measured in years, not quarters. Permitting is slow, construction is capital-intensive, and high prices cannot conjure new tonnes at the scale the market needs on any useful horizon.
According to MKS PAMP, investment in mining was deprioritised in favour of technology over the past one to two decades, leaving a structural gap that today’s elevated prices are working against but have not closed. The result is a market where strong demand meets a supply side that cannot quickly answer. That is a recipe for resilience, not reversion.
When big ASX news breaks, our subscribers know first
Silver’s identity crisis: six years of deficits, one dominant narrative
On paper, the industrial case for silver has rarely looked stronger. Industrial consumption hit a record 657.4 million ounces in 2025, roughly 58% of total annual silver demand, according to the Silver Institute’s World Silver Survey 2025. The market is on track for its sixth consecutive year of deficit, with Futunn projecting a gap near 46 million ounces in 2026 against total demand of 1.1306 billion ounces in 2025.
Then there is the policy signal.
A formal supply-risk flag The U.S. Geological Survey added silver to its critical minerals list, citing supply-demand imbalance and its role in key technologies. Demand outstripped supply for the fourth consecutive year in 2024, per FXStreet reporting.
That is an official recognition that silver faces both economic importance and supply risk. By any physical measure, this is a bullish structural picture.
Here is the dissonance. Silver’s price, sitting at $61-$64 per ounce in late September 2026, is not being set by those physical balances. It is being set by gold.
Silver’s annualised volatility of roughly 37% against gold’s 18% makes identifying the dominant silver price drivers at any given moment more consequential than for almost any other widely traded commodity; a monetary regime that overrides bullish industrial fundamentals can produce sustained multi-year declines even as physical deficits deepen.
| Year | Industrial Demand (million oz) | Estimated Deficit (million oz) | Key Driver |
|---|---|---|---|
| 2024 | Record pace (4th deficit year) | Persistent deficit | Solar, electronics |
| 2025 | 657.4 | Persistent deficit | Solar PV, AI components |
| 2026 (proj.) | 639.6 | ~46.3 | Softening PV, inelastic supply |
The interpretive takeaway for you is uncomfortable but clear. The critical mineral status and the six-year deficit are genuinely bullish, but they are not what is moving the price right now. If you are positioning in silver as an industrial scarcity play, understand that the price you see today more likely reflects gold’s sensitivity to interest rates and the dollar than the physical supply picture. The industrial thesis is real. It is just not the current driver.
When fundamentals and behaviour diverge
Part of the explanation sits in one softening demand category. Photovoltaic silver demand is projected to decline roughly 3% in 2026, taking total industrial use down to 639.6 million ounces, per Futunn.
That matters. Solar has been one of silver’s strongest industrial stories, and a wobble there removes some of the pressure that would otherwise push silver to trade on its own industrial merits. With that leg softening even as the structural deficit persists, silver has stayed anchored to gold’s macro drivers rather than re-correlating with industrial metals.
The World Silver Survey 2026 deficit trends confirm that industrial demand softening in photovoltaics has not closed the structural supply gap, with the market remaining in persistent deficit even as total industrial consumption dips, a combination that explains why silver’s price continues to trade on monetary rather than physical logic.
What the gold-to-silver ratio is actually telling you
The ratio between the two metals is the single most useful lens for tying this all together. It measures how many ounces of silver it takes to buy one ounce of gold, and its movement reveals which of silver’s two identities, industrial or monetary, is winning at any given moment.
As of 17 September 2026, Investing.com put the ratio at roughly 67.8, with Futunn citing about 68 on 14 September. Gold was trading near $4,240 per ounce, roughly $500 above its inflation-adjusted historical high of approximately $3,600, per MKS PAMP.
The trajectory tells the story. The ratio peaked above 105 in early 2025, according to Saxo Bank, then compressed sharply, falling from 110 to a low near 65 over the course of 2025 per the MOFSL review. That compression is silver outperforming gold, and it reflects the structural tightness finally being felt.
| Period | Gold (approx) | Silver (approx) | Ratio | Interpretation |
|---|---|---|---|---|
| Early 2025 | Rising | Lagging | 105+ | Monetary fear dominant |
| Late 2025 | High | Outperforming | ~65 | Industrial tightness felt |
| Sept 2026 | $4,240 | $62-$64 | ~68 | Dual narrative balanced |
There is a specific threshold worth marking on this chart.
The substitution line MKS PAMP notes that at a gold-to-silver ratio near 75 or higher, industrial users begin switching away from silver to cheaper substitutes. The current high-60s level sits comfortably below that, meaning industrial demand is sustained rather than being priced out.
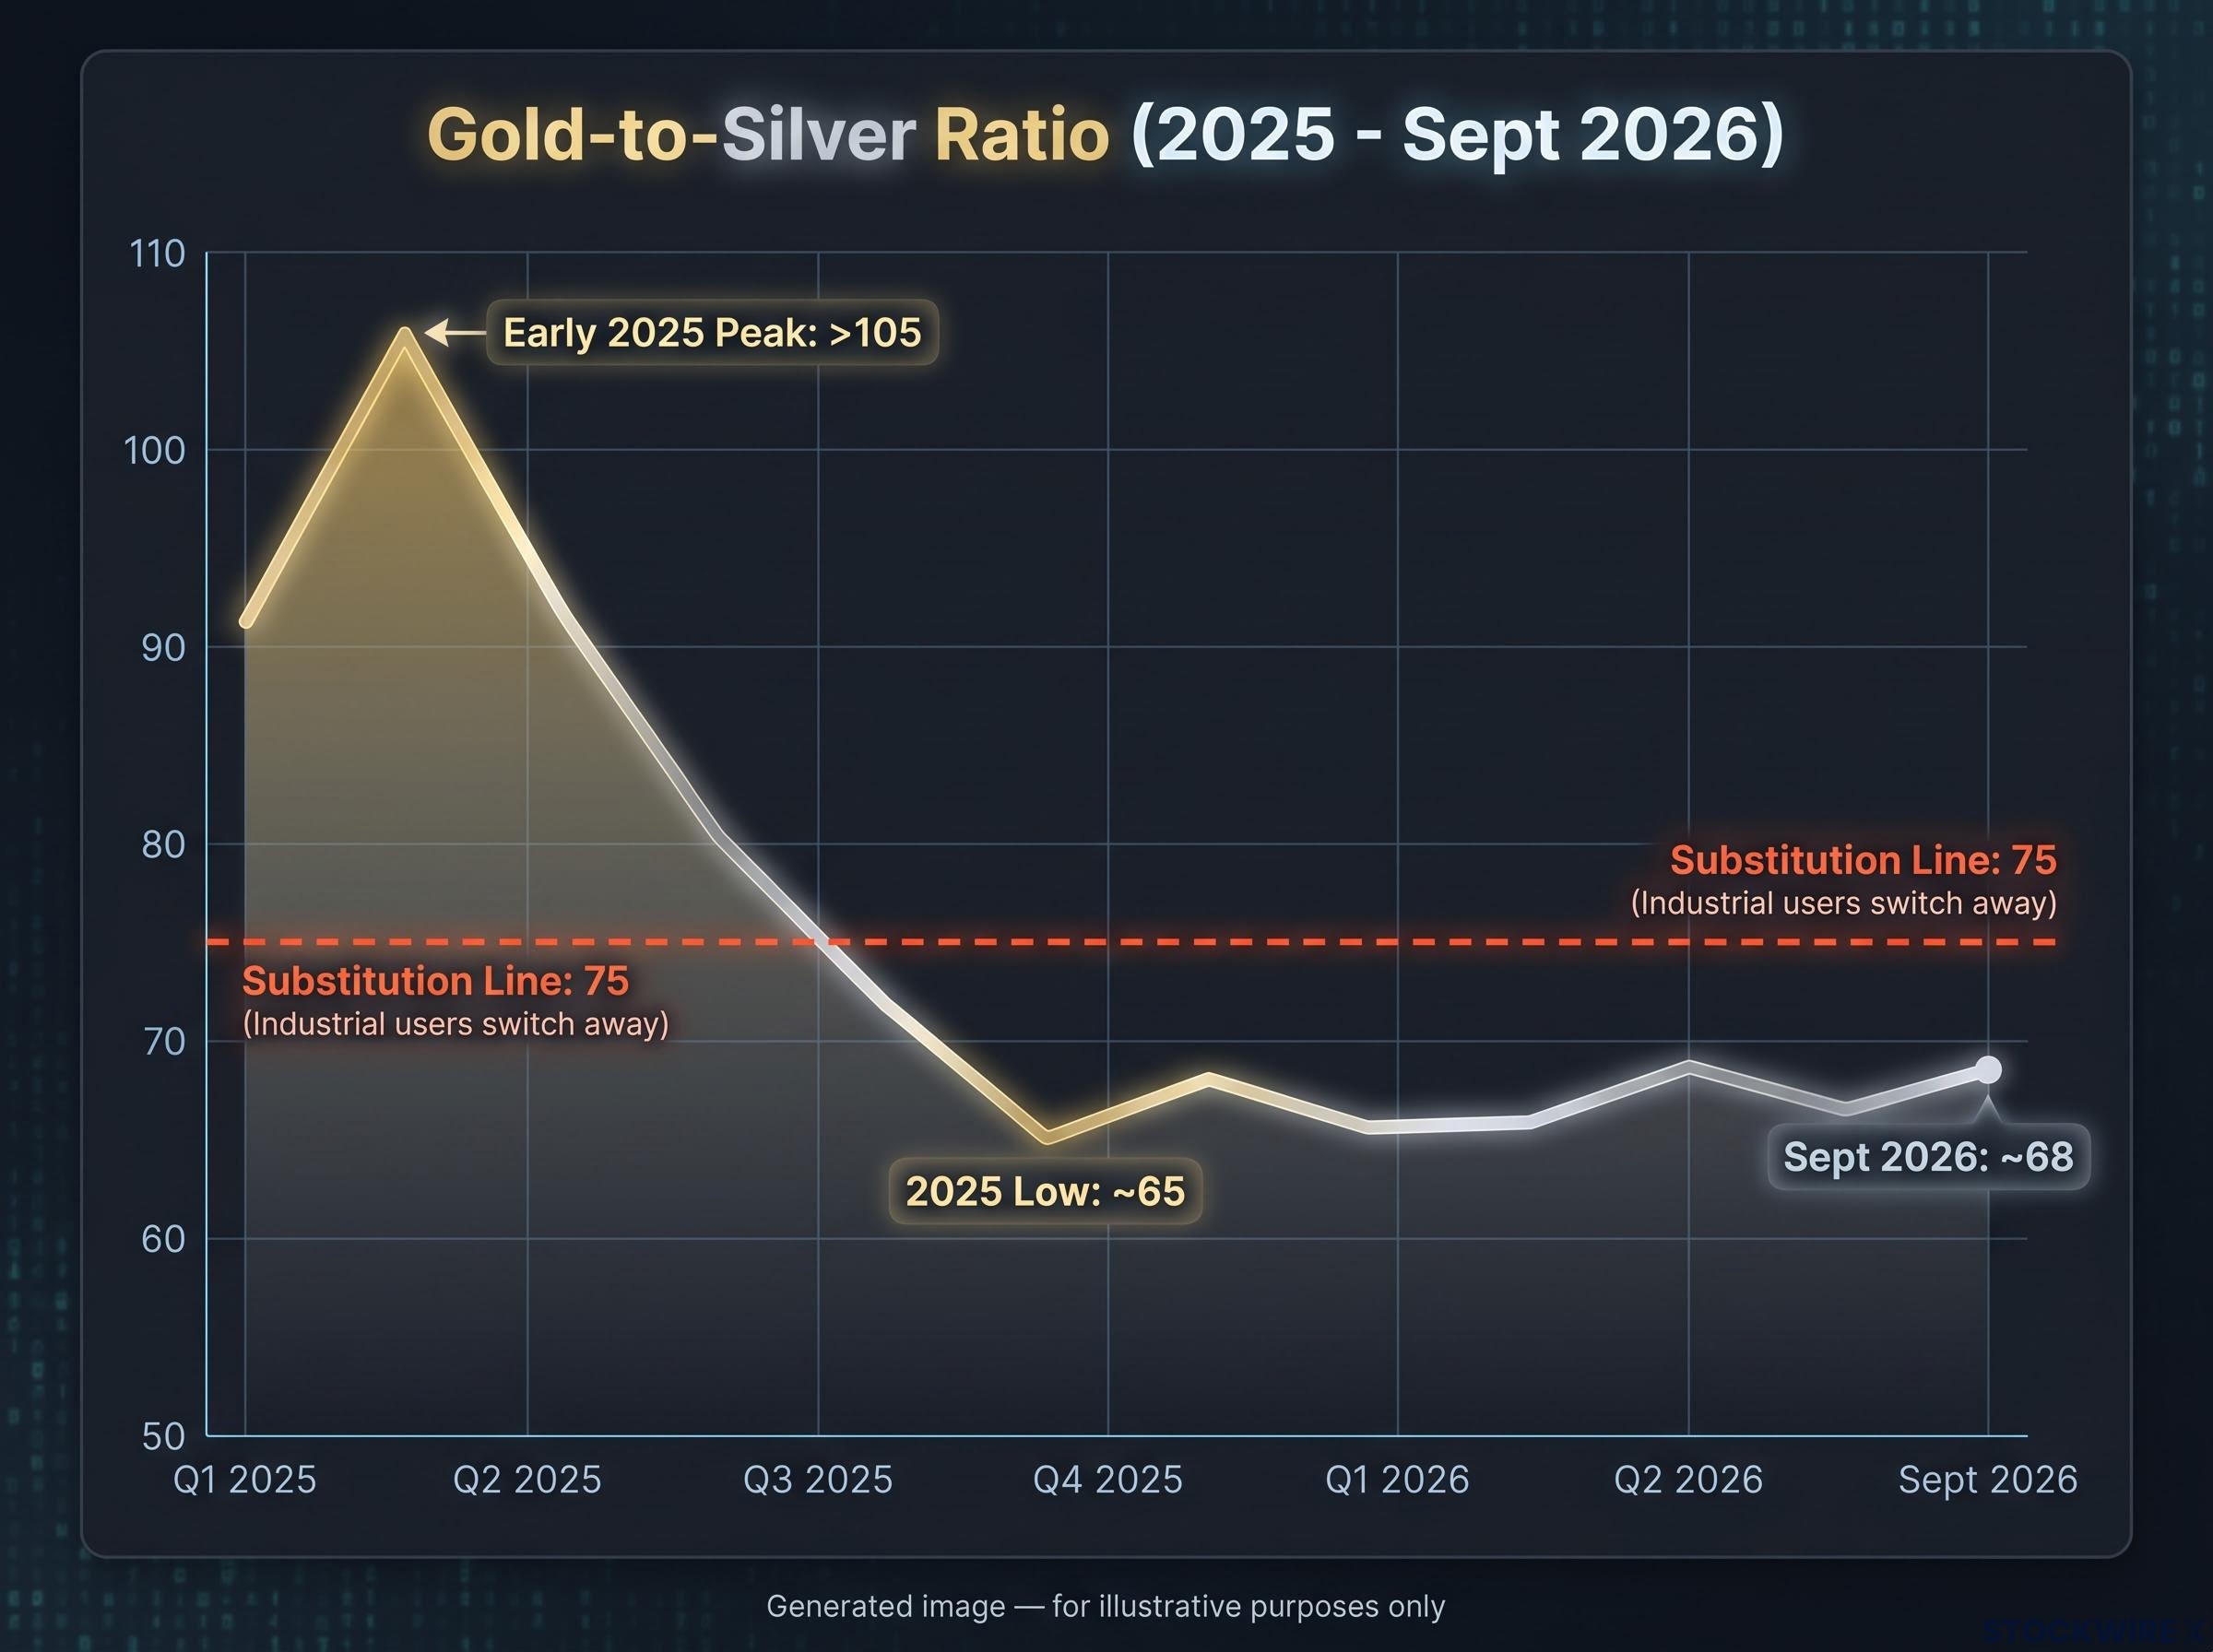
So what does a ratio in the high-60s actually tell you? That silver is being held aloft by its monetary role while industrial demand sets a floor beneath it. What it does not tell you is which force takes over next. For that, watch these conditions:
- Gold’s macro narrative fading, which would strip out the monetary premium
- Industrial demand re-accelerating, particularly in solar and AI hardware
- A shift in the monetary environment that reduces safe-haven flows
Use the ratio as a positioning diagnostic, not a buy signal. Where it sits tells you how much of silver’s price is monetary premium versus industrial scarcity, and that split tells you which macro variables to monitor.
The equity-to-silver ratio is near its most compressed level since the dot-com peak, a positioning context that matters alongside the gold-to-silver ratio because it reveals how institutional capital is being allocated between real assets and equities, a separate but related signal for where silver’s monetary premium is heading.
The educational case: why these metals stopped following the old playbook
To read any of this correctly, it helps to understand the model these metals are breaking.
The traditional framework for pricing an industrial metal runs on three inputs: demand tied to GDP growth, inventory cycles as buyers build and draw down stock, and currency sensitivity, mostly to the U.S. dollar. When the economy expands, construction and manufacturing pull more metal, prices rise, and the cycle turns. Copper was the purest expression of this model, which is why it earned its reputation as an economic bellwether.
Commodity supercycle mechanics explain why the supply-side lag under copper is structural rather than temporary: resource projects take 10-20 years from discovery to full production, making it impossible for new supply to arrive fast enough once large-scale demand shifts emerge, regardless of how elevated prices become in the interim.
Both copper and silver have partially broken from it, for different reasons.
- Copper: cyclical demand came from GDP-linked construction and manufacturing. Structural demand now comes from energy-transition grid buildout and AI infrastructure, which are insensitive to a single quarter’s output.
- Silver: cyclical demand came from the manufacturing cycle. Structural and monetary demand now comes from the clean-tech buildout and safe-haven positioning, a combination neither framework handles alone.
Silver’s dual identity is the key to it. It is both an industrial input and a monetary asset, and MKS PAMP describes it as high-beta relative to gold, meaning it tends to outperform significantly when the dollar weakens. Copper, meanwhile, has increasingly traded in line with equity markets, with some participants treating it as a stock market proxy. Neither behaviour makes sense under the pure industrial model.
The practical upgrade to your mental checklist is this. The old questions still apply, but you now need a second layer. Before reading any metals price signal, ask:
- What share of this metal’s demand is structural versus cyclical?
- Which pricing identity is dominant right now, industrial or monetary?
- What would need to change for the other identity to take over?
Two metals, two layers of pricing logic
Copper’s equity-proxy behaviour and silver’s gold-proxy behaviour are symptoms of the same underlying shift. When demand becomes tied to long-horizon themes, energy transition, AI, monetary policy, rather than quarterly economic output, metals pricing starts to absorb the valuation frameworks of those adjacent asset classes. Copper borrows from equities. Silver borrows from gold. The metal itself has not changed. What it is being priced against has.
What shifts the narrative from here
Neither metal is on a one-way path. Each has identifiable pressure points where the current logic breaks, and watching those is more useful than holding a fixed bullish or bearish view.
For copper, the signal to watch is whether the structural demand story begins to crack. That would show up not as a single bad GDP print, since copper has been absorbing those, but as evidence that electrification and AI buildout timelines are slipping, or that sustained high prices are redirecting industrial procurement toward aluminium and other substitutes. Demand growth of 2.1% to 28.7 million tonnes projected for 2026 is the baseline. A downgrade to that, driven by structural rather than cyclical factors, is the real warning.
For silver, the question is whether it re-correlates with industrial metals or stays tethered to gold.
The number to mark At a gold-to-silver ratio near 75 or higher, MKS PAMP flags observable substitution by industrial users. That level is the point where silver’s industrial demand starts getting priced out, a specific line to watch rather than a vague risk.
Three conditions could pull silver back toward its industrial identity:
- Re-acceleration of photovoltaic and AI hardware demand, reversing the projected 3% decline to 639.6 million ounces in 2026
- New mine supply coming online to close the deficit, letting silver trade like a normal industrial metal
- A calmer macro environment reducing the safe-haven flows that currently bind silver to gold
There is also a cross-metal angle. With gold trading roughly $500 above its inflation-adjusted high, copper has become a relatively more attractive real-asset alternative. If gold’s premium unwinds, some of that real-asset flow could rotate, affecting both metals at once.
| Metal | Current dominant force | Variables to watch | Signal the narrative has shifted |
|---|---|---|---|
| Copper | Structural demand, equity-proxy flows | Electrification/AI timelines, substitution, tariff policy | Structural demand downgrade, not just a weak GDP print |
| Silver | Gold correlation, safe-haven positioning | PV demand, mine supply, ratio near 75, macro calm | Re-correlation with industrial metals away from gold |
Past performance does not guarantee future results. Financial projections are subject to market conditions and various risk factors, and these forward-looking statements are speculative and subject to change.
Reading both metals for what they are, not what they were
Strip away the detail and one principle remains. Both copper and silver are in a structural repricing, driven by long-horizon demand and constrained supply, but the financial layer is running ahead of or alongside the physical one.
Copper sits at $14,225-$14,438 per metric ton with 2.1% demand growth projected for 2026, underpinned by electrification and AI, yet it increasingly trades like an equity. Silver carries a six-year deficit, formal U.S. critical mineral status, and a 58% industrial demand share, yet its behaviour is dominated by gold. The gold-to-silver ratio near 68 is the clearest symbol of the whole situation: industrial metal demand has become entangled with energy policy, AI timelines, and monetary hedging in ways the old frameworks never accounted for.
The analytical error most likely to produce a wrong call right now is treating either metal as a simple macro indicator. The work now takes two questions instead of one:
- Which pricing identity is dominant for this metal today, industrial or monetary?
- What is the evidence that it is about to shift?
That two-question framework is more durable than any price target. It survives whichever way the metals break next.
This article is for informational purposes only and should not be considered financial advice. Investors should conduct their own research and consult with financial professionals before making investment decisions.






