Covered call ETFs carry a reputation problem. Many investors associate the strategy with net asset value (NAV) decay, yield traps, and funds that quietly consume their own capital to keep distributions flowing.
Six funds challenge that assumption directly. They generate 9%-13% annual yields while maintaining distribution growth histories that, in at least one case, stretch across five years of shifting market conditions.
For income-focused investors, the hunt for genuinely sustainable high yield has narrowed. Traditional dividend strategies top out around a fraction of what these funds offer. Fixed income competes on yield but not on growth. This specific category of covered call fund-of-funds sits in an increasingly credible middle ground, but only for investors who understand what makes these six funds structurally different from the products that earned the asset class its reputation.
This analysis identifies the structural features that separate capital-preserving covered call funds from yield traps. It compares six specific funds across yield, total return, distribution growth, and cost, then frames the conditions under which each type of investor should, or should not, use them.
How these funds generate two separate income streams
These are not high-yield bond substitutes, and treating them that way leads to the wrong conclusion. Covered call fund-of-funds earn income from two structurally distinct sources, and the distinction matters for how you evaluate them.
The two streams work like this:
- Underlying returns: dividends and price appreciation from the ETFs held inside the fund.
- Option premiums: cash collected by writing call options (contracts that give a buyer the right to purchase a holding at a set price) against a portion of those holdings.
The fund-of-funds structure is the second key feature. Rather than holding individual stocks, each fund invests in other ETFs, giving you multi-sector diversification through a single ticker with the option-writing layer applied on top. Approximately 25% leverage sits beneath most of these funds, enlarging the asset base so that dividends and premiums are amplified enough to reach the headline yield.
The yield spread across the group is where investors most often misread the signal. QQCL (Global X Enhanced Nasdaq-100 Covered Call ETF) carries a yield of roughly 13.5%-13.6%, tied to a Nasdaq-100 benchmark with around 60% technology weighting. HDIV (Hamilton Enhanced Canadian Covered Call ETF) yields 9.7%-9.8%, tied to a more defensive mix of roughly 75% Canadian and 25% American holdings.
The yield difference between these funds reflects the volatility of their underlying holdings, not differences in payout discipline. A higher yield signals more concentrated, more volatile exposure, not a better fund.
BMAX (Brompton Enhanced Multi-Asset Income ETF) sits apart as the leverage outlier at approximately 33%, with a 10.2%-10.7% yield blending fixed income, equities, and split corporations.
The read you should take is this: chasing the highest yield in this peer group means accepting the most concentrated sector exposure. Because both streams feed the result, total return, not yield alone, is the correct lens for judging any fund in this category.
When big ASX news breaks, our subscribers know first
What separates sustainable yield from capital erosion
The reputation problem is real, and plenty of covered call products deserve it. What separates these six from the funds that quietly destroy capital comes down to three structural features working together.
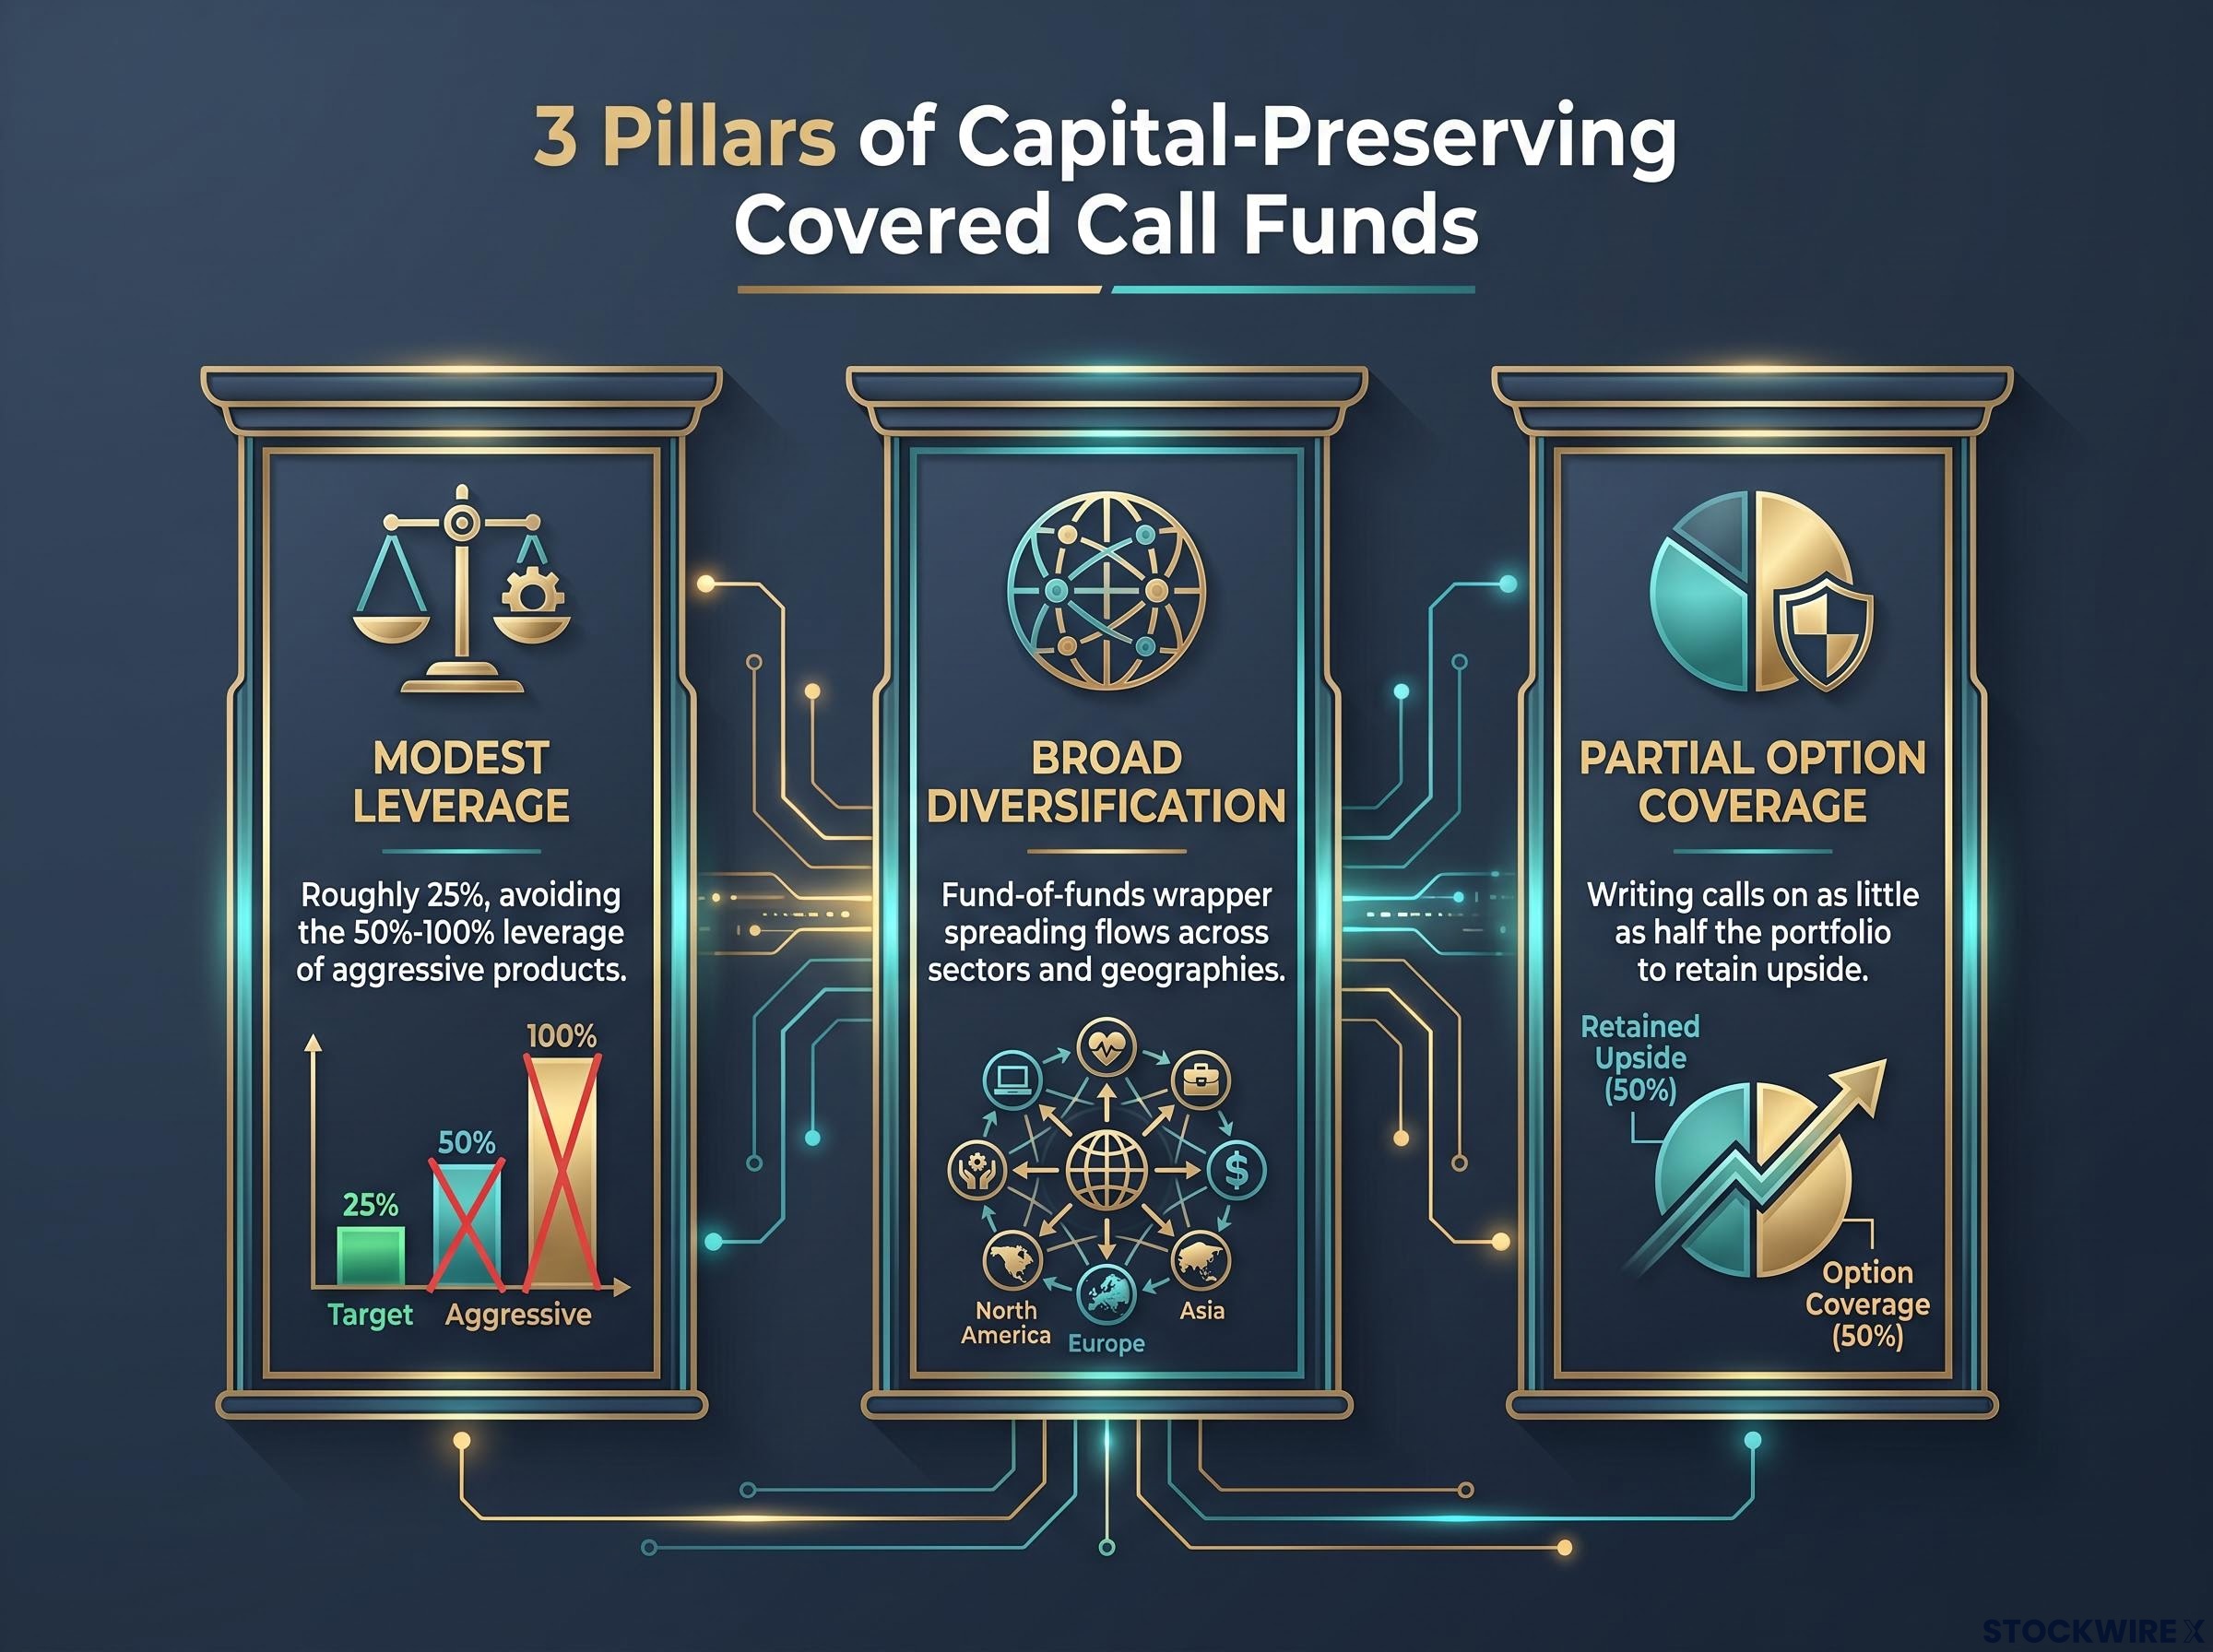
The first is modest leverage. At roughly 25% (with BMAX at 33%), these funds avoid the extreme drawdown risk that comes with the 50%-100% leverage used by more aggressive products. The second is broad diversification through the fund-of-funds wrapper, which spreads option-writing and dividend flows across sectors and geographies rather than leaning on a handful of volatile stocks.
The third is partial option coverage. The more sustainable funds write calls on only a portion of the portfolio, sometimes as little as half. That leaves a meaningful slice unoptioned, so the fund keeps participating when equity markets rally. Over the long run, that retained upside is what supports the NAV.
The distribution records give you the clearest evidence of discipline. Here is how the group compares.
| Fund | Distribution Growth Since Inception | Leverage | Yield Range |
|---|---|---|---|
| HDIV | 65.11% (approx. 5 years) | ~25% | 9.7%-9.8% |
| QQCL | ~26% | ~25% | 13.5%-13.6% |
| BMAX | ~30% (approx. 4 years) | ~33% | 10.2%-10.7% |
| HDIF | 27.12% | ~25% | Not verified |
| USCL | ~8.7% | ~25% | Not verified |
| HHLD | Not verified | ~25% | Not verified |
HDIV’s 65.11% cumulative distribution growth over roughly five years is the single strongest piece of evidence that a fund in this group has maintained payout discipline through a full cycle. BMAX has grown distributions approximately 30% over four years, close to 7% annually, while QQCL and HDIF sit near 26% and 27.12% respectively. Weigh those histories carefully: a long track record of rising distributions is harder to fake than a high current yield.
For contrast, the peer fund HYLD cut its distribution in 2023, dropping the payout from roughly $0.14 to $0.12 per unit. That is what undisciplined payout management looks like in practice, and it is the failure mode the three structural features above are designed to avoid.
When the yield becomes a return of capital problem
Return of capital (ROC) is the mechanism that turns a high yield into a slow bleed. It happens when a fund pays out more than its portfolio actually earns, so part of the distribution is simply your own money handed back to you.
The danger is that it stays invisible in the percentage. If a fund returns capital, the unit NAV falls over time, which means future dollar distributions can shrink even while the headline yield looks steady, because the price in the denominator is falling too.
Commentary through 2025 and 2026 from sources including WealthNorth and MoneySense has flagged this dynamic as present in certain high-yield covered call products. The lesson for you is to check whether distributions are being funded by genuine earnings or by ROC before trusting the yield figure.
Fund-by-fund breakdown: mandate, geography, and cost
Treating these six as interchangeable yield vehicles is the most common mistake. Each carries a distinct mandate, and the right one depends on the portfolio role you are trying to fill.
Ranked from highest yield to lowest, with the mandate attached:
- QQCL (13.5%-13.6%): Nasdaq-100 replication, roughly 60% technology, index-tracking.
- BMAX (10.2%-10.7%): multi-asset blend of fixed income, equities, and split corporations.
- HDIV (9.7%-9.8%): Canadian-tilted fund-of-funds, approximately 75% Canadian and 25% American.
HDIF, HHLD, and USCL round out the group, though current yields for those three were not fully verified in public sources as of late September 2026.
Geography and cost separate them further. Here is the structural comparison.
| Fund | Issuer | Geographic Focus | Structure | Approx. MER Range |
|---|---|---|---|---|
| HDIV | Hamilton | ~75% Canada, 25% US | Fund-of-funds | 0.97%-1.88% |
| QQCL | Global X | US (Nasdaq-100) | Index-tracking | 1.71%-1.82% |
| BMAX | Brompton | North America | Multi-asset fund-of-funds | 1.20%-2.35% |
| USCL | Global X / Brompton (sources conflict) | US (S&P 500) | Index-tracking | Not verified |
| HHLD | Hamilton | US only | Fund-of-funds | Not verified |
| HDIF | Harvest | North America | Fund-of-funds | Not verified |
The cost spread is wider than it looks. HDIV reports an MER as low as 0.97% on its September 2026 ETF Facts document, while QQCL runs 1.71%-1.82%. Those figures bury the leverage financing cost inside the headline number, so cheap-looking funds are not always as cheap as they appear.
The deeper split is between index-trackers and actively assembled portfolios. QQCL replicates the Nasdaq-100 and USCL replicates the S&P 500, meaning their character is dictated by the benchmark. HDIV, BMAX, HDIF, and HHLD are assembled from other funds, giving the manager discretion over the mix.
That brings the technology question into focus. QQCL’s roughly 60% technology weighting is a fundamentally different portfolio from USCL’s 37%-38%, built on the broader S&P 500. This is not a minor distinction. Before you select on yield, you need to decide how much technology concentration belongs in your income allocation, because the two funds behave very differently in a tech-led drawdown.
HDIV’s NAV sat at roughly $23.19 on 29 September 2026, QQCL near $27.78-$28.40, and BMAX between $14.71 and $14.85. Match the mandate to the portfolio role first, then let yield and price inform the final choice.
Where covered calls work, and where they do not
Understanding the funds is only half the decision. The other half is situating them honestly inside the market cycle, because the answer to whether you should own them depends on who you are and what you believe about the next two years.
Covered call fund-of-funds behave differently across three regimes:
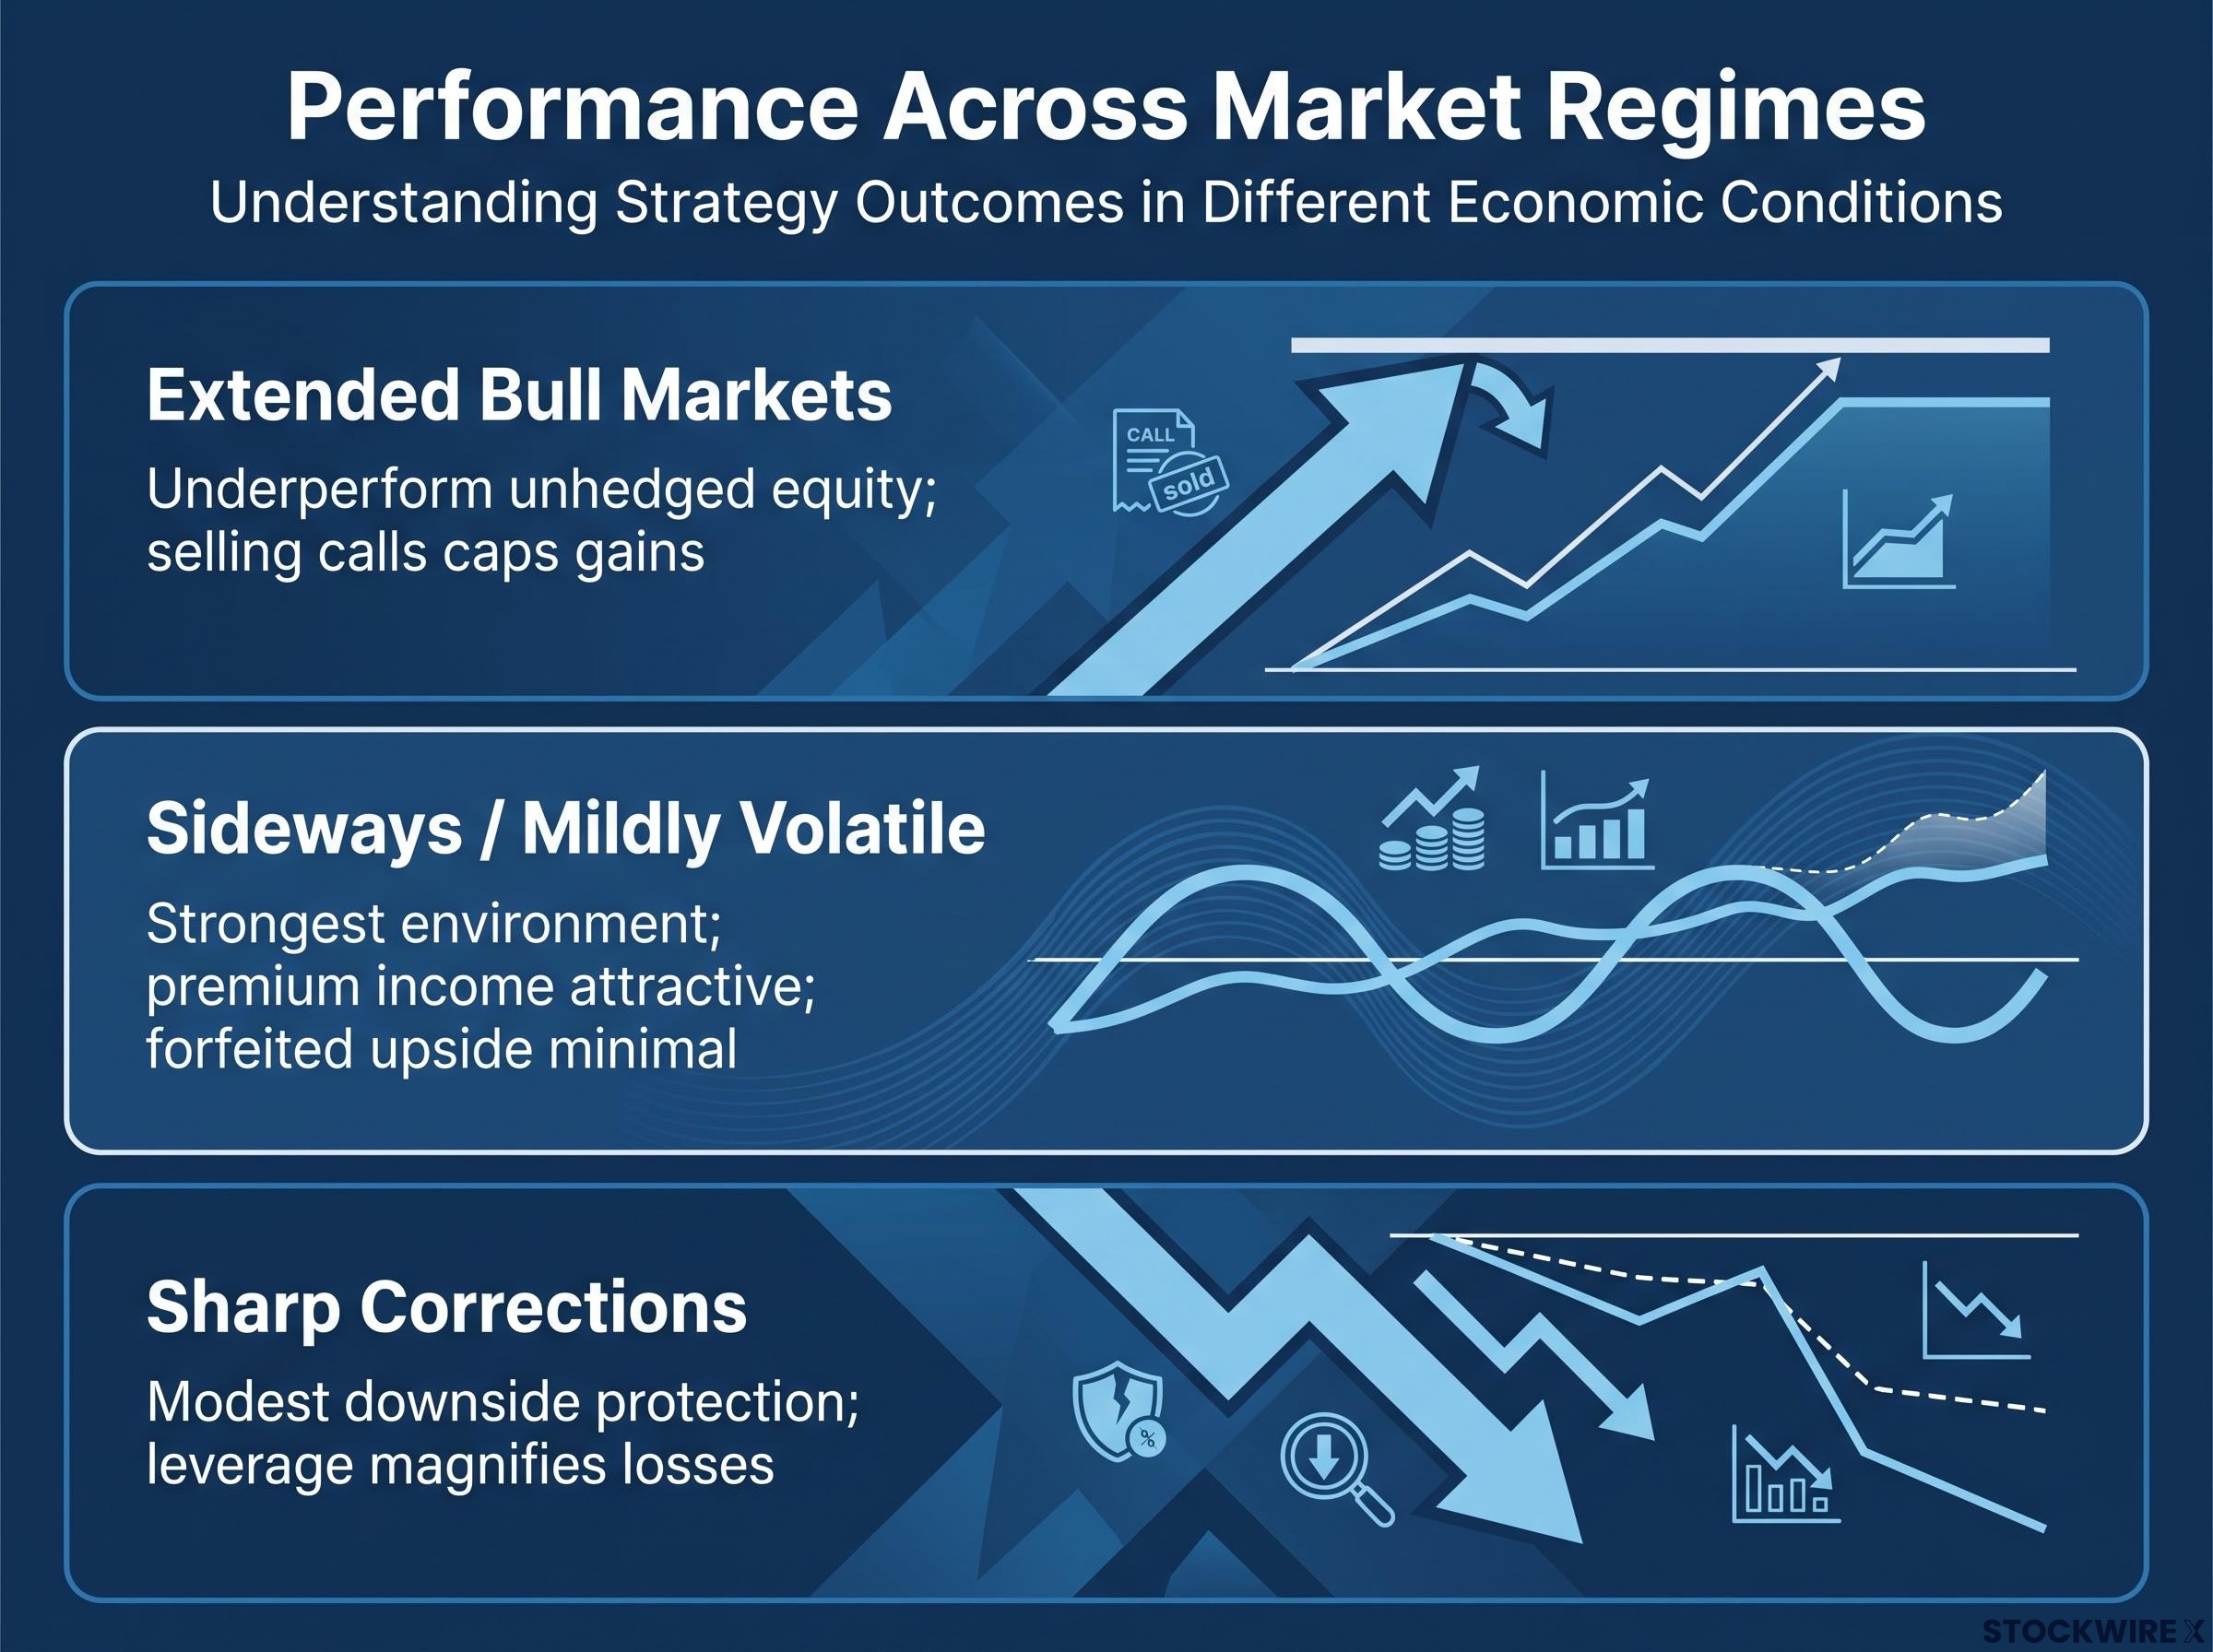
- Extended bull markets: they tend to underperform unhedged equity, because selling calls caps gains beyond the strike price and systematically forgoes the most profitable part of a rally.
- Sideways or mildly volatile markets: this is their strongest environment, where premium income is attractive and the forfeited upside is minimal.
- Sharp corrections: they offer only modest downside protection, and leverage magnifies losses alongside gains.
That third scenario deserves attention from anyone drawing income. This is sequence-of-returns risk: a sharp correction combined with steady, high distributions can permanently impair capital, because you are selling units into a falling market to fund the payout.
The upside cap is not always punishing, though. QQCL posted a year-to-date total return somewhere between 18% and 26% (sources conflict on the exact figure) through late September 2026, proof that these funds can participate meaningfully in a bull run even while giving up the top of it.
Tax treatment is the quieter consideration. In non-registered accounts, option premiums are typically taxed as ordinary income rather than at favourable capital gains rates, and ROC distributions lower your cost base, deferring a larger capital gains bill to the day you sell. Account type is therefore a material part of the decision, not an afterthought.
These are specialised income tools, not equity substitutes. That distinction should drive the allocation decision more than any yield figure.
The investor profile is specific. These funds suit retirees and cash-flow-focused investors who prioritise high regular distributions, accept lower long-term capital growth, and are not relying on the fund to replicate full equity upside. If you are in the accumulation phase with a 20-year horizon and your goal is growing wealth, the systematic upside cap means these belong as satellites, not core holdings, regardless of how well their NAV has held.
Where these six funds fit in a forward-looking income allocation
The most defensible way to use these funds is as a dedicated income sleeve inside a broader portfolio, sized according to how much of your total return must come from cash distributions rather than growth. That framing turns fund selection into a mandate-matching exercise rather than a yield contest.
The group splits naturally into two clusters:
- Income-first mandate: HDIV, BMAX, and HDIF, favoured for their broader diversification and, in HDIV’s case, the longer track record.
- Index-replication character: QQCL and USCL, defined by their benchmarks and higher technology weighting, suited to investors who want more equity-like upside alongside income.
HDIV makes the strongest historical case for NAV sustainability, with a five-year record and 65.11% cumulative distribution growth. QQCL counters with a one-year total return of approximately 29.32% through late September and early October 2026, evidence that yield and total return are not mutually exclusive even inside a technology-heavy structure.
The takeaway is that the best five-year track record does not automatically mean the best fund for you. HDIV is not the right choice for an investor chasing maximum yield or maximum technology exposure, and that is a mandate decision, not a quality one.
Rate sensitivity and the embedded leverage cost
Leverage financing costs are absorbed into the ongoing MER rather than shown as a separate line, which makes them invisible to a casual fee comparison. That hidden cost is what ties these funds to the interest rate environment.
In a rate-plateau or rate-declining setting, leverage costs stabilise or fall, improving net yield. In a rising-rate environment, the reverse applies and net yields compress independently of market performance.
Because reported figures vary so widely for the same fund (HDIV’s MER appears anywhere from 0.97% to 2.55% across different documents), check the most recent annual management report or ETF Facts document for the current effective MER before committing.
This article is for informational purposes only and should not be considered financial advice. Investors should conduct their own research and consult with financial professionals before making investment decisions. Past performance does not guarantee future results, and financial projections are subject to market conditions and various risk factors.