Micron Technology is about to report quarterly revenue that, if it lands anywhere near consensus, will represent one of the most dramatic year-over-year expansions in the history of large-cap semiconductor earnings. The question is not whether the number is big. The question is whether the architecture driving it is durable, or whether investors are pricing a supercycle peak as if it were a new baseline.
With MU shares trading above $1,065 ahead of today’s print, the market has already priced an extraordinary outcome. Consensus revenue estimates cluster between $50.45 billion and $50.95 billion for fiscal Q4 2026, implying roughly 349-350% year-over-year growth.
Micron’s own guidance, issued in June 2026, called for $50.0 billion plus or minus $1.0 billion at an approximately 86% gross margin. The earnings call later today is the first moment investors will have to test whether the AI memory thesis is running ahead of underlying demand or just beginning to compound.
This piece unpacks what is actually driving those projections, what Micron’s results tell you about Samsung and SK Hynix, and the three variables in the forward guidance that will tell you more than the headline number itself.
Why AI infrastructure is doing what no prior compute cycle did to memory demand
A 349% revenue jump looks like an anomaly until you trace where the demand actually comes from. Then it starts to look less like a spike and more like arithmetic.
The demand chain begins with training. Building large language models requires clusters of high-end accelerators, chiefly Nvidia H100 and B100 class chips and AMD MI300 class chips. Each of these accelerators carries multiple stacks of high-bandwidth memory (HBM), the specialised memory soldered directly onto the chip to feed data at the speeds AI workloads demand, with hundreds of gigabytes of capacity per node. Every additional training accelerator deployed pulls a proportional amount of HBM with it.
Citi’s system-level modelling of HBM demand durability projects a 434% surge in per-system memory capacity as GPU counts scale from 72 to 576 accelerators per cluster, a figure that reinforces why per-node escalation and per-system scaling are additive rather than competing tailwinds for memory revenue.
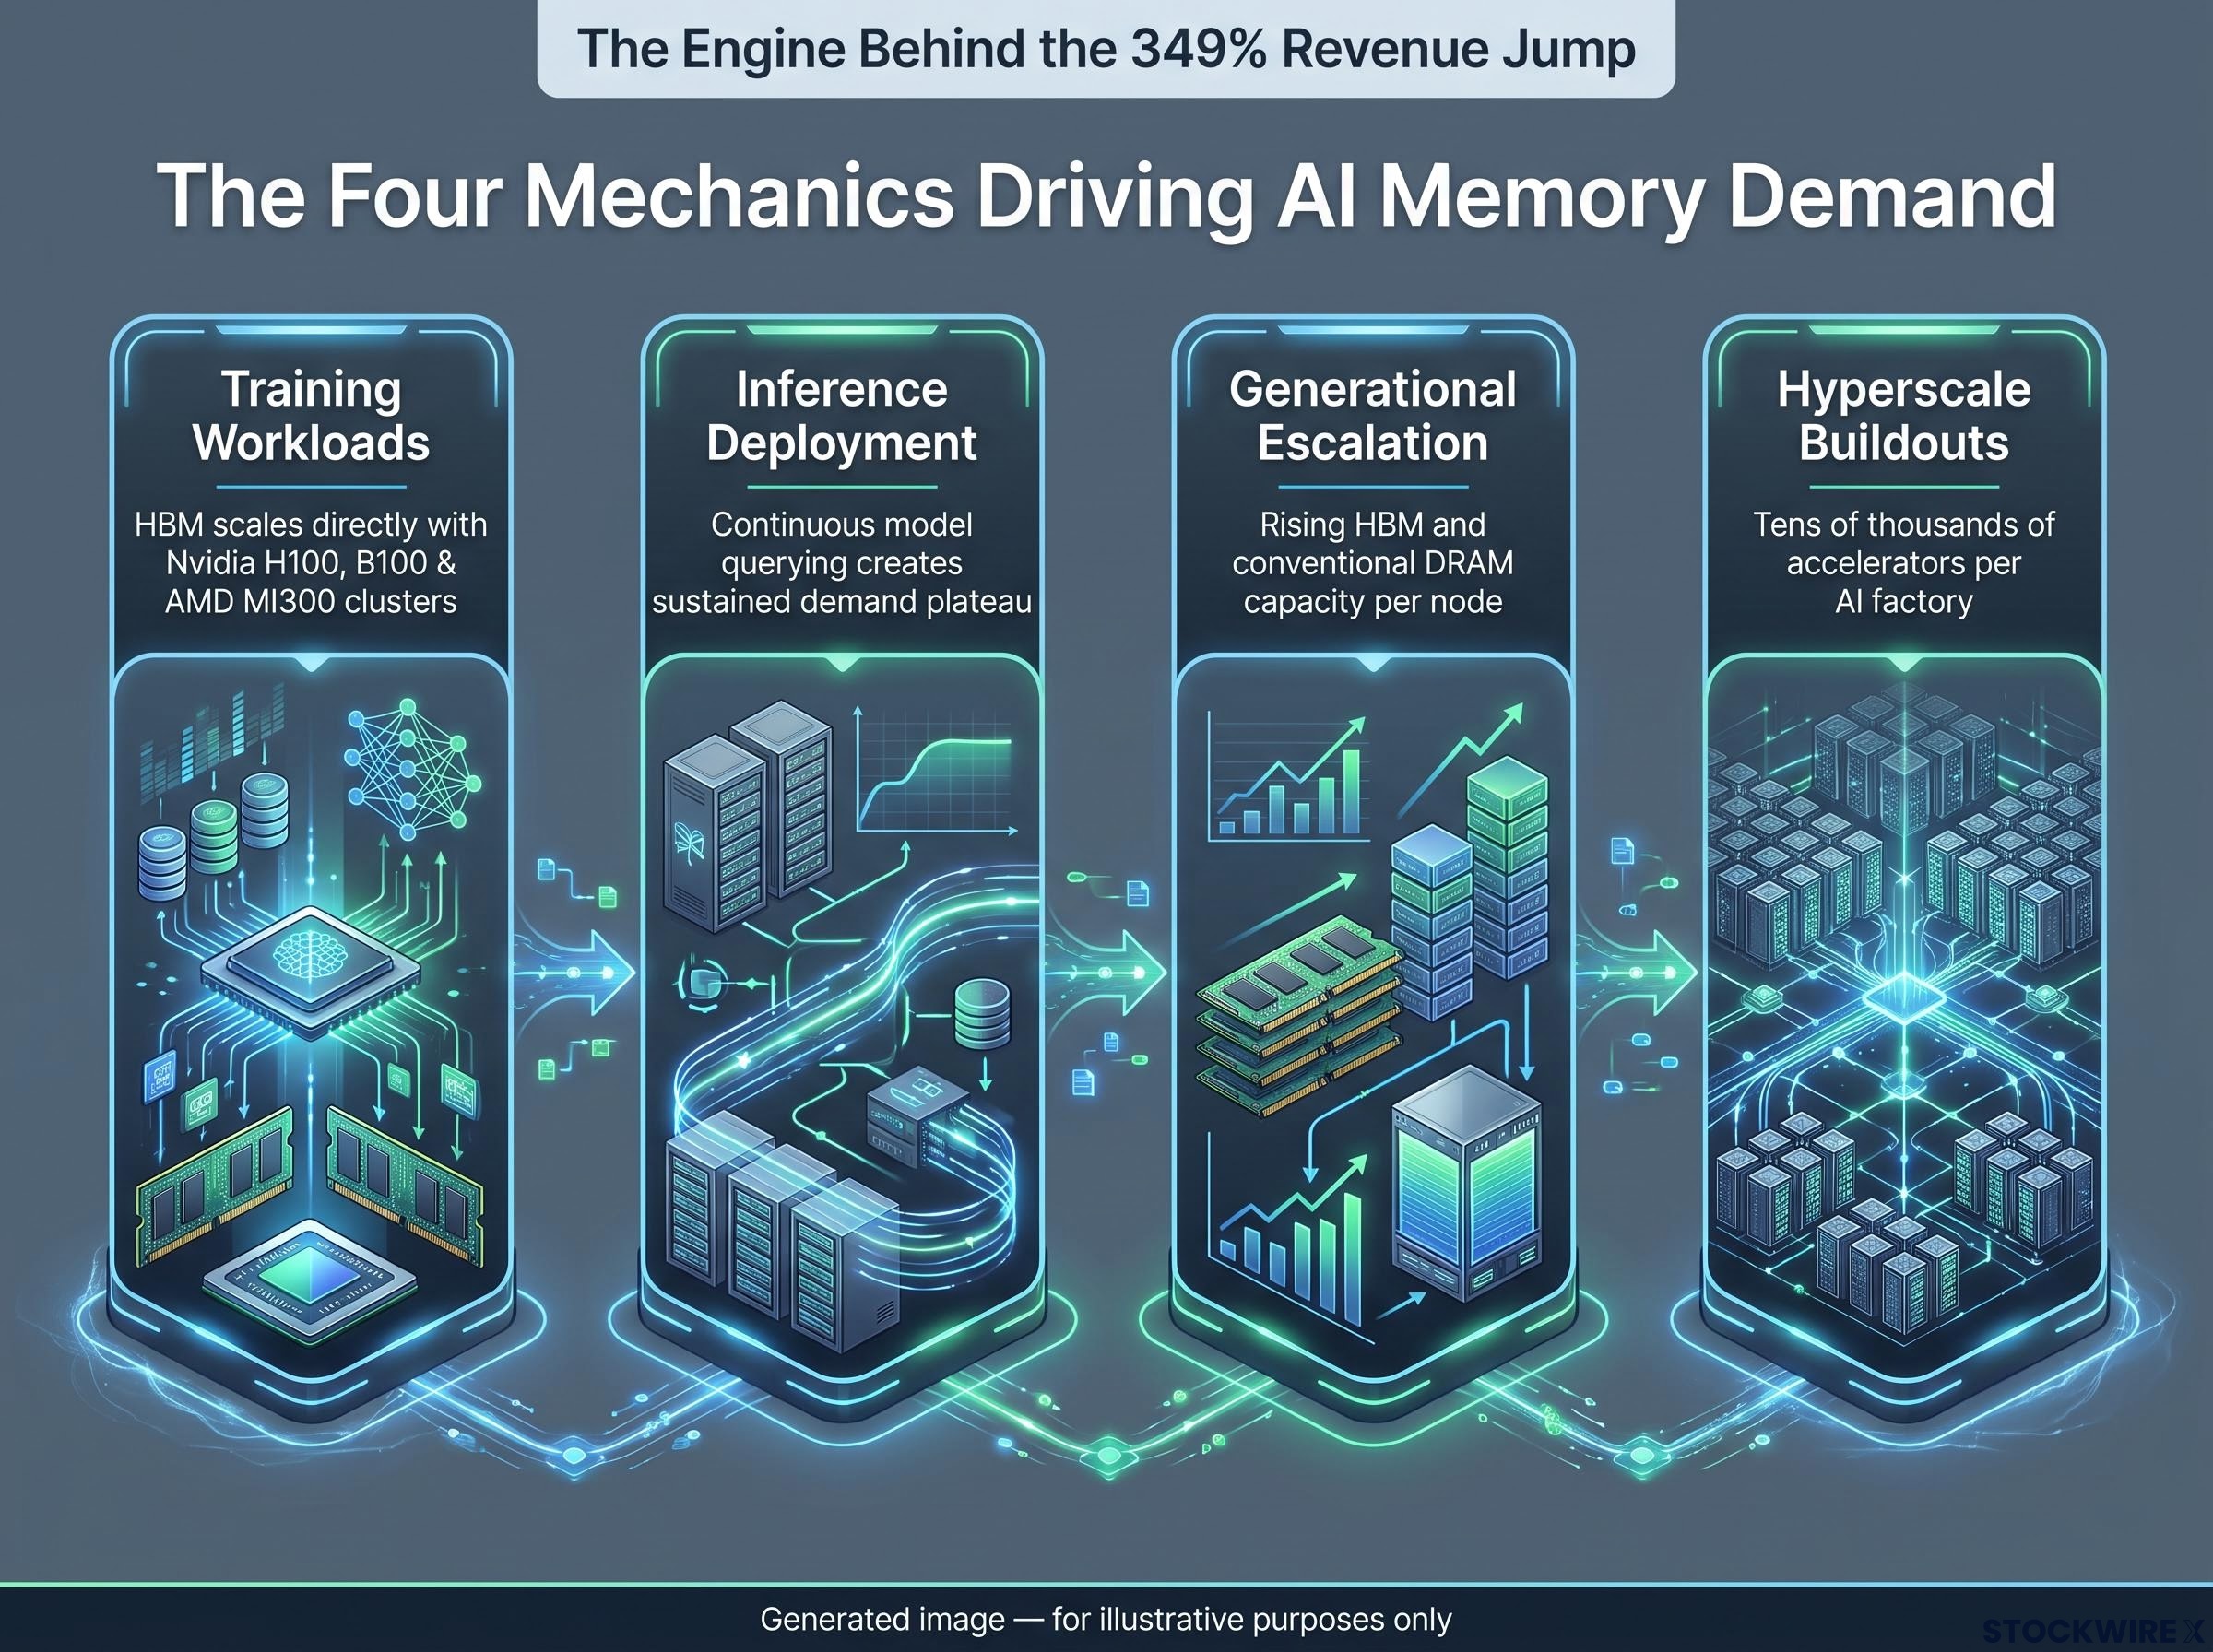
The four mechanics driving the surge break down cleanly:
- Training workloads: Each GPU cluster used to train a foundation model demands HBM in direct proportion to the number of accelerators, so memory scales with the size of the training run.
- Inference deployment: Serving models to users is not a one-off event; it runs continuously on HBM-equipped chips, extending demand well beyond the initial training phase.
- Generational per-node escalation: Each new GPU generation increases HBM capacity per chip and conventional DRAM per node, so memory demand per accelerator is rising, not holding flat.
- Hyperscale AI factory buildouts: Cloud providers are assembling dedicated facilities of tens of thousands of accelerators, and memory requirements compound across every rack.
There is a second coupling most headline coverage misses. System designers pair HBM with large pools of conventional DRAM to handle wider working sets and caching, so ordinary DRAM demand rises alongside HBM as clusters scale out.
That compounding structure is the point. Even modest growth in accelerator deployments translates into outsized memory revenue, which is why you should read the headline number as neither a one-time spike nor a permanent new level until you understand the mechanic underneath it.
From training to inference: why the demand wave does not end with the model
A training run finishes. A deployed model does not.
This is the distinction that separates the current cycle from a simple hardware build-out. Training a frontier model is a discrete, capital-intensive event with a beginning and an end. Inference, the act of running that model to answer queries, is continuous, and it runs on the same HBM-hungry silicon.
Serving billions of daily queries across HBM-equipped inference chips creates a structurally longer demand signal than training alone. According to semiconductor analysts including those at SemiAnalysis, this shift from one-off training to sustained inference is what turns a demand pulse into a demand plateau, and it is the piece of the thesis that most directly supports Micron’s guidance holding beyond a single quarter.
When big ASX news breaks, our subscribers know first
What the numbers on the table actually show
The consensus estimates cluster tightly, which tells you analysts broadly agree on where revenue lands. The disagreement, and the more interesting figure, sits in the margin line.
Here is where the expectations sit against Micron’s own guidance.
| Metric | Micron Guidance | Consensus Low | Consensus Mid | Consensus High |
|---|---|---|---|---|
| Revenue | $50.0B ± $1.0B | $50.45B | $50.75B | $50.95B |
| Adjusted EPS | $31.00 ± $1.00 | $31.16 | $31.45 | $31.63 |
| Gross margin | ~86% | Qualitative | Qualitative | Qualitative |
The revenue consensus runs from $50.45 billion (Investing.com) through $50.75 billion (Scanx Trade) to $50.95 billion (Investopedia, citing Visible Alpha). Adjusted EPS estimates span $31.16 to $31.63. Micron’s June guidance of $50.0 billion plus or minus $1.0 billion revenue, GAAP EPS of $30.73 plus or minus $1.00, and non-GAAP EPS of $31.00 plus or minus $1.00 sits right inside that band.
The year-over-year comparison is where the scale registers.
The prior-year benchmark Micron reported adjusted EPS of $3.03 in the comparable prior-year quarter. Consensus for fiscal Q4 2026 sits near a $31.40 midpoint. That is roughly 938% EPS growth, more than ten times the prior-year level.
Revenue growth of 349-350% is the number that draws the headlines. The 86% gross margin is the number that should hold your attention.
At that margin, on that revenue base, Micron is not competing on price in its highest-value product lines. It is supply-constraining a product the market needs urgently, and pricing power on that scale is what distinguishes a structural repricing of memory from an ordinary cyclical revenue spike. That distinction is the single most consequential variable for whether the bull case survives into FY2027, and it is what investors with a multi-quarter horizon should hold onto when the print lands.
The HBM market trajectory that underpins Micron’s pricing power extends beyond the current supply shortage: Micron itself projects the addressable market growing from approximately $35 billion in 2025 to $100 billion by 2028, a 40% CAGR that the company has reportedly pulled forward by two years as AI buildout accelerates.
One housekeeping note. Sources differ on the exact release date, with one citing 29 September 2026 after market close and Micron’s investor relations materials indicating 30 September 2026. Verify against the confirmed release.
Micron’s results as a signal for Samsung and SK Hynix
Micron is not simply one of three large DRAM producers. It is the one that reports first and talks most, which is what makes tonight’s call a sector-level read rather than a company-level one.
Its reporting calendar frequently positions it ahead of or between Samsung Electronics and SK Hynix disclosures. Just as important, Micron provides detailed forward guidance: revenue ranges, gross-margin expectations, and demand commentary. That combination gives investors an early directional signal on the memory cycle’s phase before the two Korean giants report.
The three producers occupy distinct positions, though the figures here are pre-2025 historical patterns rather than current share data, which is not available. SK Hynix has led HBM by volume. Samsung has sat second in HBM while leading overall DRAM volume. Micron has ranked third in HBM and among the top three DRAM vendors globally. All three are exposed to the same cluster-buildout demand and, eventually, the same oversupply risk.
That shared exposure is why the call’s tone matters as much as its numbers.
The memory supercycle mechanics now in play differ structurally from prior cycles partly because SK Hynix has shifted to foundry-style multi-year supply agreements extending through 2028-2030, a contractual regime change that makes the demand signal more durable and the capacity response slower than in any previous DRAM upcycle.
- Bull-case read-through: A print at or above guidance suggests similar pricing and utilisation conditions run across the DRAM and HBM supply chain, a positive signal for all three producers. Confident commentary on multi-year HBM tightness would extend that read further.
- Bear-case read-through: Any deceleration in sequential growth, or a cautious tone on early FY2027 visibility, would raise concerns about a peaking cycle. Guarded remarks on customer ordering pace or inventory conditions would likely be read as a negative across the whole memory group.
What Micron says about customer ordering and forward visibility will tell Samsung and SK Hynix investors as much as it tells Micron investors, because all three read from the same underlying demand signal. If you hold or are evaluating any of the three, this call is your data too.
The 2017-2018 precedent: what the last supercycle tells you about timing
The most recent memory supercycle offers a calibration point, not a prophecy.
The 2017-2018 DRAM and NAND cycle was driven by data-centre expansion, smartphone adoption, and constrained supply. It produced strong demand, tight capacity, and record margins. Then it ended the way memory cycles have tended to end: producers added capacity aggressively, supply caught up, and prices compressed.
The parallel to the present is structural, not deterministic. All three major producers are again committing heavy capital expenditure to HBM and advanced DRAM expansion, which is the latent supply risk that has historically closed prior upcycles. The lesson is not that this cycle ends the same way. It is that cycle timing and capacity signalling matter as much as the demand thesis, and both deserve weight in how you read tonight’s call.
What to watch in the guidance beyond the headline
The Q4 FY2026 headline is already baked into a share price above $1,065. The revenue figure will be known within hours, and consensus has effectively pre-answered it. The forward guidance is where the genuinely new information lives.
Structure your listening around five specific cues, ordered from most immediate to most structural:
- Q1 FY2027 revenue guidance range: The primary data point, since it is the first figure the market has not already priced in.
- Gross margin trajectory into FY2027: Analysts widely regard the 86% margin as unlikely to be permanent, so management’s tone on sustainability is the key signal.
- Customer concentration and order breadth: Whether HBM demand is broadening across more customers or staying concentrated in a handful of hyperscalers.
- Inventory and lead time signals: Commentary on customer inventory or order lead times is a forward-looking demand indicator, not a historical accounting note.
- Capex and capacity expansion disclosures: The pace of Micron’s own capacity commitments relative to AI buildout rates shapes the medium-term pricing picture.
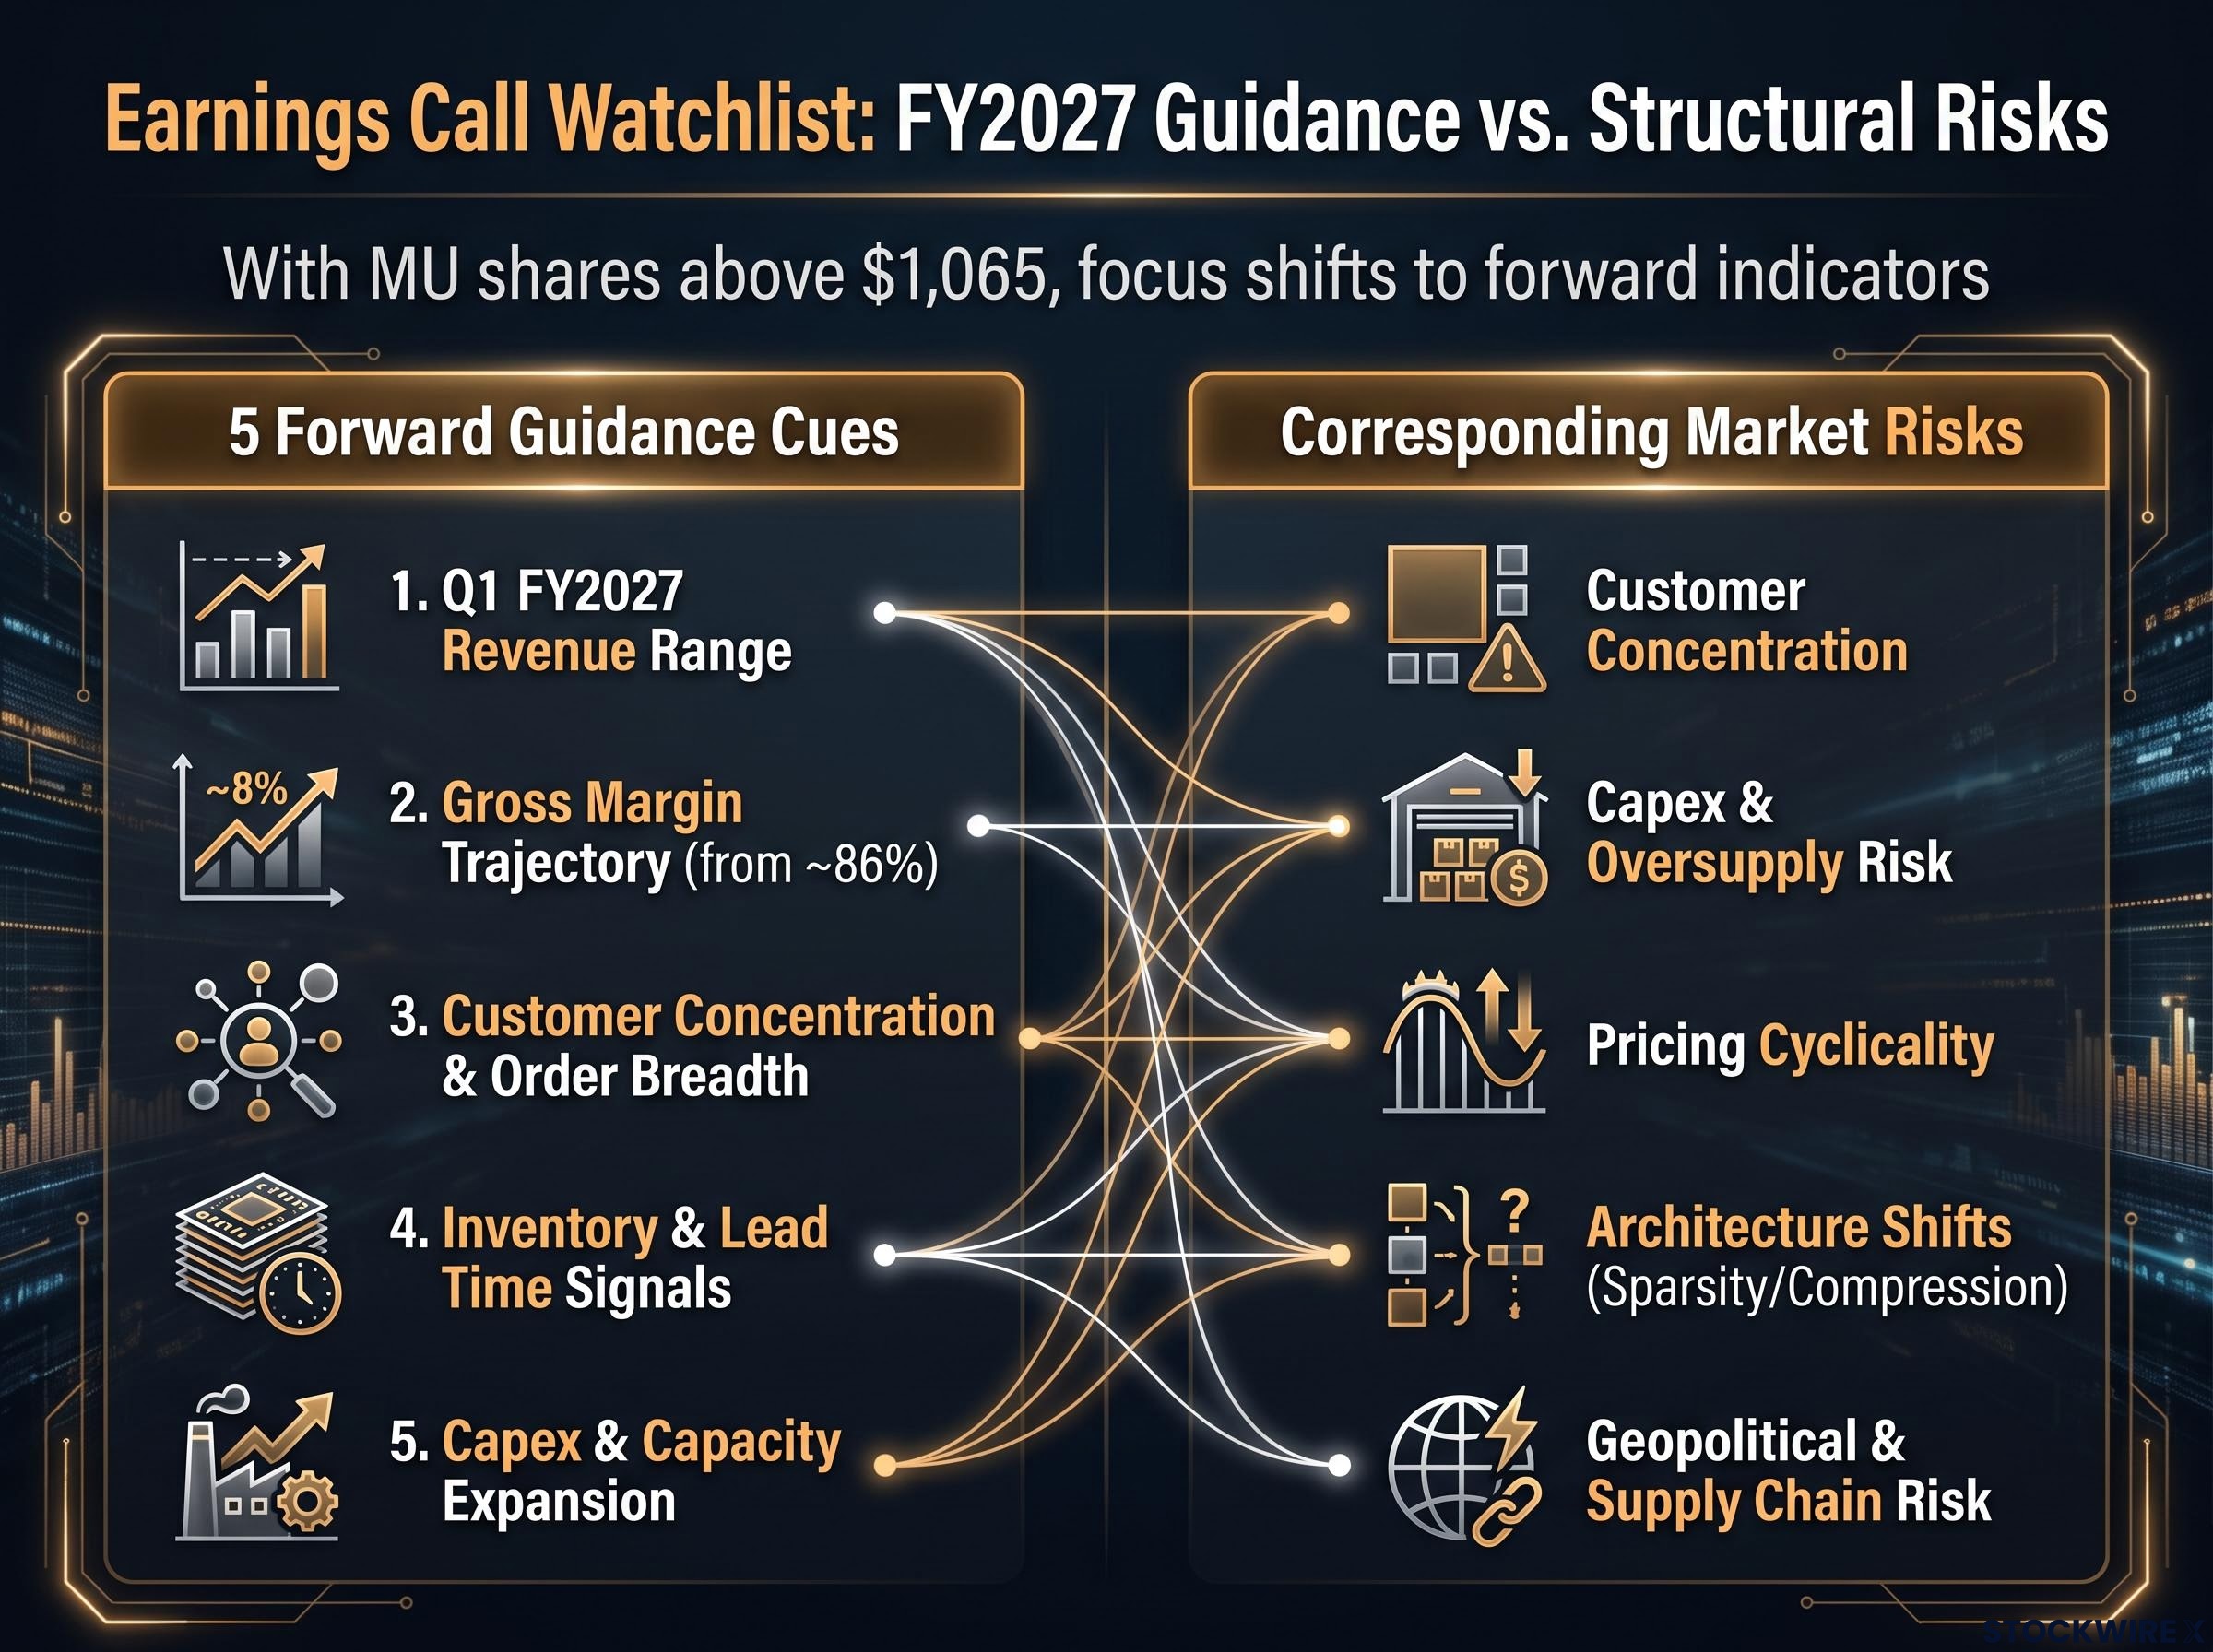
These map onto the five structural risks the research identifies: customer concentration, capex and oversupply risk, pricing and margin cyclicality, technology and architecture shifts, and geopolitical and supply-chain risk. That fourth risk deserves flagging. Efficiency gains in model design, such as sparsity techniques and compression that reduce memory per unit of compute, could decelerate HBM demand relative to current extrapolations without any collapse in AI adoption.
Sentiment toward the technology sector had turned cautious ahead of the print. Commentary from 247wallst noted that even if guidance “may look weak,” the full-year revenue and EPS growth projections remain extraordinary.
The frame that matters tonight At a share price above $1,065, the market has already answered the Q4 question. The call is really about Q1 FY2027 and beyond.
Here is the interpretive lens to apply in real time. If the Q1 FY2027 guidance midpoint implies sequential gross margin deceleration, read that not as a one-quarter wobble but as the opening signal that the pricing premium on constrained HBM supply is beginning to normalise. That carries multi-quarter implications for all three major producers, not just Micron.
Past performance does not guarantee future results. Financial projections are subject to market conditions and various risk factors. These statements are speculative and subject to change based on market developments and company performance.
After the print, three things that will settle the bull case or complicate it
The EPS number will beat or miss by a dollar or so, and within a market where MU trades above $1,000, that beat or miss is noise. The forward demand narrative is the signal. Three variables will resolve it.
- Q1 FY2027 guidance tone: Expanding, flat, or decelerating. This is the clearest read on whether demand is still compounding or approaching a plateau.
- Gross margin trajectory commentary: Management’s framing of margin sustainability tells you whether the pricing premium on scarce HBM is holding or starting to erode.
- HBM demand breadth: Any signal on whether HBM orders are broadening across more customers or staying concentrated in a few hyperscalers, which speaks directly to demand durability.
Treat the 2017-2018 cycle as a calibration tool, not a forecast. That cycle ended because capacity caught up with demand. All three producers are again expanding HBM and advanced DRAM capacity, so the open question is whether AI cluster buildouts are growing fast enough to absorb the supply coming online. Layer in the architecture risk, where model-efficiency gains could soften memory demand, and the geopolitical risk, where manufacturing concentration in a few countries can disrupt supply and planning in either direction.
SK Hynix’s $29 billion Nasdaq IPO, targeting a 60% production capacity expansion by 2030, illustrates the capacity expansion risk that has historically ended every prior memory upcycle: the same capital commitment that validates the demand thesis simultaneously creates the supply overhang that eventually compresses margins.
Go into this call knowing which three variables to weight, and you come out with a clearer position thesis than someone reacting to the headline. The same three variables will resolve the structural-versus-cyclical question every time Micron, Samsung, or SK Hynix reports over the coming quarters.
This article is for informational purposes only and should not be considered financial advice. Investors should conduct their own research and consult with financial professionals before making investment decisions.