The Reserve Bank of Australia lifted the cash rate to 4.60% on 29 September 2026, its highest level since October 2011. On the very same day, the Australian Bureau of Statistics (ABS) published building approvals data showing total dwellings had collapsed 6.1% in a single month.
Two releases, landing together, pointing in opposite directions. One says the economy still runs too hot. The other says a rate-sensitive sector is already buckling.
For anyone with a mortgage, a property investment, or exposure to the Australian Dollar, this contradiction is not academic. Mortgage repayments are consuming a growing share of household income, and inflation has re-accelerated to 4.0% after briefly softening in July, muddying any hope of a clean read.
This piece gives you a framework for interpreting the two competing signals: what the inflation data and property indicators are each saying, how they feed into the RBA’s decision-making, and what the outcome means for the AUD. Treat it as a tool for reading future data releases, not just a snapshot of today.
What the inflation data actually tell us about where the RBA stands
Follow the headline inflation numbers month by month and the shape of the problem becomes obvious. Annual headline CPI ran at 3.8% in June 2026, eased to 3.5% in July, then jumped back to 4.0% in the year to August, according to the ABS release dated 30 September 2026.
That July softening did real work at the time. It trimmed market expectations for further RBA tightening and briefly made a pause look plausible. August reversed a chunk of that optimism.
But the headline figure is not the number the RBA fixates on. Trimmed mean inflation, which strips out the largest price rises and falls to reveal the durable underlying trend, tells a steadier and more stubborn story.
Trimmed mean inflation strips out the largest price movements in both directions, leaving only the durable underlying trend the RBA uses to calibrate policy; because it removes fuel spikes and one-off administered price changes, it is structurally less volatile than the headline figure and far more predictive of the Board’s next move.
Underlying inflation held at 3.6% in August 2026, unchanged from July and still 60 basis points above the top of the RBA’s 2-3% target band.
That stability is the heart of the ambiguity. Headline inflation bounced around; underlying pressure did not move at all. The re-acceleration in the headline print was not matched by a re-acceleration in the measure the Board weights most heavily.
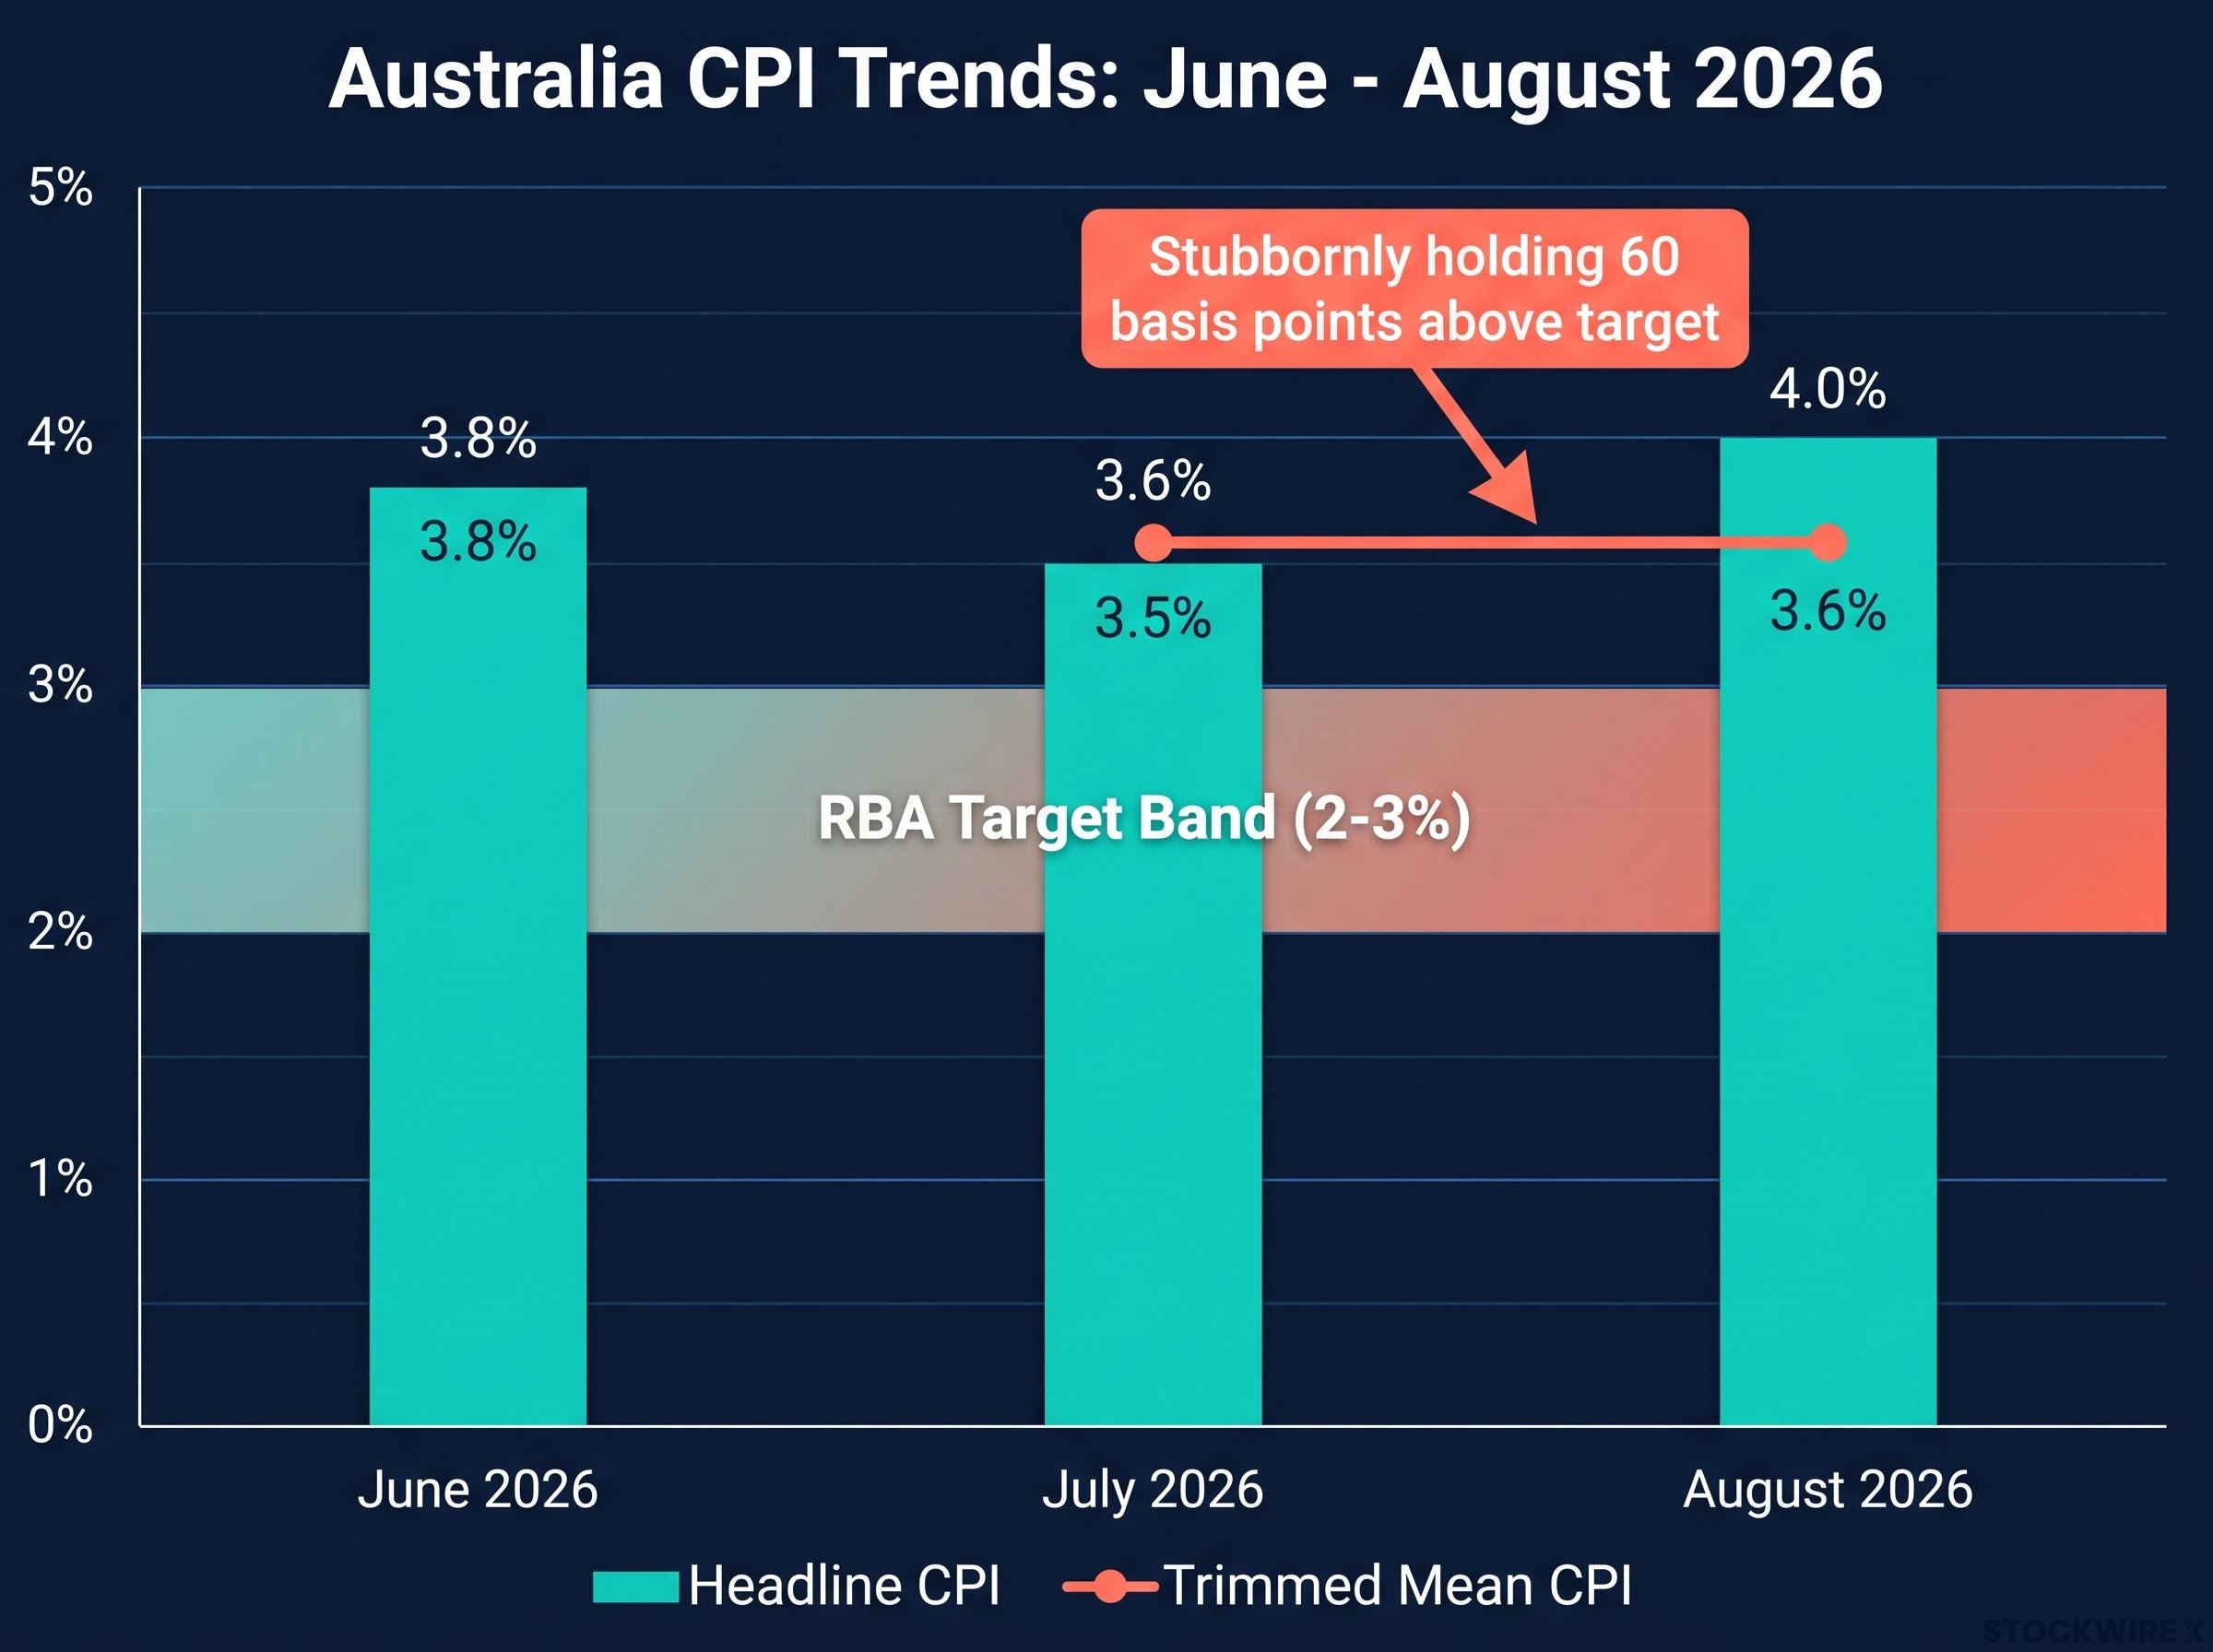
| Period | Headline CPI (annual) | Trimmed mean CPI (annual) |
|---|---|---|
| June 2026 | 3.8% | – |
| July 2026 | 3.5% | 3.6% |
| August 2026 | 4.0% | 3.6% |
Here is what that 3.6% figure means for you: even if the RBA does pause, inflation is nowhere near solved. Trimmed mean running 60 basis points above the top of the target band tells you any pause would be a hold, not a pivot toward cuts.
This also changes how you should read every future ABS release. Watch the trimmed mean line, not the headline, because that is where the RBA is watching. The next print will carry more weight than the last one.
When big ASX news breaks, our subscribers know first
How Australia’s property market became the canary in the rate-hike coal mine
Australian housing reacts to rate changes faster and harder than housing in most comparable economies, and the reasons are structural. Households here carry high mortgage debt relative to income, so every increase in the cash rate takes a larger bite out of disposable spending.
The mortgage structure amplifies it. A large share of Australian home loans sit on variable rates or short fixed terms, unlike the United States where 30-year fixed loans insulate borrowers for decades. When the RBA moves, repayments here reprice quickly, and demand for new construction cools soon after.
Mortgage application volumes across the major banks fell 15-28% from mid-2026 levels, a contraction driven not only by rate pressure but by legislated investor tax changes, illustrating that the building approval collapse and the credit demand collapse share a common cause but are reinforcing each other through separate channels.
Developers feel it first. Construction is capital-intensive and depends on credit, so higher cash rates lift the hurdle rate every project must clear to make sense.
What August’s approval figures reveal about developer behaviour under rate pressure
The August data show that pressure landing unevenly. Total dwellings approved fell 6.1% month-on-month to 16,953 in seasonally adjusted terms, following a 1.9% decline in July and reversing the 7.2% bounce recorded in June.
| Period | Total dwellings (m/m) | Private houses (m/m) | Dwellings excl. houses (m/m) |
|---|---|---|---|
| June 2026 | +7.2% | – | – |
| July 2026 | -1.9% | – | – |
| August 2026 | -6.1% | +3.7% | -21.2% |
The divergence inside that total is the real signal. Private sector houses actually rose 3.7%, while private dwellings excluding houses, the apartments and higher-density projects, cratered 21.2% in a single month.
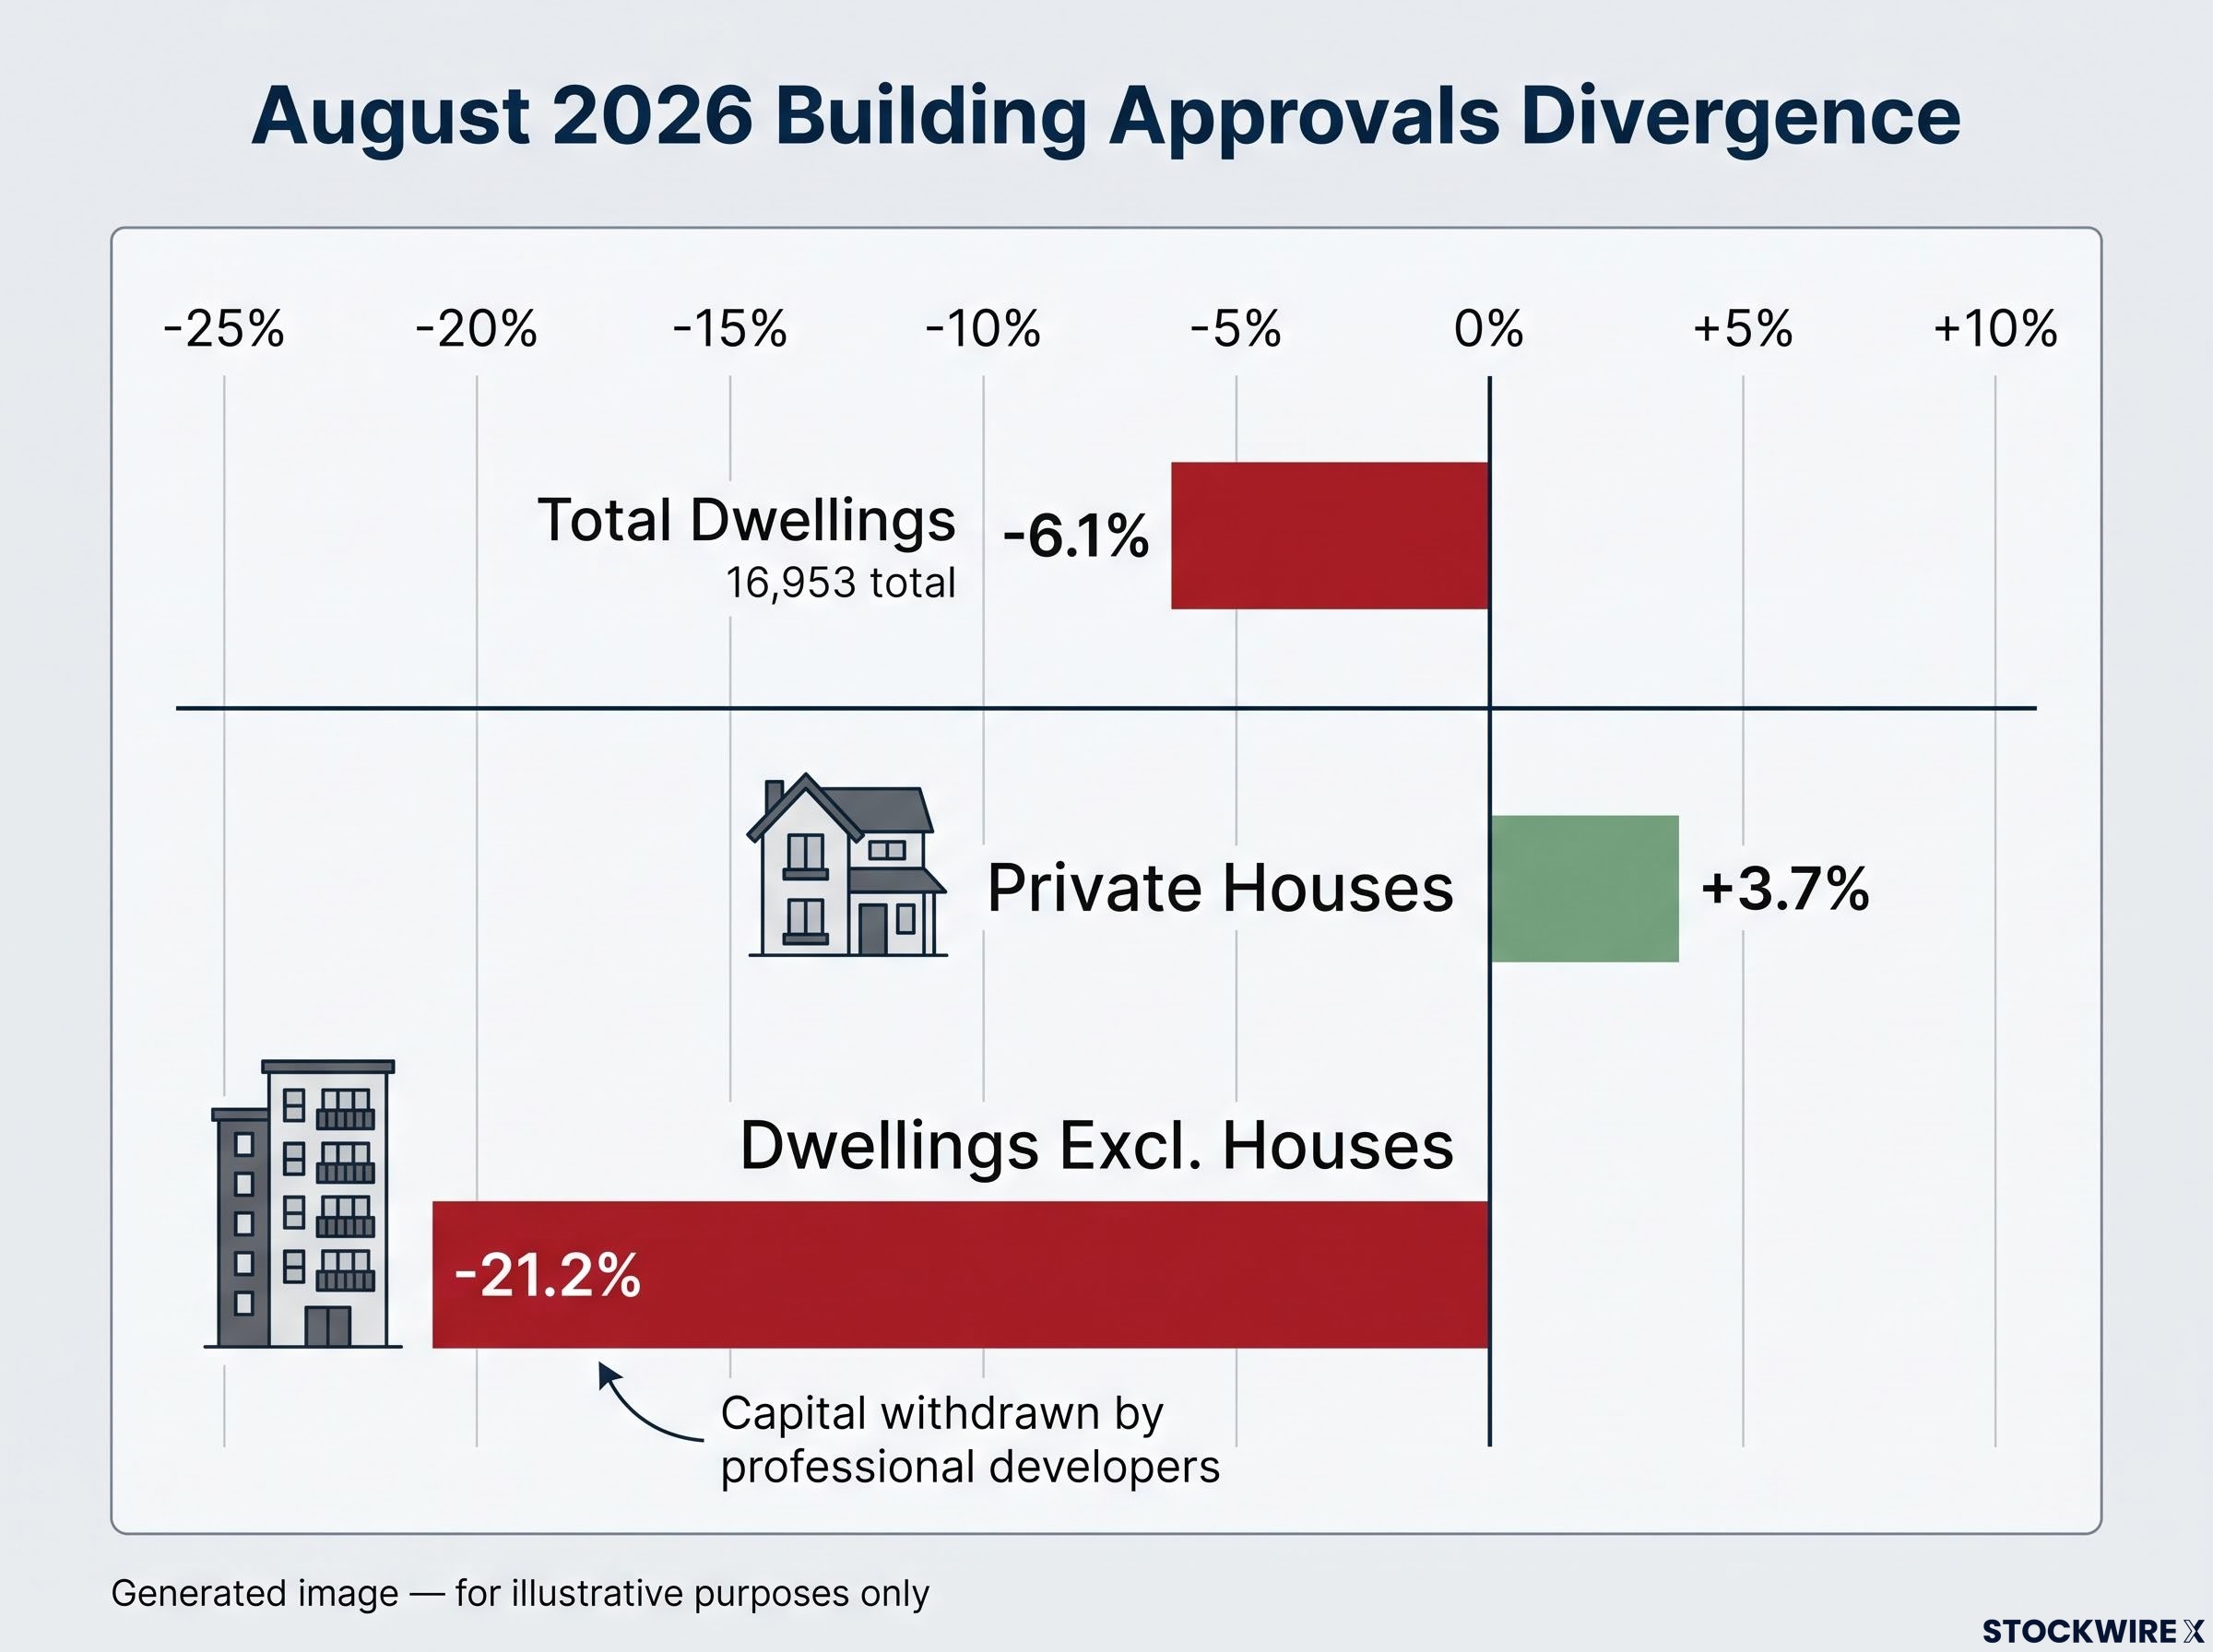
That split matters because higher-density projects are the ones professional developers model over years, not months. A 21.2% collapse tells you those developers have already concluded that the current rate environment makes many multi-dwelling projects unviable. That judgment carries more weight than any sentiment survey, because it is capital being withdrawn, not opinion being expressed.
The ABS Building Approvals data for August 2026 show that the 21.2% monthly collapse in private dwellings excluding houses was the steepest single-month decline in the higher-density segment since early 2024, underscoring how abruptly developer confidence has shifted.
Two consecutive monthly declines after June’s bounce is a pattern, not noise. And there is a lag worth noting: these approvals reflect decisions made before the 29 September hike to 4.60%. The pipeline is likely to weaken further before it stabilises.
For anyone holding property or tracking the housing market, building approvals are one of the most useful monthly releases you can follow. They lead future supply conditions and construction employment, giving you an early read on where the sector is heading.
The case for pausing versus the case for more hikes: where the evidence cuts
Both camps have genuine evidence, and it is worth laying each out with equal weight before the data starts tipping the balance.
The hawkish case, arguing more hikes remain possible, rests on:
- Headline CPI re-accelerated to 4.0% in August, undoing part of July’s improvement.
- Trimmed mean inflation has not budged from 3.6%, staying stubbornly above target.
- The RBA itself chose to hike on 29 September, signalling the Board still sees upside inflation risk.
- Sticky services inflation and strong labour-market conditions remain live threats.
The dovish or cautious case, arguing a prolonged pause is more likely, rests on:
- Monetary policy works with lags measured in quarters, and the full effect of past hikes has not yet arrived.
- The building sector is already visibly contracting, evidence that the restrictive stance is biting.
- July’s softer print suggests the disinflationary path may not be dead, just interrupted.
- Further tightening risks overshooting and deepening property and household stress.
Commerzbank analyst Volkmar Baur put the cautious view plainly after the July CPI data.
Softer Australian CPI figures suggested that market pricing of additional RBA rate increases was overstated, with a wait-and-see approach considered the more prudent course, according to Commerzbank’s Volkmar Baur.
History offers a useful lens here. In prior RBA cycles, and in comparable episodes at the Reserve Bank of New Zealand (RBNZ) in 2014-2015 and the Bank of Canada in 2017-2018, tightening cycles ended when cooling housing indicators combined with a clear downward trend in inflation.
The RBNZ paused and later reversed hikes as housing cooled and inflation undershot. The Bank of Canada shifted from tightening to an extended hold as housing showed fatigue and prices softened. In both cases, both conditions were present.
Australia currently has only one firmly in place. Housing is cooling convincingly. Inflation, by contrast, remains elevated and recently re-accelerated, so the disinflation half of that historical pattern is not yet confirmed.
That gap is where the analysis resolves. The more defensible position is to wait for both conditions, cooling housing and confirmed disinflation, before calling the cycle finished. Which means the next two monthly CPI releases matter more than almost any other data point on the calendar. Both camps agree future moves are explicitly data-dependent, hinging on whether August’s re-acceleration is confirmed or reversed.
What reduced rate hike expectations mean for the Australian Dollar
Everything above feeds directly into the currency, because the AUD is priced substantially off interest rate expectations. When markets expect fewer hikes, the story flows through a clear chain:
- Markets reduce expectations for further RBA rate increases.
- The anticipated yield advantage of Australian Dollar assets narrows relative to other currencies.
- Demand for the AUD softens, and the currency tends to weaken.
That mechanism played out visibly around the July CPI release. AUD/USD traded near 0.6950, a two-month low at the time, as reported by Commerzbank via FXStreet, after softer underlying inflation dampened tightening expectations. Note that this is a reference point from that period, not a current quote; updated September 2026 exchange rate data was not available at the time of writing.
Rate differential mechanics explain why an inflation surprise in Australia tends to strengthen the AUD rather than weaken it: capital markets read the surprise as raising the probability of an RBA hike, and the expected yield advantage of Australian Dollar assets attracts foreign capital before the policy decision is even made.
For you, a softer AUD is not an abstraction. If you hold overseas assets, have travel plans, or run a business dependent on imports, currency weakness driven by receding rate expectations is a direct, everyday cost.
Beyond rate differentials: the other forces shaping AUD right now
Domestic rate expectations are only part of the picture. The AUD is a commodity-linked currency, sensitive to global growth signals as much as to the RBA.
Around the same July period, Chinese PMI data failed to lend the AUD support. That matters because China is a dominant destination for Australian exports, so weak Chinese activity readings tend to drag on the currency independently of anything the RBA does.
These external forces can amplify or offset the domestic rate channel. A softer AUD from receding hike expectations could deepen further if Chinese data disappoints, or steady if global growth surprises to the upside. The AUD outlook is multi-variable, which is why anticipating it ahead of every RBA meeting and CPI release gives you an edge over reacting after the move.
What to watch before calling this cycle finished
This is one of the most genuinely contested RBA junctures in the current cycle: housing contracting, inflation elevated but volatile. Certainty is the wrong frame to bring to it. What you can do is track the three variables that will actually decide the next move.
- The trajectory of monthly CPI prints. Watch whether August’s re-acceleration to 4.0% is confirmed or reversed, and pay closest attention to the trimmed mean. This is what confirms or denies the disinflationary path the dovish case depends on.
- The path of building approvals in September and October. Further declines would show the transmission lag tightening and the restrictive stance biting harder, strengthening the argument that 4.60% is already restrictive enough.
- Any shift in the RBA’s forward guidance language. The Board’s own wording is the most direct signal of intention, and a change in tone often precedes a change in policy.
For investors wanting to understand exactly how the Board’s statement language translates into currency moves before any rate change occurs, our full explainer on RBA forward guidance and AUD walks through the specific hawkish-hold framework and identifies the 2-3 year bond yield as the most reliable real-time signal of whether a hawkish message has landed.
The value here is timing. These releases arrive on a publicly known schedule, so tracking them means you will know whether the next move is a pause or a hike before most commentators weigh in after the fact.
Even if the RBA pauses at the next meeting, the cumulative tightening to 4.60% will keep working through the economy for several more quarters, remaining a headwind for property and consumption regardless of the Board’s next decision.
If you carry a mortgage, hold property, or have AUD exposure, you have a direct financial stake in what comes next. These three variables turn this analysis into a practical monitoring framework.
This article is for informational purposes only and should not be considered financial advice. Investors should conduct their own research and consult with financial professionals before making investment decisions. Past performance does not guarantee future results. Financial projections are subject to market conditions and various risk factors.