Nearly 60% of the S&P 500’s stocks are trading more than 20% below their all-time highs, deep in bear-market territory. The index itself sits within touching distance of a record.
Both of those things are true at the same time, and that contradiction is the entire story. A handful of AI-linked megacaps are holding the index aloft while most of what sits beneath them has already broken down. Those megacaps carry their own problem: their reported earnings growth may not mean what the headline numbers suggest. Then, in the same week the index pressed on record territory, the Conference Board’s Consumer Confidence Index fell to 81.9, a 12-year low. Two signals pointing in opposite directions, and the gap between them cannot hold forever.
Here is what the breadth data, the earnings arithmetic, and the consumer signal actually tell you: where the pressure is building beneath the surface, why reported profits may be softer than they look, and what a resolution of this divergence would look like in practice.
The index is near a record. Most of its stocks are not.
Start with the headline breadth number, because it is the one most investors have not seen. According to MarketWatch and Dow Jones Market Data in September 2026, 59.2% of S&P 500 constituents were trading more than 20% below their all-time highs even as the index approached a fresh record.
That is a majority of the index in what is conventionally called a bear market, hiding underneath a benchmark that looks healthy.
Layer in a second measure and the picture holds. A separate Dow Jones/MarketWatch reading via TradingView put 44% of constituents down at least 20% from their 52-week highs, a distinct and shorter-horizon metric that still tells the same story of broad weakness masked by a narrow group of high-flying artificial-intelligence names.
The configuration is genuinely unusual. Coverage from Chosun in late September 2026 noted this was the first time since late 2017 that the S&P 500 had stayed within 1% of its all-time high while more than half its components sat down over 20%.
The market concentration record reached its most extreme point in May 2026, when five companies controlled roughly 30% of total US equity market capitalisation, a level that surpassed the dot-com peak and established the structural starting point for the breadth divergence visible in September data.
This is the first occurrence since late 2017 of the S&P 500 holding within 1% of a record high while more than 50% of its constituents trade 20% or more below their peaks. Source: Chosun/MarketWatch coverage, September 2026.
| Breadth Metric | Current Reading | Prior Level | Time Frame | Source |
|---|---|---|---|---|
| Constituents >20% below all-time highs | 59.2% | N/A | September 2026 | MarketWatch/Dow Jones |
| Constituents >20% below 52-week highs | 44% | N/A | September 2026 | Dow Jones/MarketWatch via TradingView |
| Constituents above 200-day moving average | ~43.9% | 67% | Five-week decline | Jim Carson, Kai Volatility |
| Constituents with negative beta | ~45% | N/A | Discussion period | Jim Carson, Kai Volatility |
When nearly half the index moves against itself
The static snapshot is one thing. The direction of travel is worse. According to Jim Carson of Kai Volatility, the share of S&P 500 stocks trading above their 200-day moving average, a common trend indicator, fell from 67% to roughly 43.9% over five weeks.
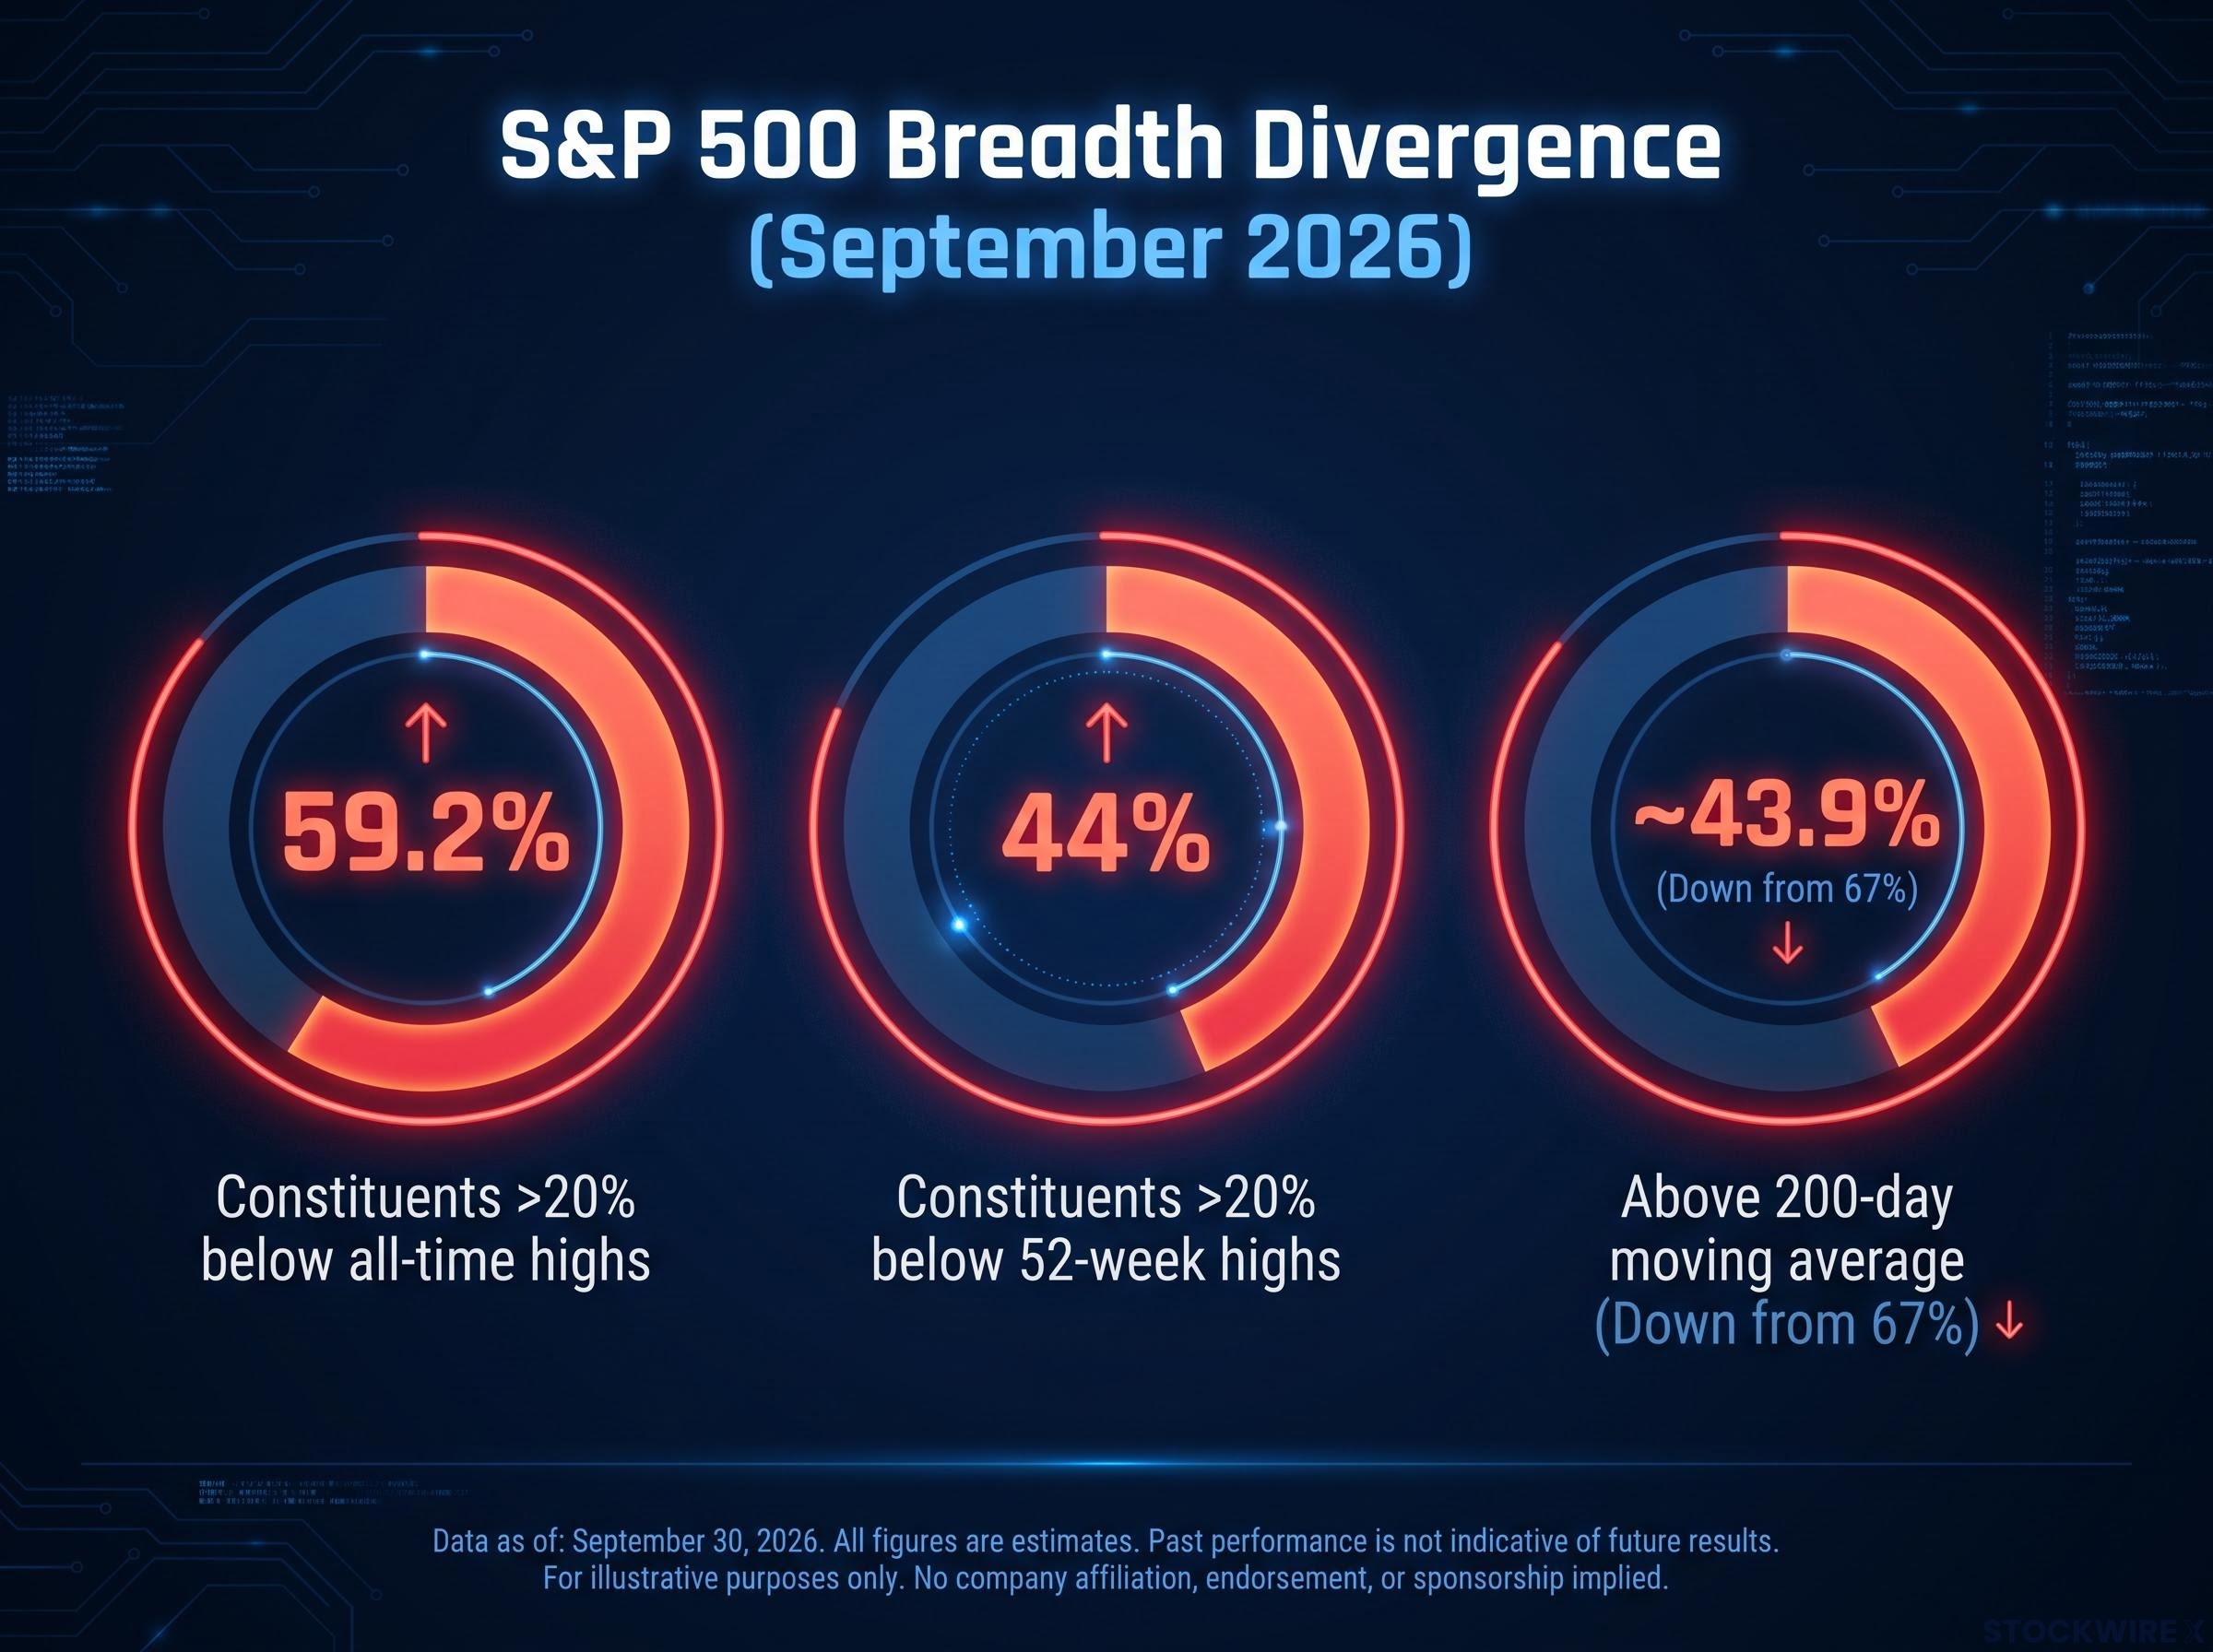
Alongside that, Carson noted that roughly 45% of constituents were exhibiting negative beta. In plain terms, negative beta means a stock tends to fall when the index rises, or rise when the index falls. It moves against the benchmark rather than with it.
When nearly half the index moves inversely or indifferently to the index itself, the benchmark stops functioning as a diversified aggregate of its parts. What that tells you is direct: if you own a broadly diversified equity portfolio rather than a concentrated AI position, you are almost certainly experiencing a very different market than the headline number implies. The index level is no longer a reliable guide to what is happening to most of the stocks inside it.
When big ASX news breaks, our subscribers know first
Why reported AI earnings may not mean what they appear to mean
The strength that is holding the index up rests on a striking number. According to J.P. Morgan Asset Management’s Multi-Asset Solutions team, in a note dated 10 September 2026, the S&P 500 delivered 14% sales growth and 29% adjusted earnings growth in the latest quarter, the fastest pace since the post-pandemic reopening in 2021.
That looks like unambiguous good news. The question is what sits behind it, and the answer runs through an accounting mechanism most investors never examine.
When a company spends heavily on AI infrastructure, the treatment matters:
The gap between spending on AI and generating cash returns from it sits at the core of the earnings quality debate; analysis of AI capex versus monetisation shows hyperscaler capital expenditure absorbing 93-94% of operating cash flow in 2026, up from 33-40% in 2022-2023, which reframes what the headline earnings growth figures actually represent.
- The cash goes out the door for data centres, chips, and hardware.
- Rather than being expensed immediately, that outlay is capitalised, recorded on the balance sheet as a long-lived asset.
- The cost then flows through the income statement gradually, as depreciation spread over the asset’s useful life, often many years.
The effect is that current-period earnings can look considerably stronger than current cash generation, because the bulk of the spending has not yet hit reported profit.
This is where two respected sources diverge sharply on how much of the index’s growth this mechanism explains. J.P. Morgan attributes roughly 40% of total S&P 500 earnings growth to semiconductor companies, which make up about 20% of index market capitalisation, framing the other 60% as distributed across other sectors and reflecting genuine competitive advantage.
A Carlyle report from mid-September 2026, cited by Carson, goes considerably further.
The Carlyle report characterises 100% of S&P 500 earnings growth as originating from the AI segment, and describes that growth as accounting-based rather than cash-flow-based. Source: Carlyle report via Jim Carson, Kai Volatility.
The same report cited roughly $50 trillion in asset appreciation attributable to the AI-linked portion of the market. The two characterisations are not directly reconcilable, and the gap partly reflects scope: J.P. Morgan measures semiconductors specifically, while the Carlyle framing appears to encompass a broader definition of AI-linked earnings.
Meta Platforms offers a company-level illustration of the tension. Carson noted revenue growth of roughly 24-25% year-over-year while margins declined by around 8%, driven by heavy infrastructure spending. That combination shows how the AI investment cycle can generate impressive top-line growth and compress actual profitability at the same time.
Here is what that means for what you are paying. If a meaningful share of reported earnings growth reflects capitalised spending rather than operating cash generation, the valuation multiples investors are paying for AI-segment earnings may be materially higher in real terms than headline price-to-earnings ratios suggest. Understanding the mechanism is the difference between knowing what you are buying and assuming the earnings equal cash in the door.
The consumer is the pressure point the index is not pricing
The concentration bet inside the index has a scale problem that becomes obvious once you weigh it against the actual economy. According to Carson, consumer spending represents roughly 68% of US economic activity, while AI infrastructure accounts for around 14%.
The index, in other words, is implicitly wagering that a minority economic driver keeps the market aloft while the majority driver deteriorates. And the majority driver is deteriorating.
The Conference Board reported that its Consumer Confidence Index fell 6.7 points to 81.9 in September 2026, down from 88.6 in August. As Axios framed it on 29 September 2026, that is the lowest reading since 2014.
The Conference Board’s deterioration does not stand alone: the University of Michigan’s consumer sentiment collapse to 47.8 in September 2026 showed one-year inflation expectations jumping from 4.0% to 4.6% simultaneously, a combination suggesting households are treating elevated prices as a permanent feature rather than a transitory disruption, which deepens the spending headwind beyond what confidence surveys alone capture.
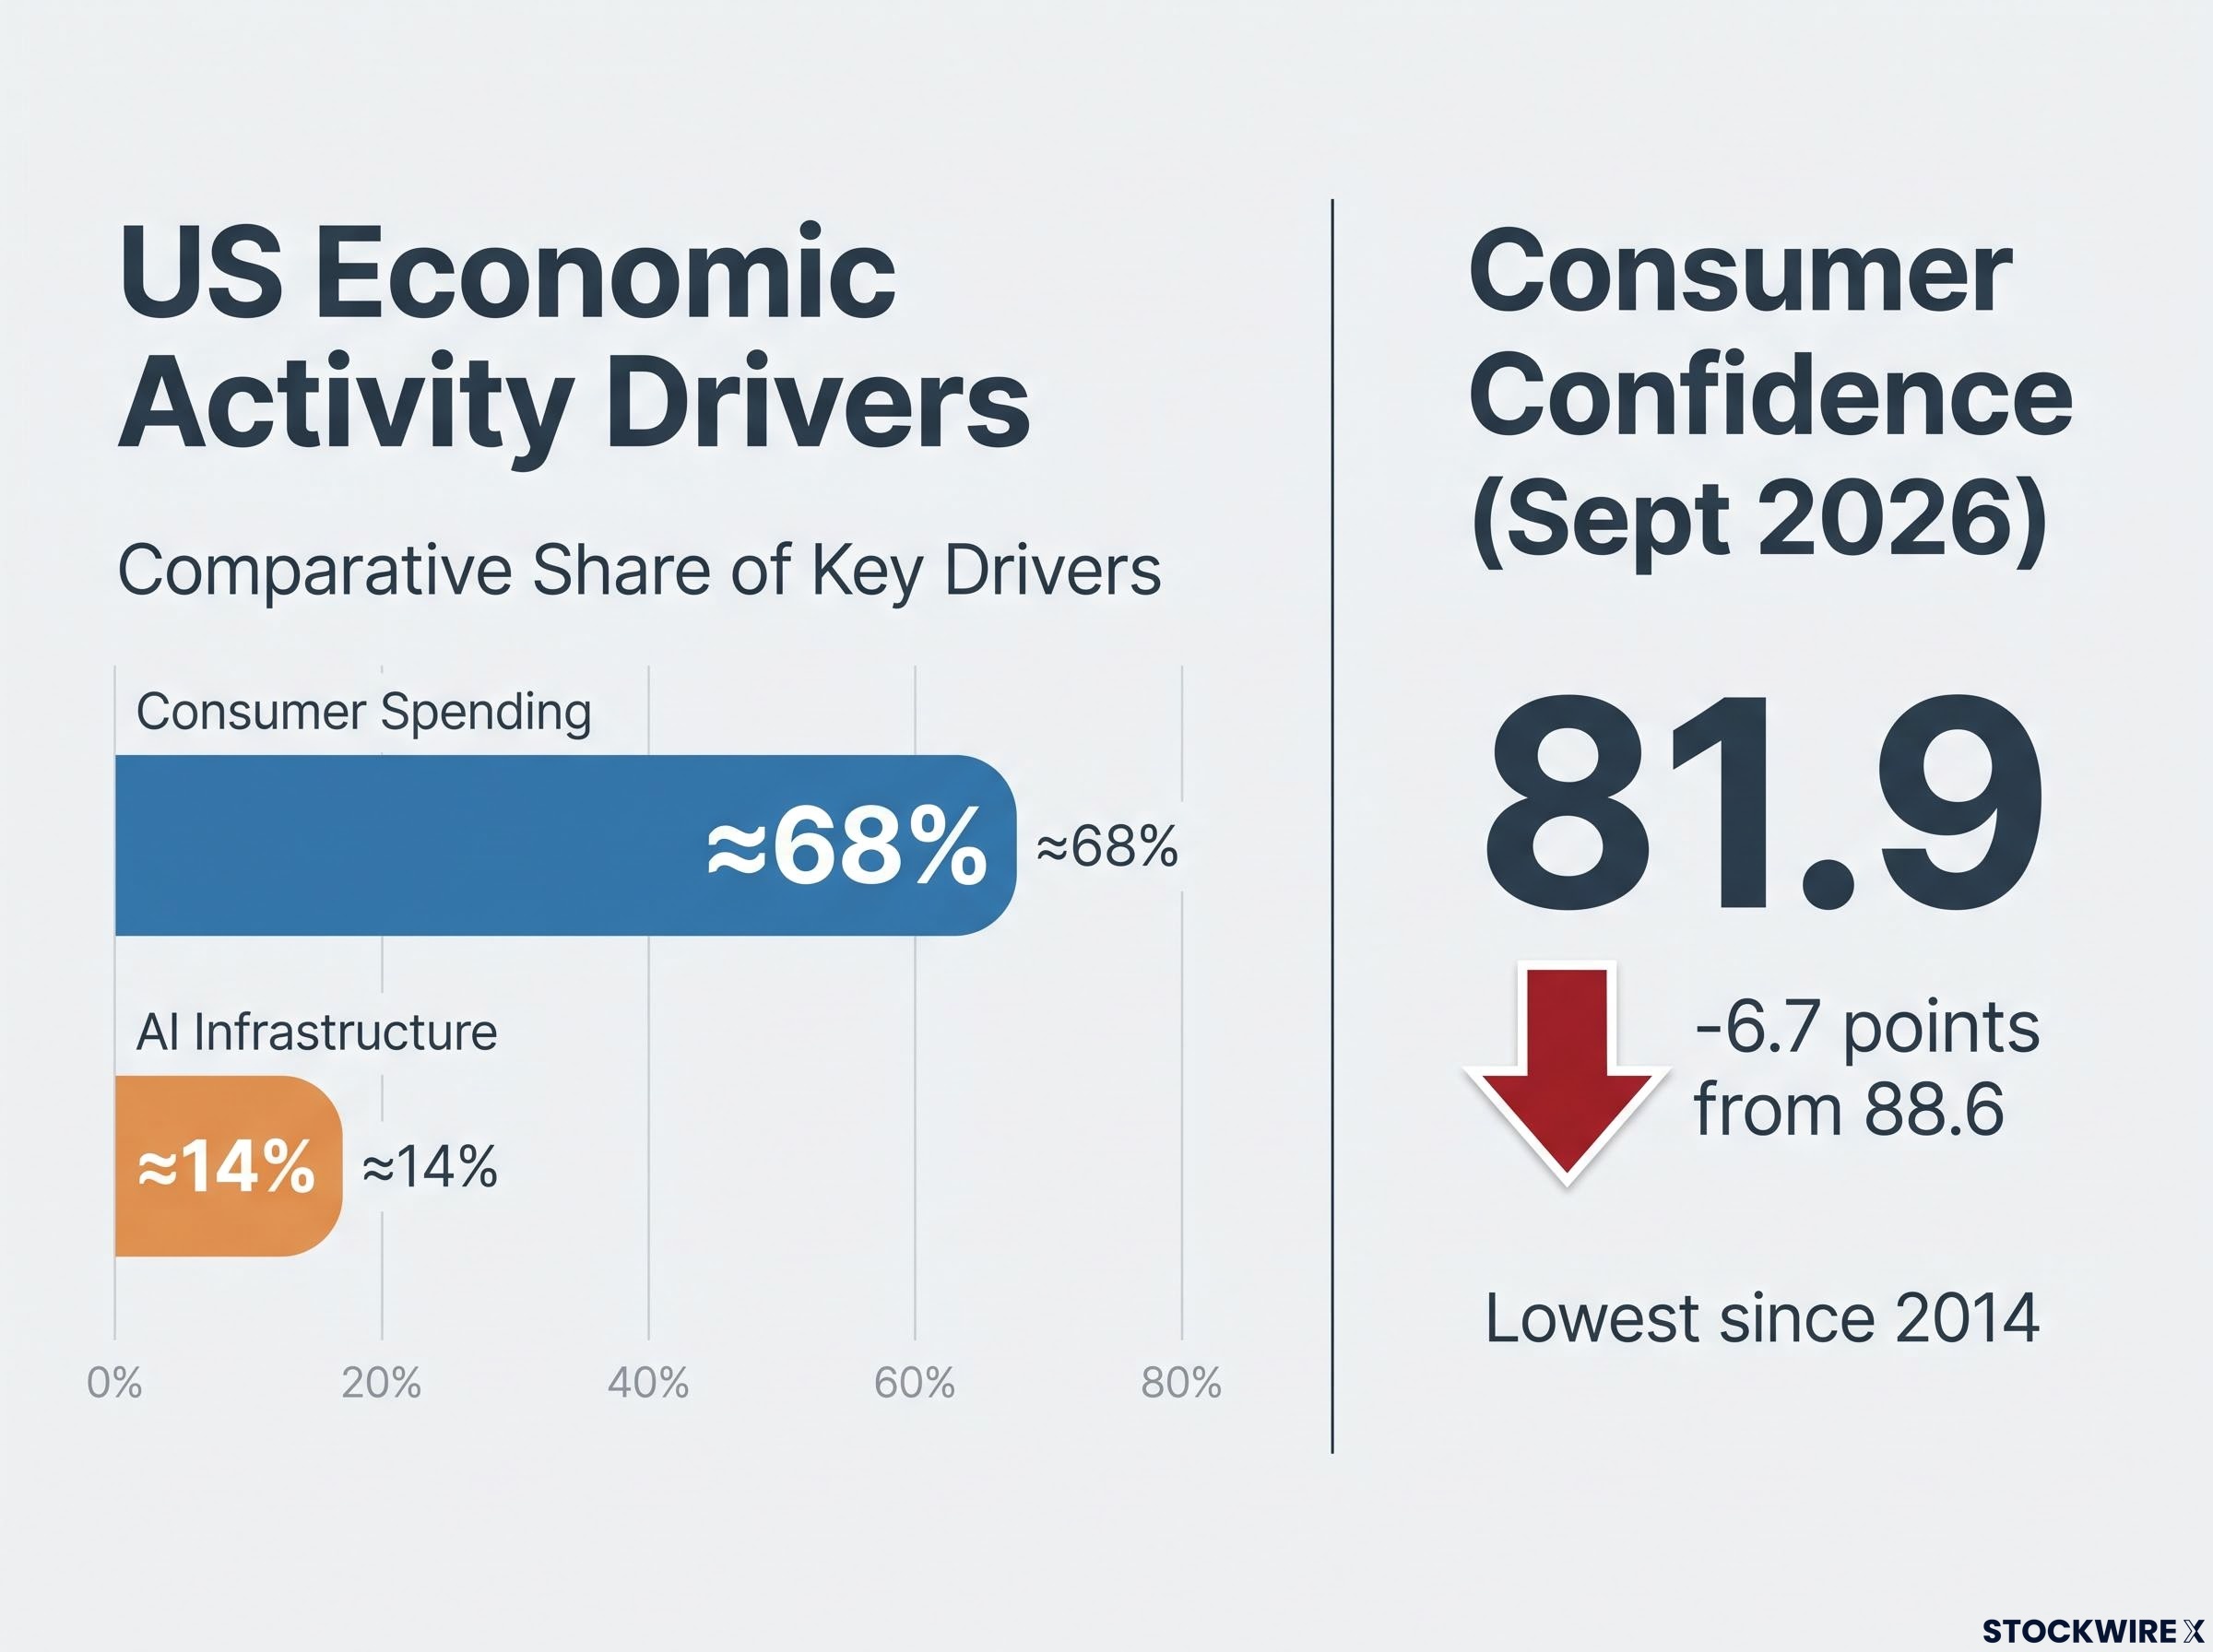
A reading of 81.9 marks a new 12-year low in US consumer confidence, the weakest since 2014. Source: Conference Board via Axios, 29 September 2026.
| Conference Board Sub-Index | September 2026 Reading | Month-over-Month Change |
|---|---|---|
| Overall Consumer Confidence Index | 81.9 | -6.7 points (from 88.6) |
| Present Situation Index | 109.3 | Declined |
| Expectations Index | 63.6 | Third consecutive monthly decline |
The Expectations Index reading of 63.6 matters more than the single-month drop, because it marks a third consecutive monthly decline. That makes the deterioration directional rather than a one-off wobble in sentiment.
The transmission mechanism connecting all of this is interest rates. The same elevated-rate environment squeezing consumers is also inflating the cost of the debt-financed capex boom that makes AI earnings look strong, which sets up a genuinely self-undermining dynamic:
- Consumer-facing sectors sit in bear-market territory, suppressed by high rates that restrain spending.
- AI-segment earnings surge, but the underlying capex is increasingly debt-financed, and higher rates raise the cost of that debt.
A 12-year low in consumer confidence, arriving as the index presses on record highs, is the clearest available signal that the benchmark and the underlying economic condition of most Americans have decoupled. That decoupling is not abstract. Consumer confidence is a leading signal for spending in an economy where household activity drives roughly 68 cents of every dollar of output, and a sustained decline at this level typically precedes earnings revisions in consumer-facing sectors. Carson described the reconciliation between the tech signal and the broader market as inevitable.
What the bulls are saying, and where the argument strains
The constructive case deserves its strongest form, because it is not naive. J.P. Morgan Asset Management’s read is that the 14% sales growth and 29% earnings growth reflect genuine secular demand and competitive advantage, not speculative excess.
On that view, narrow leadership during a major technology transition is historically normal. Capital and profits concentrate in the leaders first, then diffuse through the wider economy as the technology matures.
History offers three reference points for how this resolves:
- The dot-com bubble (late 1990s): a small group of technology and internet stocks drove indices to extreme valuations before earnings disappointed, triggering a multi-year correction.
- The Nifty Fifty (early 1970s): high-multiple, narrow leadership delivered poor medium-term returns even for businesses that ultimately succeeded, once stagflation and profit disappointments arrived.
- The Magnificent Seven / FAANG era (2015-2023): narrow mega-cap leadership sometimes broadened into wider participation rather than culminating in a crash.
| Episode | Peak Concentration Driver | Resolution Type | Key Differentiating Factor |
|---|---|---|---|
| Dot-com (late 1990s) | Internet and tech stocks | Correction | Expectations outran cash-flow reality |
| Nifty Fifty (early 1970s) | “One-decision” growth stocks | Correction | High multiples plus stagflation and profit disappointment |
| Magnificent Seven (2015-2023) | Mega-cap tech names | Broadening | Earnings strength diffused into other sectors |
Two of these episodes ended in severe corrections when cash flow failed to validate expectations. One resolved by broadening. That tells you the historical record does not settle the argument; it locates the exact hinge on which the argument turns.
The bull case rests on one load-bearing assumption: that AI capital expenditure will eventually generate revenues large enough to justify the capitalised asset values sitting on balance sheets today, and that depreciation and impairment charges will not rise sharply before those revenues arrive.
If that assumption holds, the current concentration resolves like 2017: leadership broadens, and the majority of stocks catch up. If it fails, the structural asymmetry is unforgiving. The 59-60% of constituents already in bear-market territory offer no cushion, and the index would have to catch down to the underlying breadth.
Which analogue you are in matters directly for how much concentration risk you should be comfortable carrying in a passive index fund that currently behaves less like a diversified equity portfolio and more like a leveraged position on AI capex returns.
What the next two quarters will tell you that the index level cannot
The evidence does not yet support a verdict, and it would be dishonest to hand you one. What it does support is a monitoring framework, because the variables that decide this are already observable.
Three things will determine which path the market takes:
- Whether AI-sector free cash flow in upcoming earnings validates the capitalised asset values on which the bull case depends.
- Whether consumer spending holds or decelerates further, as the Conference Board Expectations Index reading of 63.6, now in its third consecutive monthly decline, suggests it may.
- Whether employment conditions, the competing positive signal, stay strong enough to offset confidence-driven spending restraint.
The asymmetry is what makes this worth watching closely. If the AI leaders disappoint on cash flow, the index has to reprice downward, because the majority of constituents already in bear-market territory provide no support. If cash flows validate expectations and the consumer stabilises, the resolution can be broadening participation rather than correction.
Three breadth proxies that signal before the headline does
The cap-weighted index will be the last thing to move when this divergence resolves. These three measures move first:
- The equal-weighted S&P 500 ETF: because it treats every constituent equally, it strips out the distortion of a few dominant names. If it begins closing the gap with the cap-weighted index, that is the first sign the breadth divergence is resolving constructively rather than the leaders simply carrying the load.
- The percentage of constituents above their 200-day moving average: currently around 43.9%. A sustained rise signals broadening participation; a further fall signals the narrow leadership group is thinning.
- The Russell 2000: small-caps are highly rate-sensitive and consumer-exposed, which makes them a cleaner read on the broad economy than the megacap-dominated benchmark. It recently fell to its weakest level since June.
The practical response is not to guess the direction. It is to cross-reference the index level against these breadth indicators, which are already signalling stress the headline number is not.
For investors wanting a systematic framework for monitoring these signals over time, our dedicated guide to reading S&P 500 breadth divergence covers the cap-weighted versus equal-weighted gap methodology, the Bank of America Sell Side Indicator, and practical guidance on when narrow breadth warrants caution versus when it resolves through broadening participation.
This article is for informational purposes only and should not be considered financial advice. Investors should conduct their own research and consult with financial professionals before making investment decisions.
Past performance does not guarantee future results. Financial projections are subject to market conditions and various risk factors. The forward-looking scenarios discussed here are speculative and subject to change based on market developments and company performance.