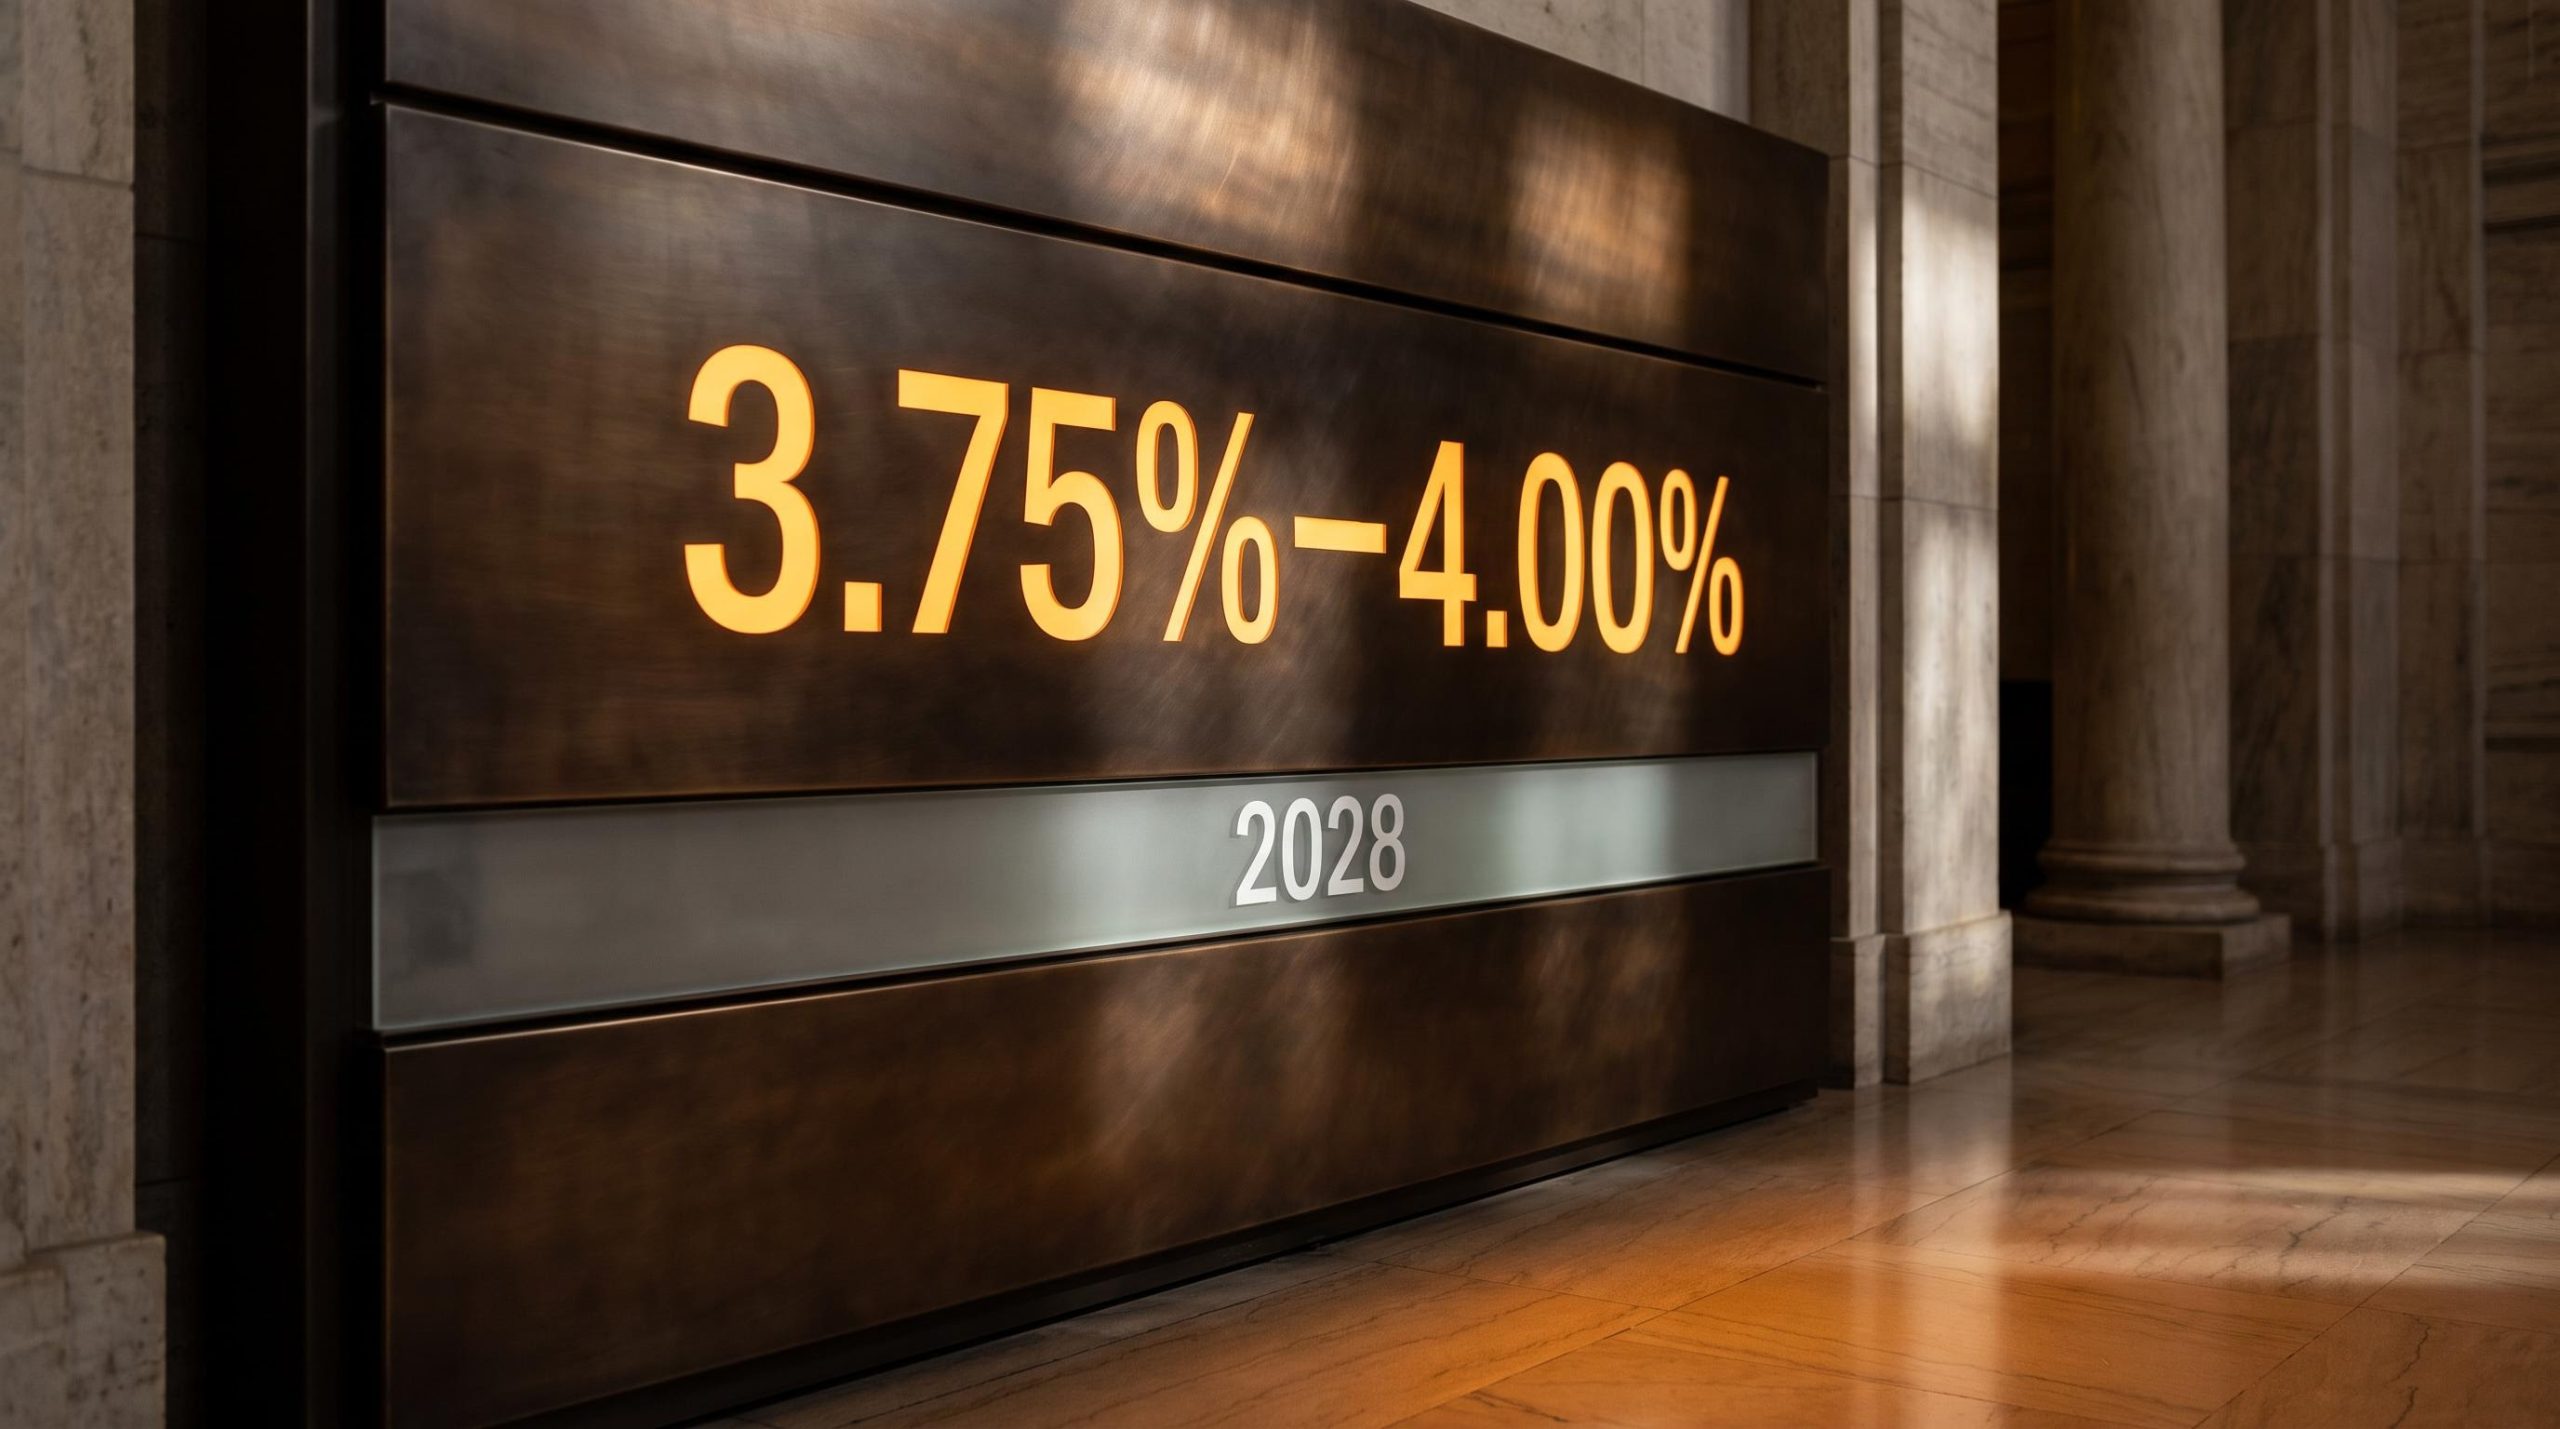
The Nasdaq is climbing. The Russell 2000 is not. If you hold a broadly diversified U.S. equity fund built to capture “the market,” it is quietly being pulled in two directions at once.
That split is not random. Beneath it sits a single variable: the real yield on the 10-year U.S. Treasury Inflation-Protected Security (TIPS), now in the 2.6-2.8% range, its highest level since 2008. That one number is the mechanism running under all three stories that matter right now, equity breadth, sector dispersion, and gold’s revised price path.
What follows here maps that real-rate transmission across sectors and assets, so you can identify where your own exposure actually sits. This is a diagnostic, not a prediction. By the time you finish, you will know which forces are driving the divergence, which assets are most exposed, and what specific condition would need to change before the gap starts to close.
The real-rate shock and why 2.6% matters more than it sounds
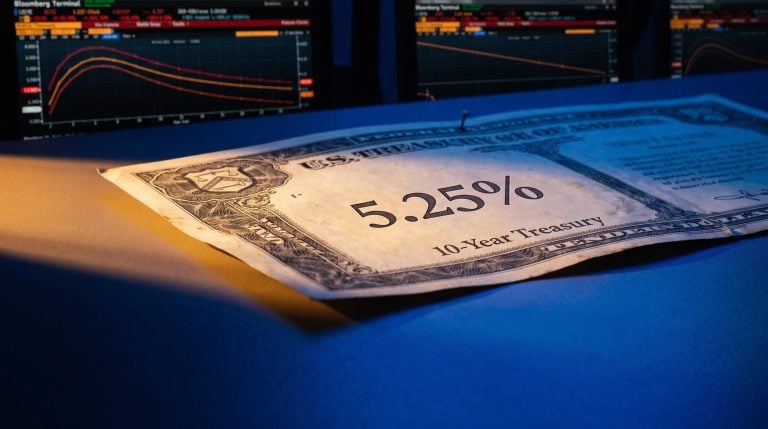
Start with a number most retail investors never look at directly. On 27 September 2026, the U.S. Treasury reopened its 10-year TIPS auction (CUSIP 91282CRE3), and it cleared at a real yield of 2.653%. That was the highest for the term since an auction in October 2008.
A real yield is the return you earn above inflation. A nominal Treasury yield above 5% sounds generous until inflation eats into it; the TIPS strips that out and tells you what you actually keep in purchasing power. Right now, that figure is close to 3%.
The current TIPS reading reflects multiple converging forces, and the real yield drivers differ in important ways: policy-rate expectations, AI-era capital expenditure raising the equilibrium real rate, and a resilient economy have each contributed to the cycle’s most aggressive real-rate tightening, compressing valuations across assets simultaneously.
Sit with what that means in practice. You can lock in roughly 3% above inflation with an instrument that carries no default risk and no equity volatility. The 30-year TIPS real yield was even higher at 3.10%, per a Reuters report on 15 September 2026.
Once a genuinely safe asset pays close to 3% real, the minimum return you should demand from anything riskier rises with it. That single shift ripples outward through three distinct channels.
- Hurdle-rate elevation: every risky asset now competes against a near-3% real risk-free return, so equities have to work harder to justify their place in a portfolio.
- Discount-rate pressure: the present value of long-dated cash flows falls when the rate used to discount them rises, which hits assets whose value sits years out.
- Funding-cost stress: leveraged businesses that refinance debt or depend on capital markets face higher borrowing costs directly.
When TIPS real yields approach 3% and nominal Treasuries clear above 5%, Reuters commentary has noted, investors gain a genuinely competitive “risk-free” alternative that lifts the hurdle rate for every risky asset at once.
This is why the 2.6% figure is not just a data point. It is the load-bearing mechanism beneath everything that follows. If you skip past it, the breadth divergence and the gold revisions in the sections below will read as unrelated events. They are the same event, viewed from different corners of the market.
When big ASX news breaks, our subscribers know first
Where the damage is showing up, and why these sectors, not others
If elevated real rates raise the hurdle for every risky asset, the sectors that break first are the ones least able to clear a higher bar. That is not a random assortment of losers. It is a direct, traceable consequence of the mechanism just described.
Five parts of the market have taken the steepest hits: homebuilders, real estate investment trusts (REITs), utilities, gold mining firms, and small-caps in the Russell 2000. Each fails the new hurdle test for a slightly different reason.
| Sector | Primary vulnerability | Rate-sensitivity driver |
|---|---|---|
| Homebuilders | Higher mortgage rates suppress demand and compress margins | Buyer affordability tied directly to borrowing costs |
| REITs | Substantial debt loads face higher refinancing costs | Discount-rate pressure on rental cash flows |
| Utilities | Leveraged balance sheets against regulated returns | Higher discount rates on stable, bond-like income |
| Gold miners | Same real-rate headwind suppressing gold’s price path | Zero-yield underlying asset competing with 3% real |
| Small-caps (Russell 2000) | Weaker balance sheets, bank-lending dependence | Tighter financial conditions raise default risk |
Goldman Sachs analyst Christian Mueller-Glissmann characterised overall market breadth as poor, pointing to exactly these segments as the most negatively affected during the run-up in rates. Breadth, in plain terms, measures how many stocks are participating in a market’s gains. Poor breadth means the index is rising on a narrow set of shoulders.
The stress in these sectors is not evenly distributed or instantaneous; the BIS has documented that rate-sensitive fault lines tend to peak two to three years after hikes begin, meaning the refinancing walls arriving in 2026 for commercial real estate, private credit, and regional banks may represent the most dangerous phase of the current cycle.
Here is why that should concern you directly. If you hold a market-cap-weighted index fund, poor breadth means you are far more exposed to a narrow leadership group than the word “diversified” suggests. The top names are carrying the returns while the rest of your holdings quietly drag.
Why mega-cap tech and AI leaders are holding up
The same real-rate pressure that punishes leveraged, low-growth sectors barely touches the largest technology firms. Three structural features explain the gap.
First, many mega-cap technology and AI-linked companies hold net cash rather than net debt, so higher borrowing costs simply do not bite the way they do for a leveraged REIT. Second, their secular growth narratives around AI, cloud, and automation let investors justify elevated valuations even against a near-3% real risk-free rate. Third, their margin profiles are strong enough to absorb the higher hurdle without the cash flows collapsing.
This is relative resilience, not immunity. Reuters commentary has acknowledged that elevated yields can pull money broadly out of expensive stocks. In practice, though, the most profitable mega-caps have retained leadership while cyclicals and rate-sensitives de-rate around them.
Goldman’s gold revision as a case study in the rate-structural tension
The clearest illustration of how real rates suppress an entire asset class is not an equity sector at all. It is gold, and specifically how Goldman Sachs walked its 2026 target down over the course of the year.
| Date | End-2026 target | Key driver |
|---|---|---|
| January 2026 | $5,400/oz | Central-bank diversification, expected Fed cuts |
| June 2026 | $4,900/oz | Fading ETF inflows, 2026 rate cuts removed |
| September 2026 | $4,650/oz | Real-rate drag on rate-sensitive demand |
The chronology tells the story better than any single forecast. In January 2026, Reuters reported Goldman lifting its end-2026 target to $5,400/oz from $4,900, citing diversification by private investors and emerging-market central banks alongside expected Fed rate cuts.
By June 2026, the bank cut that target back to $4,900/oz, blaming fading gold exchange-traded fund (ETF) inflows and the removal of all remaining 2026 Fed rate cuts from its macro forecast. Then in late September 2026, Goldman strategist Lina Thomas trimmed it again to $4,650/oz, linking the cut explicitly to the drag from higher real rates on rate-sensitive gold demand.
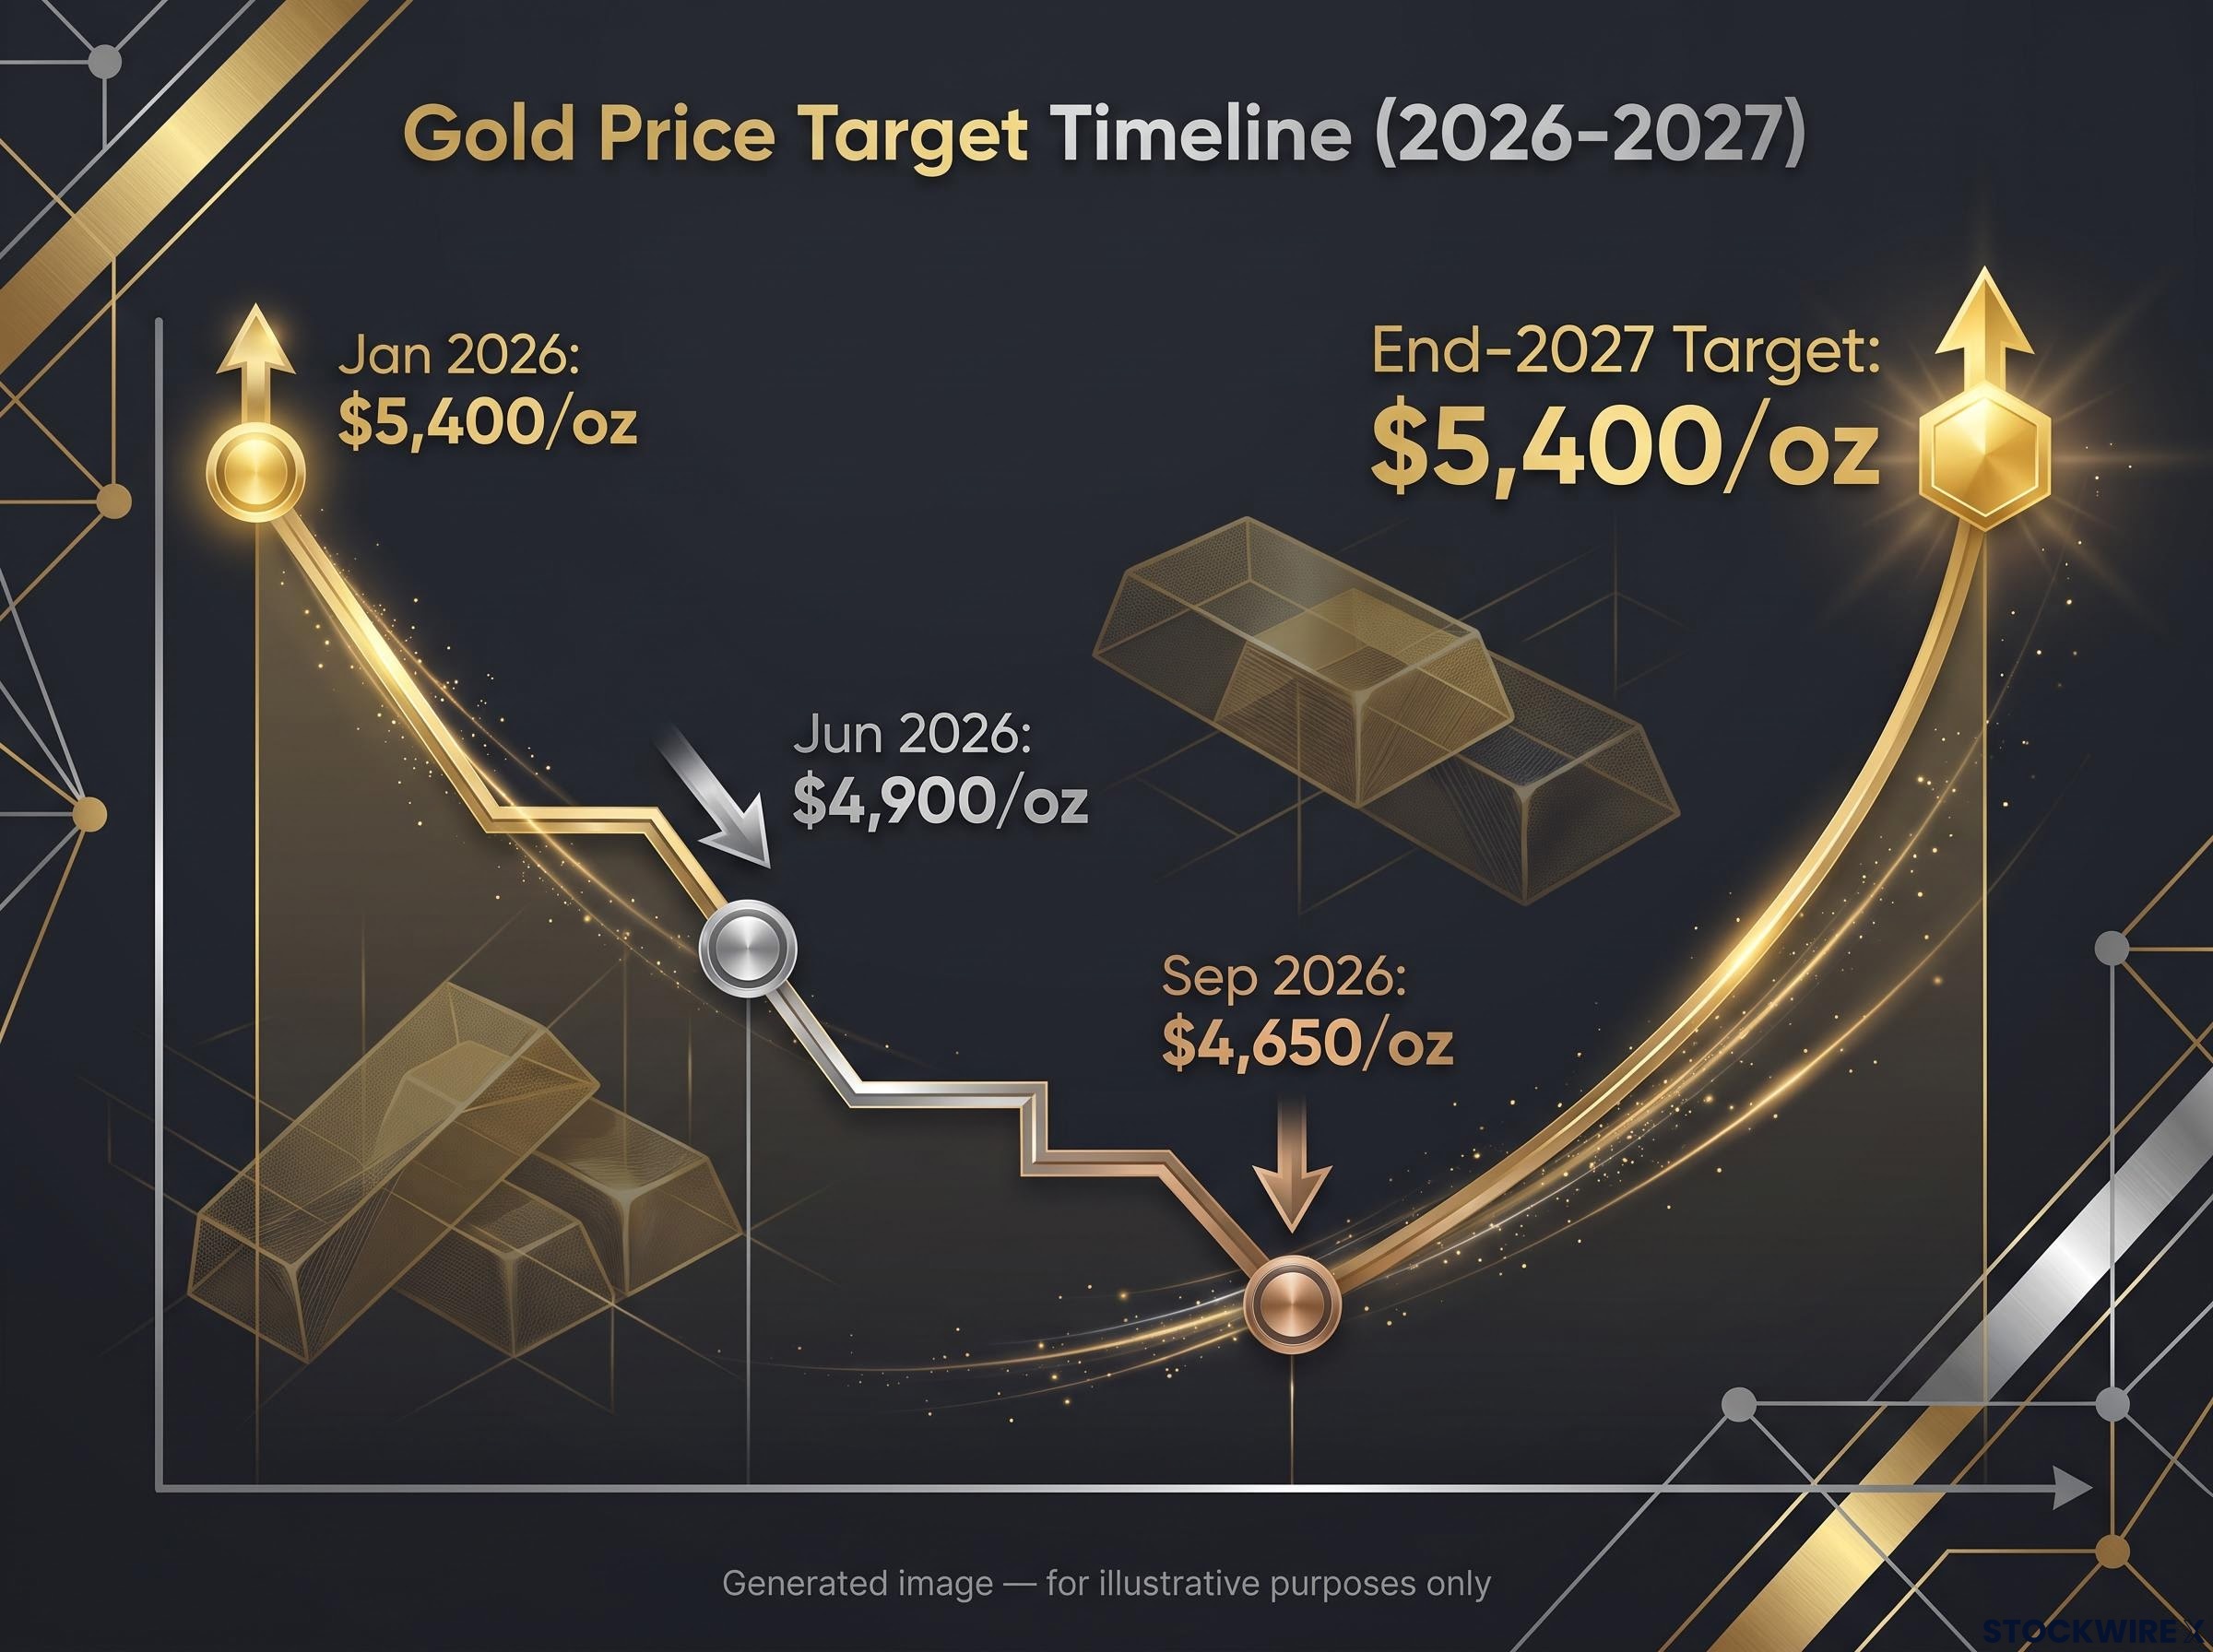
Notice what held steady through all of it. The end-2027 target stayed at $5,400/oz throughout, which is the tell.
Goldman’s framework separates two forces: durable central-bank buying, described as far above pre-2022 levels, provides a structural floor, while cyclical ETF outflows, driven by real-rate competition from fixed income, create the near-term drag.
Central-bank purchases, reported at roughly 91 tonnes per month (a figure that remains unverified in the underlying research and should be treated with caution), function as the structural support. ETF demand is the cyclical variable, and it fades precisely because a 3% real Treasury yield is a hard competitor for a zero-yield metal.
World Gold Council demand trends data for Q2 2026 recorded central bank net purchases of 289 tonnes for the quarter, roughly 96 tonnes per month, a figure that sits close to the 91-tonne monthly estimate cited in Goldman’s framework and confirms that structural buying remains well above pre-2022 norms.
For this analysis, the gold revision is not really a gold story. It is evidence that the same real-rate pressure suppressing REITs and homebuilders is compressing demand for any asset that competes with a 3% real Treasury. That tells you the mechanism is systemic, not sector-specific. If you hold gold or mining exposure, the price-path context is direct; if you do not, it is the cleanest available proof that the breadth problem is a cross-asset phenomenon.
What would need to change, and what the bears are missing
So what would it take for the market to broaden out again? Strategists, largely at Goldman Sachs and across the major institutions, point to four conditions.
- Real rates moving sustainably lower, which would ease discount-rate pressure across cyclicals and rate-sensitives.
- Earnings visibility improving outside mega-cap tech, giving investors a reason to redirect flows toward financials, industrials, and housing-linked names.
- Valuation constraints emerging on the leaders, so that further upside in the largest names starts to look limited relative to under-owned laggards.
- Macro and policy stabilisation, with steadier inflation and diminishing recession fears supporting domestically focused sectors.
That is the recovery case. The contrarian case deserves equal weight, because narrow leadership is not automatically a warning sign.
For investors wanting to understand whether the rate environment is approaching a turn, our full explainer on whether the current real-yield peak is cyclical or structural examines the institutional split between New York Fed and American Century on one side and Franklin Templeton and Lombard Odier on the other, and what that disagreement means for duration positioning.
Concentration can be rational. If a small group of companies genuinely captures a disproportionate share of global earnings and cash flow, an index heavily weighted toward them simply reflects economic reality. History also shows concentration can persist far longer than mean-reversion expectations assume, as the late-1990s technology run and the extended Magnificent Seven phase both demonstrated.
The contrarian case for rate-sensitives
There is a mirror-image argument for the losers. Value and macro managers increasingly view REITs, homebuilders, utilities, and small-caps as contrarian trades precisely because their pricing may already discount a higher-for-longer scenario. If real rates ease or credit conditions stabilise, those sectors could rebound sharply.
The caveat cuts the other way, too. The danger in concentration is not that it is happening, but that investors may be paying full price for leadership without pricing the fragility that appears if growth expectations normalise.
That fragility shows up most sharply in how a market correction could unfold. Two mean-reversion scenarios carry very different outcomes for index holders.
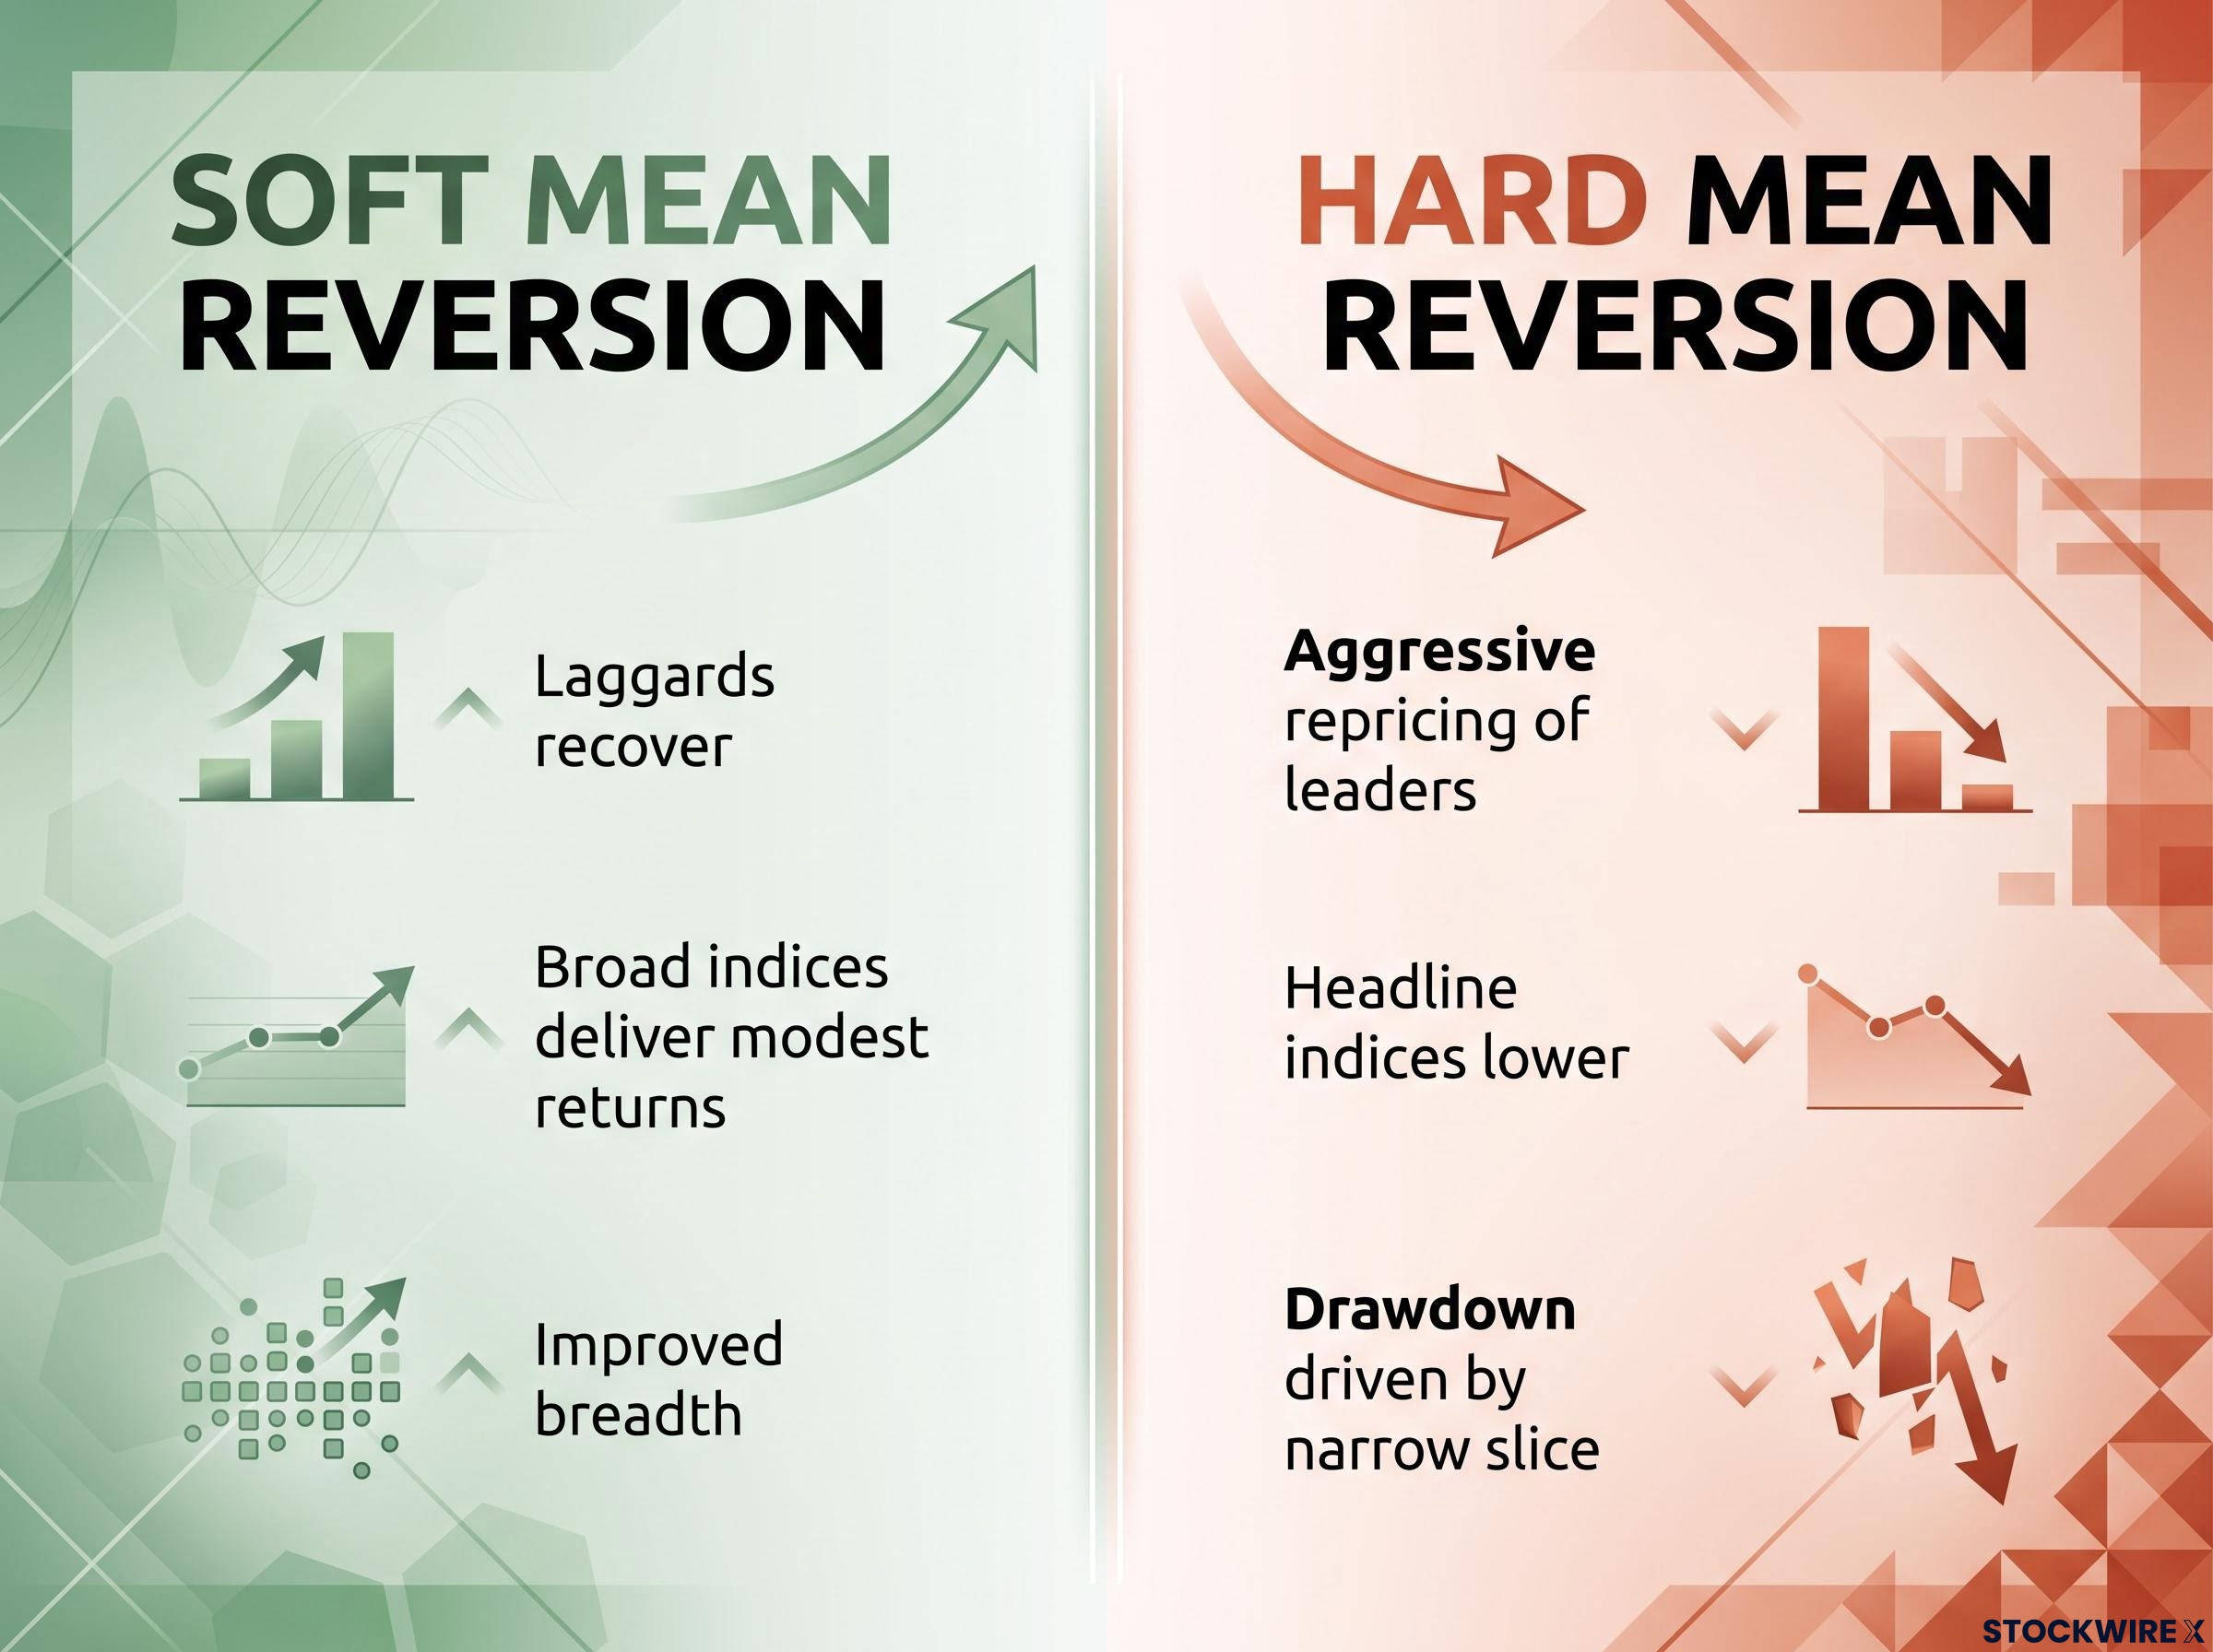
- Soft mean reversion: laggards recover as real rates drift lower and earnings normalise, mega-caps consolidate, and broad indices deliver modest returns with improved breadth.
- Hard mean reversion: an aggressive repricing of the leadership group pulls headline indices lower even as some laggard sectors stabilise, exposing index investors to a drawdown driven by a narrow slice of their holdings.
The actionable read is not whether breadth recovers. It is whether your current index exposure reflects the risk profile you think it does, given how much of its effective return is being driven by a handful of names you may never have consciously chosen to overweight.
Passive index exposure carries a hidden duration and concentration profile that most investors have not consciously chosen: the cap-weighted S&P 500 returned 86% over three years versus 43% for its equal-weighted counterpart, but the entire performance gap was driven by valuation expansion in a handful of names rather than superior earnings growth across the index.
Reading the rate cycle before making a portfolio call
Three threads run through this analysis, real rates, equity breadth, and the gold revision, and they converge on one input. The 10-year real yield is the single variable that, if it moves materially lower, simultaneously improves the outlook for rate-sensitive equities, gold’s near-term path, and overall market breadth.
Watch the real yield trajectory above all else. It is the common catalyst sitting beneath sector rotation, gold’s price path, and whether the market’s leadership finally broadens.
That Goldman held its end-2027 gold target at $5,400/oz even while cutting the 2026 figure to $4,650/oz is worth remembering. It signals that the structural thesis survives the near-term rate headwind. The same logic applies to the laggard equity sectors, but neither is a near-term trade signal, and the timing of any real-rate turn remains genuinely uncertain.
For most diversified U.S. equity investors, the practical question is not how to time the rate cycle. It is whether your holdings reflect a conscious decision or an accidental bet on a narrow group. Three checks help:
- Concentration check: what share of your effective index return in 2026 has come from the top five to ten names?
- Rate-sensitivity audit: how much of your exposure sits in homebuilders, REITs, utilities, miners, or small-caps that move with real yields?
- Scenario awareness: how would your portfolio behave under soft versus hard mean reversion?
This article is for informational purposes only and should not be considered financial advice. Investors should conduct their own research and consult with financial professionals before making investment decisions. Past performance does not guarantee future results, and financial projections are subject to market conditions and various risk factors.