
For most of the past decade, long-duration bonds were the position thoughtful investors deliberately steered around. Today, that same instrument pays a real yield not seen since 2008, and the 60/40 portfolio it anchors is running at nearly double its own historical average. The trade nobody wanted has quietly become the trade that works.
The numbers behind that reversal are not theoretical. As of late September 2026, the 10-year nominal Treasury yield sits near 4.95%, real yields on inflation-protected securities have cleared 2.65%, and a standard 60/40 portfolio has posted an annualised 13.4% gain through early August. If you are still carrying the 2022 assumption that bonds are dead weight on a portfolio, that prior is now costing you.
This piece lays out the analytical lens for deciding whether bonds belong in your portfolio again. It covers why the yield environment has changed structurally, the precise reason 2022 broke the 60/40 logic, what a genuinely diversified portfolio looks like, and the specific conditions that would make this revival conditional rather than permanent.
What it actually means when bonds offer a positive real yield
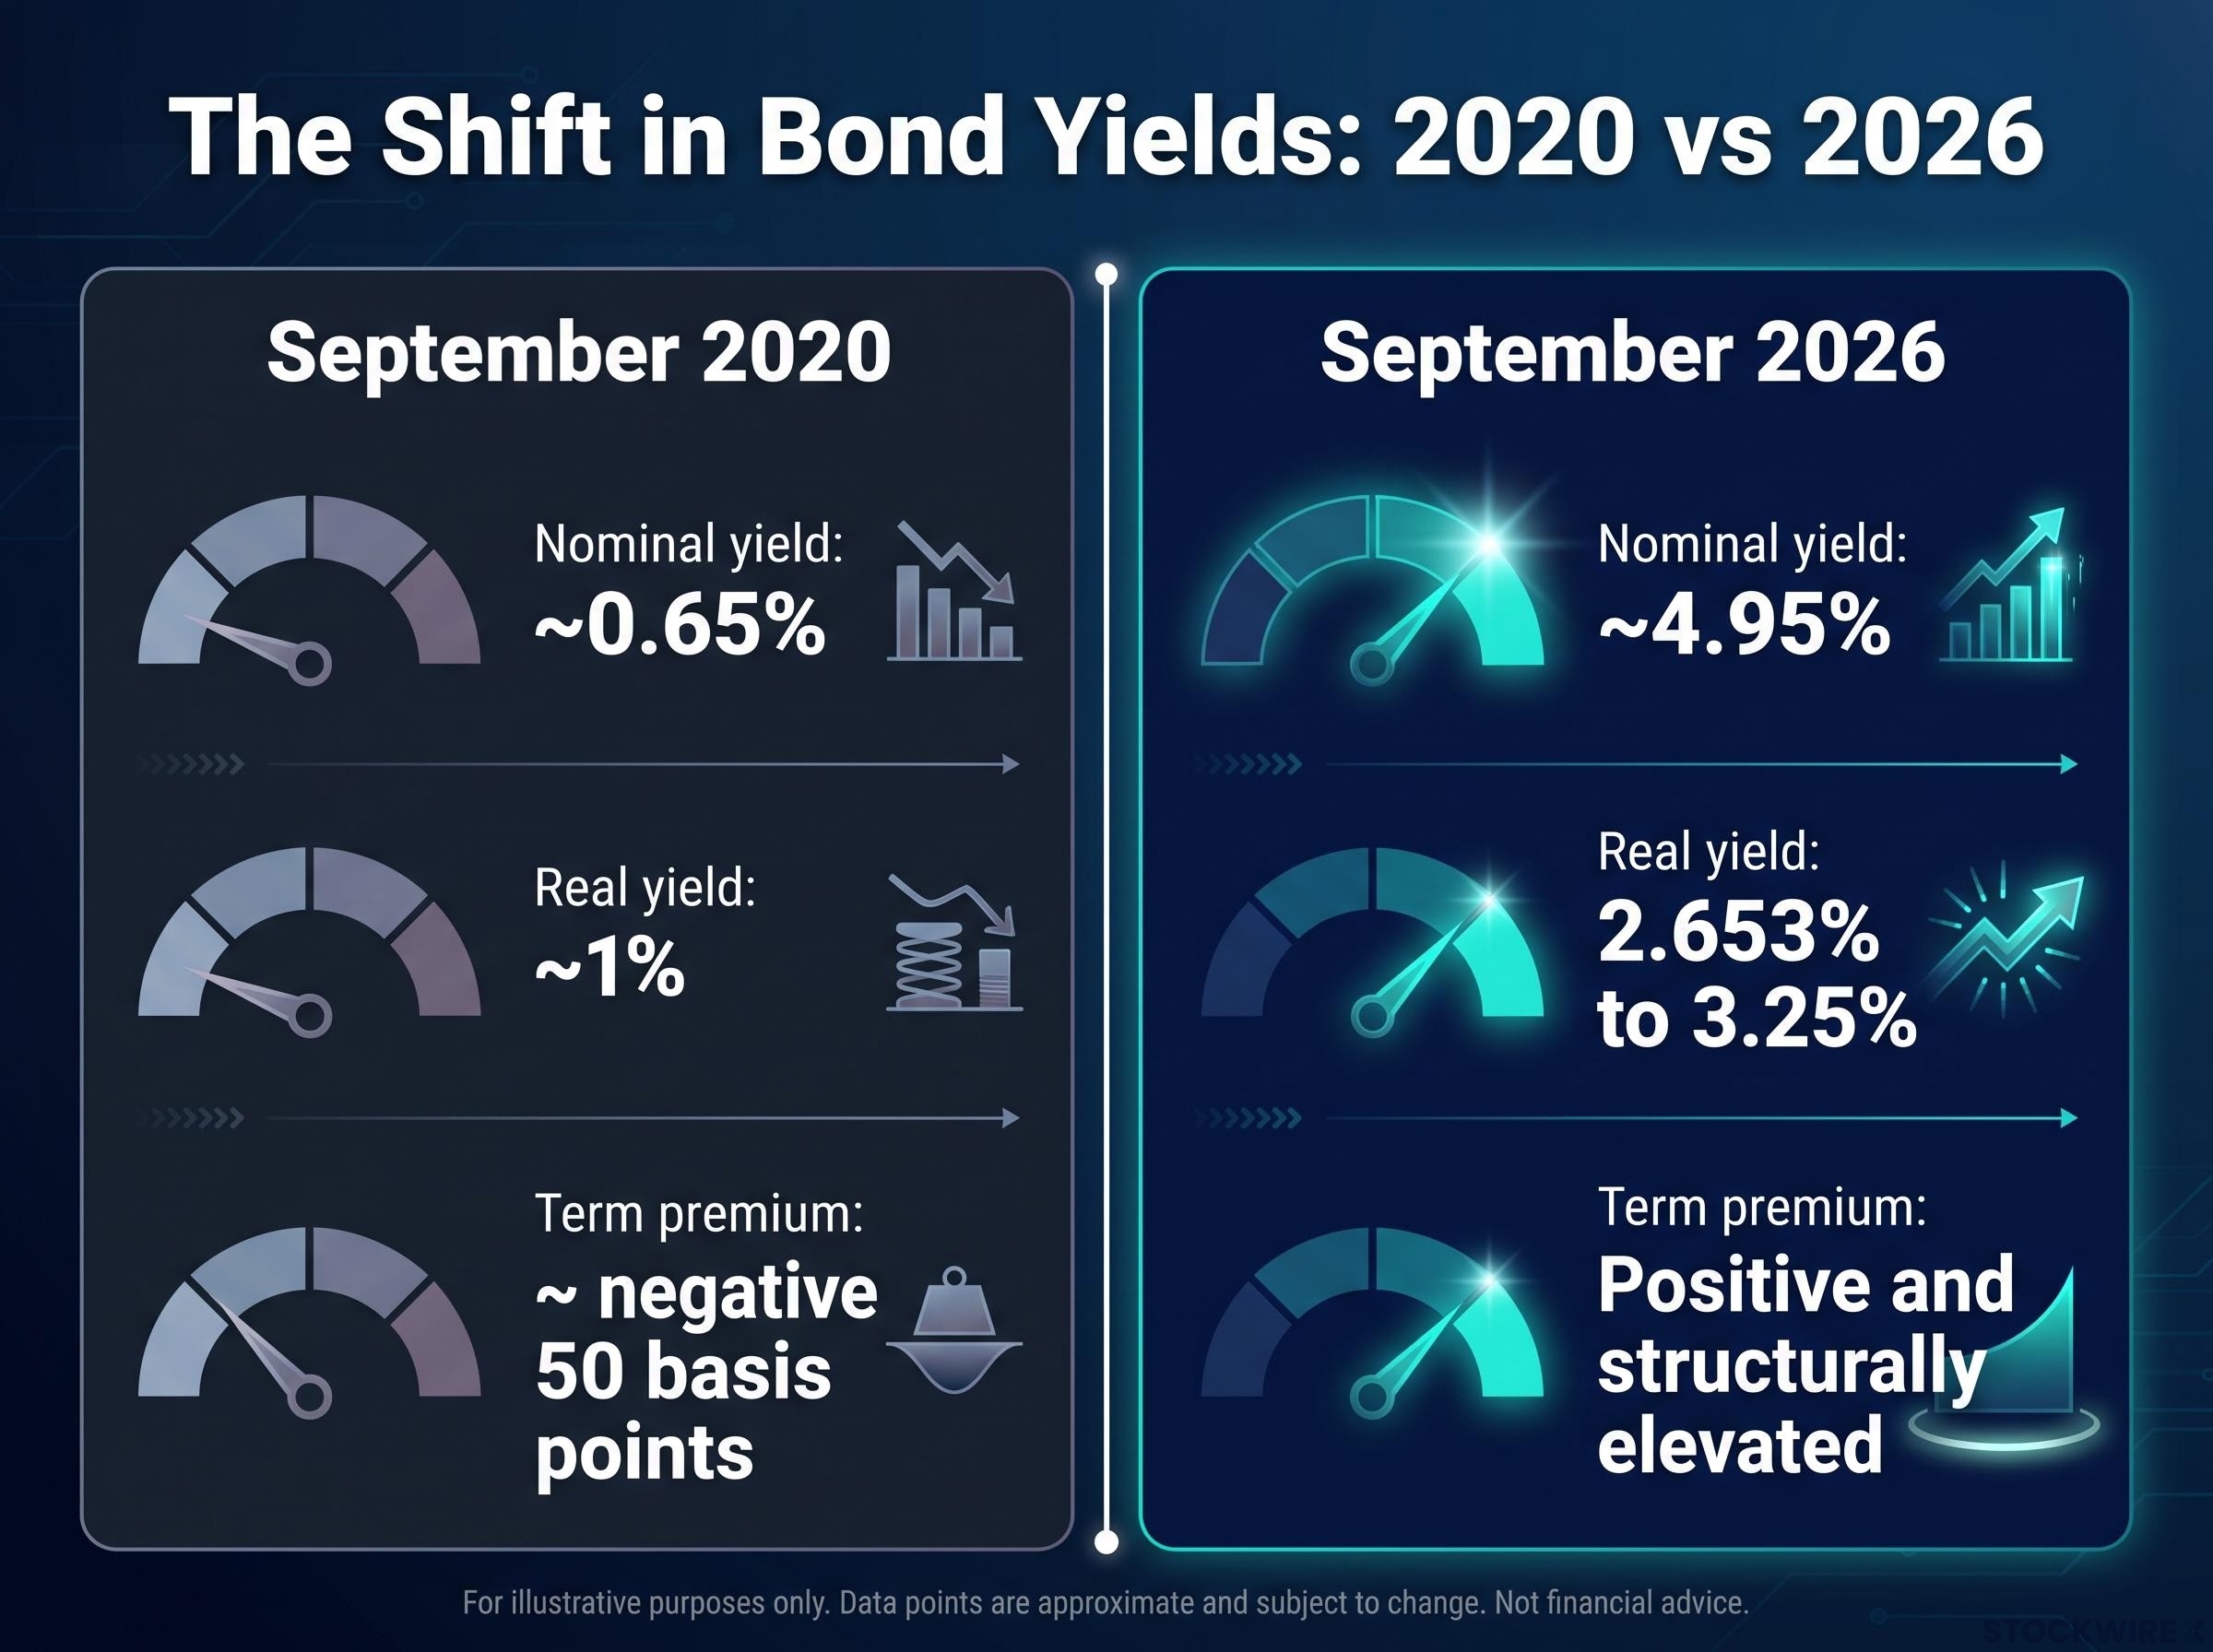
Rewind to September 2020. The 10-year Treasury yielded roughly 0.65%. Real rates, meaning the yield after stripping out expected inflation, sat around 1%. Term premiums, the extra compensation investors demand for holding longer-dated debt, were near negative 50 basis points. Owning a bond back then meant paying, in real terms, for the privilege of lending money to the US government.
That is no longer the case, and the shift is not subtle.
Real yields at a 17-year high The reopened 10-year Treasury Inflation-Protected Securities auction on 27 September 2026 cleared at a real yield of 2.653%, the highest for that maturity since October 2008.
The current landscape reads nothing like the zero-rate era:
- Nominal yield: approximately 0.65% in September 2020, now near 4.95% (with the 20-year at 5.26% as of 8 September 2026)
- Real yield: around 1% then, now 2.653% (Andy Constan of Damped Spring Advisors cites figures closer to 3.25%)
- Term premium: roughly negative 50 basis points then, now positive and structurally elevated
Here is what that shift actually does. When real yields are positive, the income a bond throws off dominates its price sensitivity. The asset stops behaving like a pure interest-rate bet and starts behaving like an income instrument with an embedded hedge.
Constan frames the practical upshot cleanly: a hypothetical 200 basis point decline in rates would now generate enough capital gain on long-duration bonds to offset a meaningful equity drawdown. That is the mechanical foundation of diversification, and it only exists when yields start from a positive real base.
The takeaway for you is direct. Positive real yields mean bonds now compensate you for the time and inflation risk you take on. That is the precondition for bonds to function as a portfolio tool again, and it has been absent for most of the last decade.
When big ASX news breaks, our subscribers know first
Why 2022 broke the 60/40 logic, and why that argument no longer holds
The 2022 collapse was not proof that bonds are a bad asset. It was proof that bonds fail under one specific condition, and diagnosing that condition is the only reliable way to judge whether it will happen again.
What broke that year was correlation. A 60/40 portfolio works because stocks and bonds usually move in opposite directions during a shock. In 2022, they moved together. The market absorbed a simultaneous rates-up and inflation-up shock, which flipped the stock-bond correlation positive. Both assets sold off at once, and the diversification function simply stopped existing.
The stock-bond correlation reached its most extreme negative reading since 1996 in June 2026, according to UBS research, with core PCE near 3.4% sitting above the 3.1% threshold UBS identifies as the inflection point where bonds lose their cushioning function and correlation shifts positive.
Duration made it worse. Core bond indices carried effective durations of six to eight years, meaning a one-percentage-point rise in yields translated into roughly a six-to-eight-percent price fall. When yields spiked rapidly, that sensitivity turned into steep losses.
Compare that to how the relationship is supposed to behave.
| Scenario type | Equity direction | Bond direction |
|---|---|---|
| 2022 inflation shock | Down | Down |
| Growth scare or recession | Down | Up |
| Current environment | Conditional on shock type | Conditional on shock type |
The 2025 full-year 60/40 return of 12.1% to 13.3% is the evidence that the normal relationship has reasserted itself. That is nearly double the strategy’s long-run average, and it happened because bonds are once again buffering equities rather than amplifying their losses.
The condition that determines whether bonds diversify or correlate
The distinction comes down to what kind of shock hits the market.
An inflation shock looks like 2022: prices accelerate, the central bank tightens, and both stocks and bonds fall because rising yields hurt equity valuations and bond prices at the same time. A growth shock looks different: demand weakens, a recession threatens, the central bank cuts rates, and bonds rally as equities fall. In the first case, bonds correlate. In the second, they diversify.
As of late September 2026, the dominant risk to equities is a growth shock rather than an inflation re-acceleration. Rates are already elevated, which means the marginal direction of yields under stress is downward. That is precisely the condition that makes the diversification function live again, and it is the opposite of what held in 2022.
What a properly constructed diversified portfolio looks like beyond 60/40
The 60/40 is not the ceiling of good portfolio design. It is the entry point. The next step in thinking is risk parity, which is less a rejection of 60/40 than an extension of its underlying logic.
Standard 60/40 allocates by dollar weight: 60 cents of every dollar to equities, 40 to bonds. The problem is that equities are far more volatile than bonds, so that split leaves the portfolio’s risk overwhelmingly driven by stocks. Risk parity allocates by risk contribution instead, sizing each asset so no single one dominates the portfolio’s volatility.
Applied properly, that approach widens the asset mix beyond two building blocks:
- Broad equities across multiple geographies
- Long-duration bonds
- Commodities
- Gold
Commodities and gold matter because they perform in exactly the regime where both stocks and bonds struggle. 2022 is the clearest example. The frameworks behind this thinking, Harry Browne’s Permanent Portfolio and AQR’s All Weather approach, are built to hold up across regimes rather than to win any single one.
The All Weather approach, built on a four-quadrant framework covering rising growth, falling growth, rising inflation, and falling inflation, deliberately sizes each asset by its risk contribution to each quadrant rather than by dollar weight, which is the structural logic behind why it holds up across regimes where 60/40 does not.
That last point demands honesty about recent performance. Morningstar data from 2025 shows the plain-vanilla 60/40, returning 13.3%, outperformed more complex multi-asset diversified mixes over one, three, and five years. The three- and five-year annualised 60/40 returns of 15.4% and 8% through mid-2026 reinforce that simplicity has paid recently.
A calibration point for your own tolerance Most professional and wealthy investors target daily profit-and-loss volatility of 1% to 2% and accept drawdowns of up to 20%. That drawdown figure is a useful benchmark when you assess how much portfolio pain you can genuinely stomach.
So why add complexity at all? Because risk-parity strategies underperform in one specific regime: when rapidly rising rates and inflation simultaneously penalise leveraged duration exposure. That is the 2022 scenario again.
The honest read for you is this. Multi-asset diversification is not a performance enhancer in every environment. It is insurance against the precise scenario where 60/40 breaks, and its value depends entirely on how probable you judge that scenario to be.
The risks that could break the revival again, and the signals to watch
Positive real yields make the strongest case for bonds in over a decade. They do not make it unconditional. Three specific conditions could undermine the revival, and each is worth monitoring rather than assuming away.
- Fiscal deficits and structurally elevated term premiums. Persistent large US deficits lead many analysts to expect higher term premiums. If investors demand greater compensation for holding US debt, long-duration bonds carry higher price volatility regardless of how attractive the real yield looks.
- Inflation persistence or a fresh flare-up. If inflation re-accelerates, the stock-bond correlation flips positive again and the 2022 dynamic returns. The entire revival is conditional on inflation staying contained.
Structural inflation signals, including the reversal of China’s deflationary tailwind and a diesel crack spread running four to five times its historical norm, suggest the inflation containment assumption underlying the bond revival may be harder to sustain than the current breakeven rate of 2.33% implies.
- Duration sensitivity at current yield levels. Even with real yields at 2.65% to 3.25%, a surprise upward move of 100 to 150 basis points would produce material bond losses. The protection is real, but it is not free.
The clearest signal to watch sits inside the Treasury’s own operations.
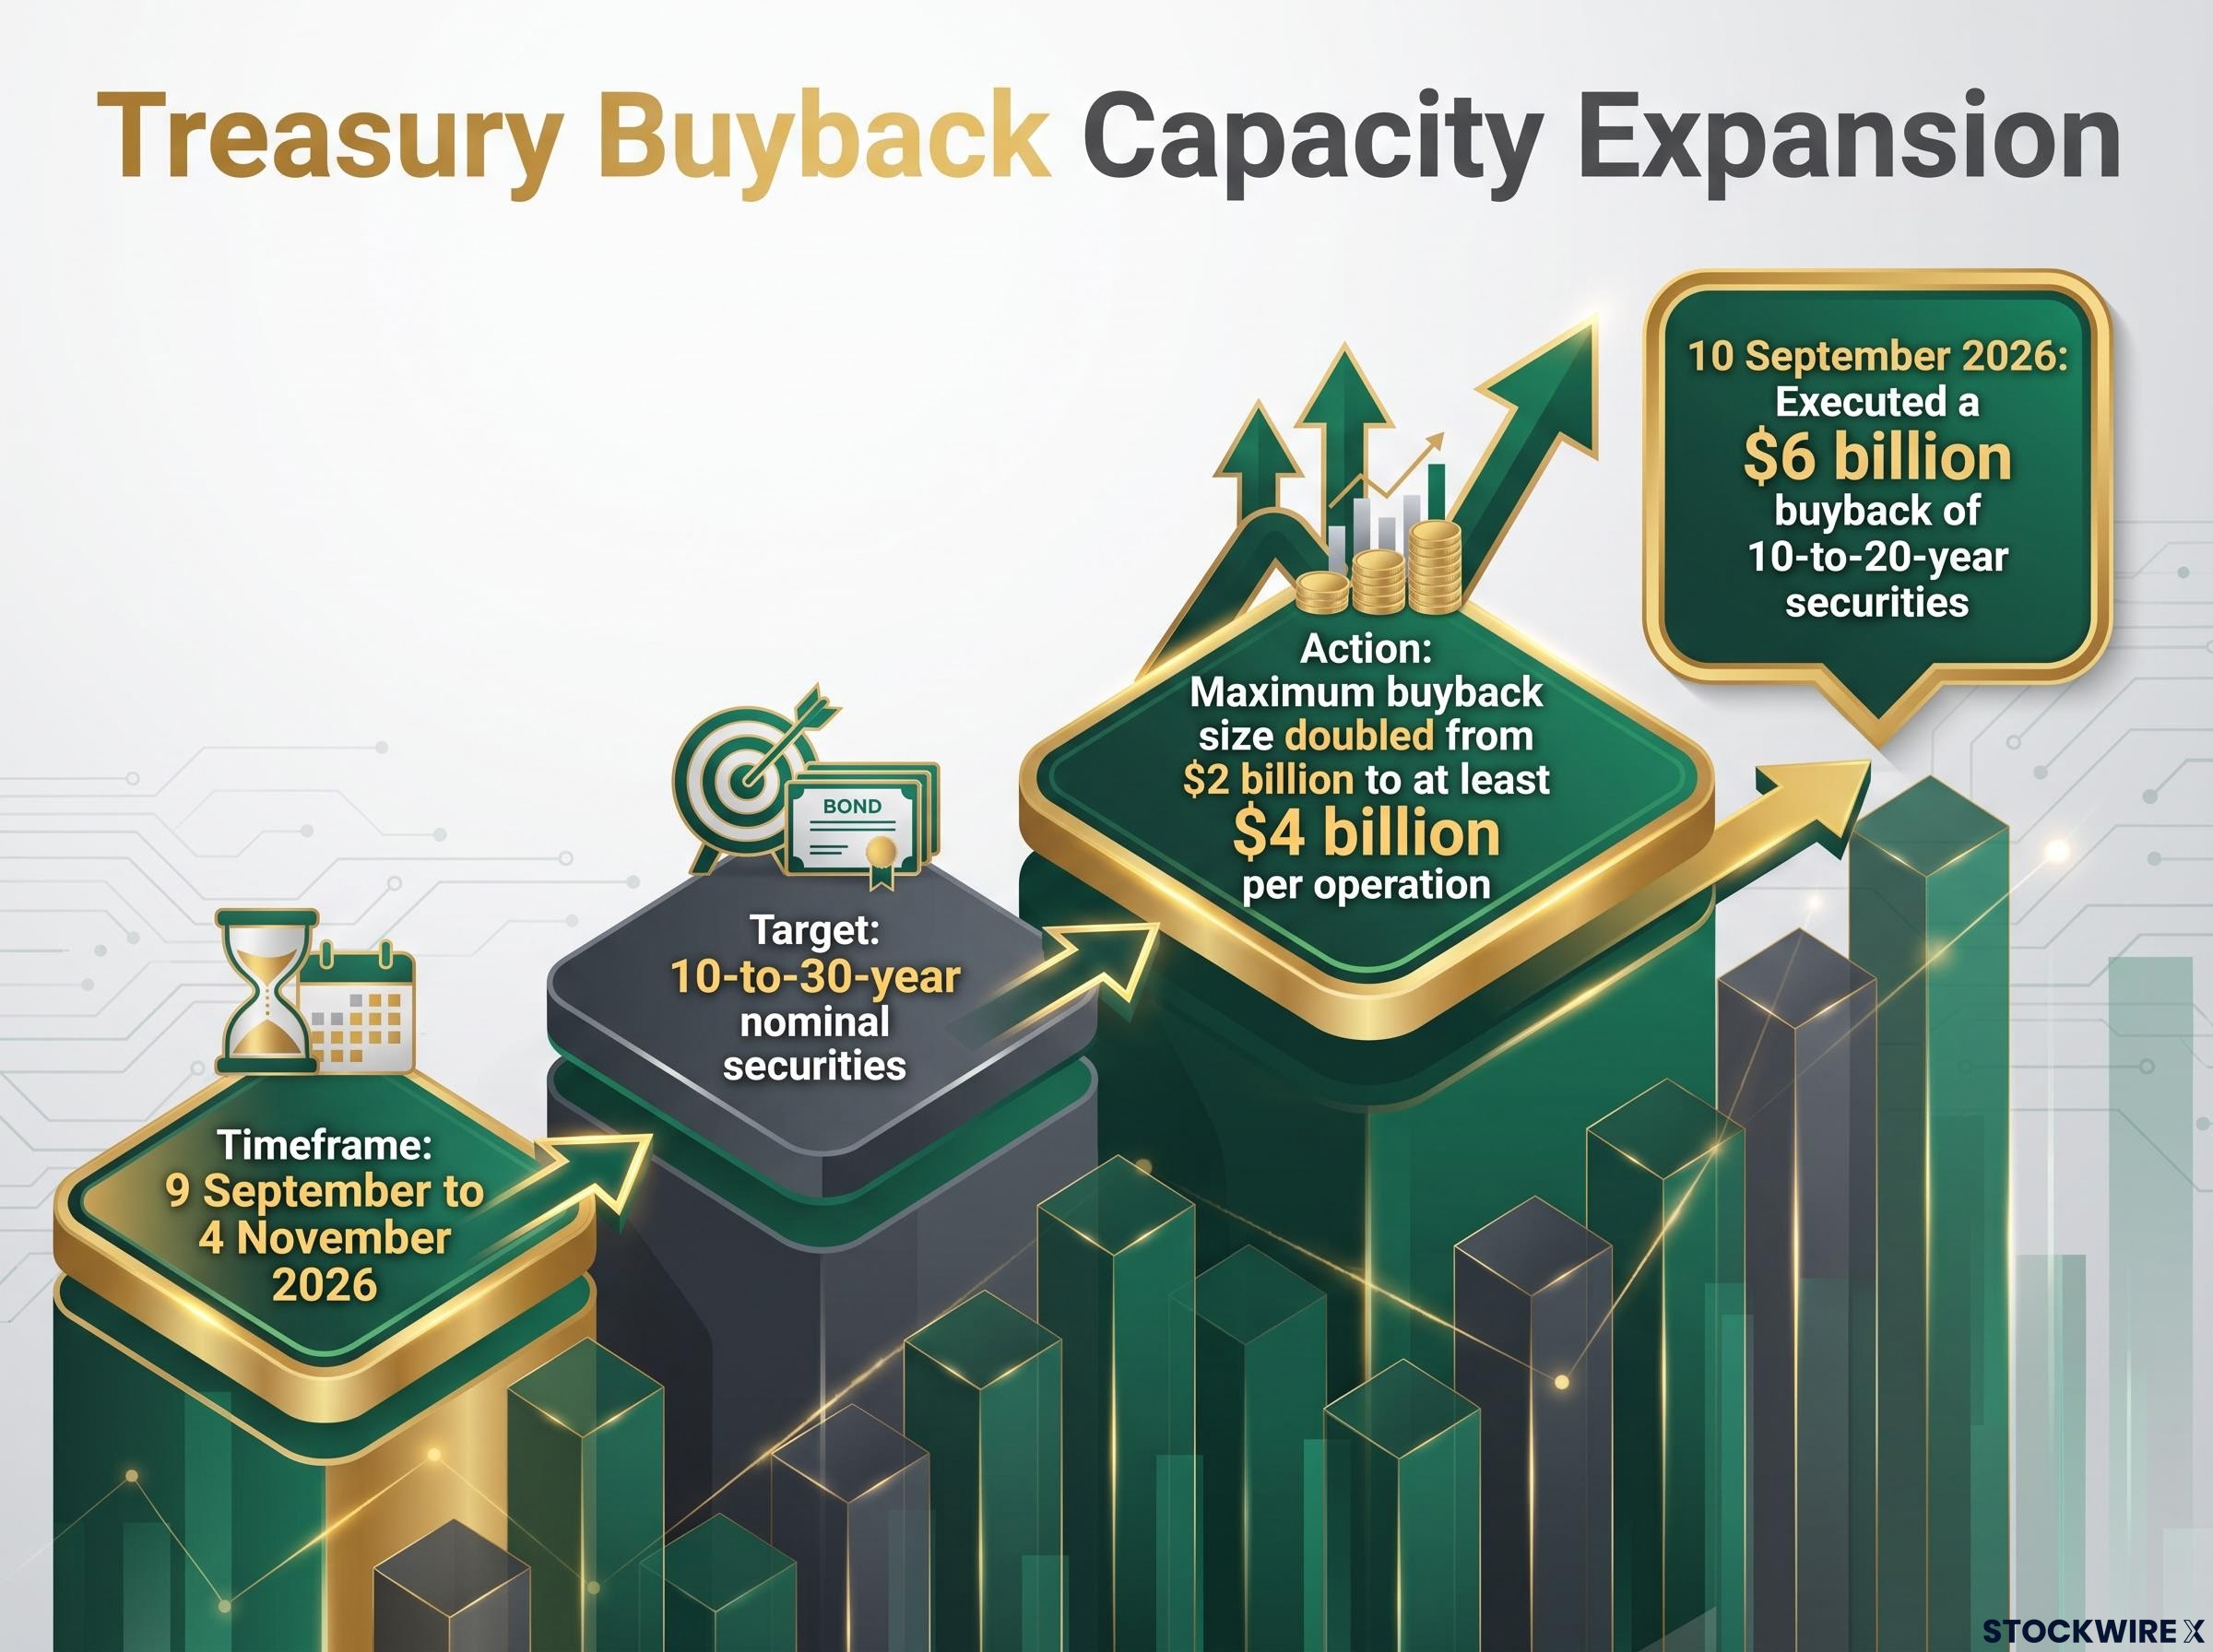
The buyback capacity has doubled Between 9 September and 4 November 2026, the Treasury doubled the maximum size of liquidity-support buybacks for 10-to-30-year nominal securities from $2 billion to at least $4 billion per operation. On 10 September 2026, it executed a $6 billion buyback of 10-to-20-year securities.
The programme is framed as liquidity support, and that may be all it is. But its expansion could also signal concern about the market’s capacity to absorb large nominal issuance without yields climbing further. That distinction is what you should watch, because it separates orderly market management from an attempt to suppress yields the market is structurally pushing higher.
What a reversal would look like before it fully arrives
You do not have to wait for the reversal to arrive to see it forming. There are observable precursors.
Watch for TIPS breakeven inflation rates, the market’s implied inflation expectation, climbing sustainably higher. Watch for the term premium widening, as measured by models like the ACM term premium estimate. And watch for a return to positive stock-bond correlation on growth-scare days, when both assets fall together despite a weakening-growth backdrop.
Context matters here too. There have been six significant rate-spike episodes since the pandemic, each of 50 to 125 basis points, and two-thirds reached new cycle highs. In three prior episodes, equities fell sharply before a policy pivot. In the most recent one, equities have held. That divergence is itself worth watching, because it may not last.
Separating your long-term foundation from short-term tactical positioning
One distinction resolves most of the confusion in portfolio strategy coverage: the difference between what you own and what you trade. Getting this clear is a relief, not a complication.
The beta layer is your long-term diversified base, built on risk-parity principles, held through volatility without any attempt to time the market. It is rule-based and low-maintenance. The alpha layer is short-term tactical positioning on a one-to-six-month horizon, and it is a fundamentally different activity.
Here is the contrast in plain terms:
- Beta: long-term, low-turnover, diversified, rule-based
- Alpha: short-term, high-conviction, skill-dependent, institutionally resourced
That second list is the part most retail investors underestimate. Generating alpha is described by practitioners as extremely difficult, requiring decades of expertise, real-time data infrastructure, and a disciplined risk framework that individual investors rarely have.
Look at what current tactical positioning actually involves. As of late September 2026, Constan’s portfolio at Damped Spring Advisors is running at 75% of its maximum risk target, implying a 3% drawdown limit against a 4% absolute maximum. His active positions include short equities, long long-duration bonds at maximum size, a small long position in the Japanese yen, and short-term interest rate futures.
Notice that this is a set of high-conviction, actively managed trades, not a static allocation. The beta portfolio and this tactical overlay are two entirely separate decisions.
The point for you is that they require entirely different skill sets. The beta foundation is achievable, well-specified, and something you can build and hold. The tactical overlay is not a retail activity without professional support. Blurring the two is the most common way investors end up underperforming the very strategy they set out to run.
What the data tells you, and what you still have to decide for yourself
Strip away the detail and the central finding is simple. Bonds are no longer the return-free risk of the zero-rate era. At real yields of 2.65% to 3.25%, they earn a place in a diversified portfolio on both income and diversification grounds. The 60/40’s year-to-date annualised return of 13.4%, a real 9.4% against a long-run real average of 5.5%, is what that shift looks like in practice.
But the case is conditional, and honesty requires saying so. The revival holds as long as inflation stays contained and term premiums do not rise structurally. Those are the two variables worth watching, not the daily price noise.
Two signals deserve a permanent place on your monitoring list:
- TIPS breakeven inflation rates rising sustainably higher
- A widening term premium on long-duration Treasuries
The real question is not whether bonds are good or bad. It is whether the specific conditions that make them work as a diversifier are more likely to persist or reverse, and what your portfolio would look like under each. The data makes the strongest case for bonds in over a decade. What you do with that case is your call to make, with informed and conditional conviction rather than either blind adoption or reflexive avoidance.
For readers wanting to stress-test the revival thesis before committing to duration, our full explainer on whether current real yields represent a cycle peak or a new structural floor examines the institutional split between the cyclical-peak camp and the fiscal-deficit-driven structural reset camp, with the specific variables each side is watching.
This article is for informational purposes only and should not be considered financial advice. Investors should conduct their own research and consult with financial professionals before making investment decisions. Past performance does not guarantee future results. Financial projections are subject to market conditions and various risk factors.