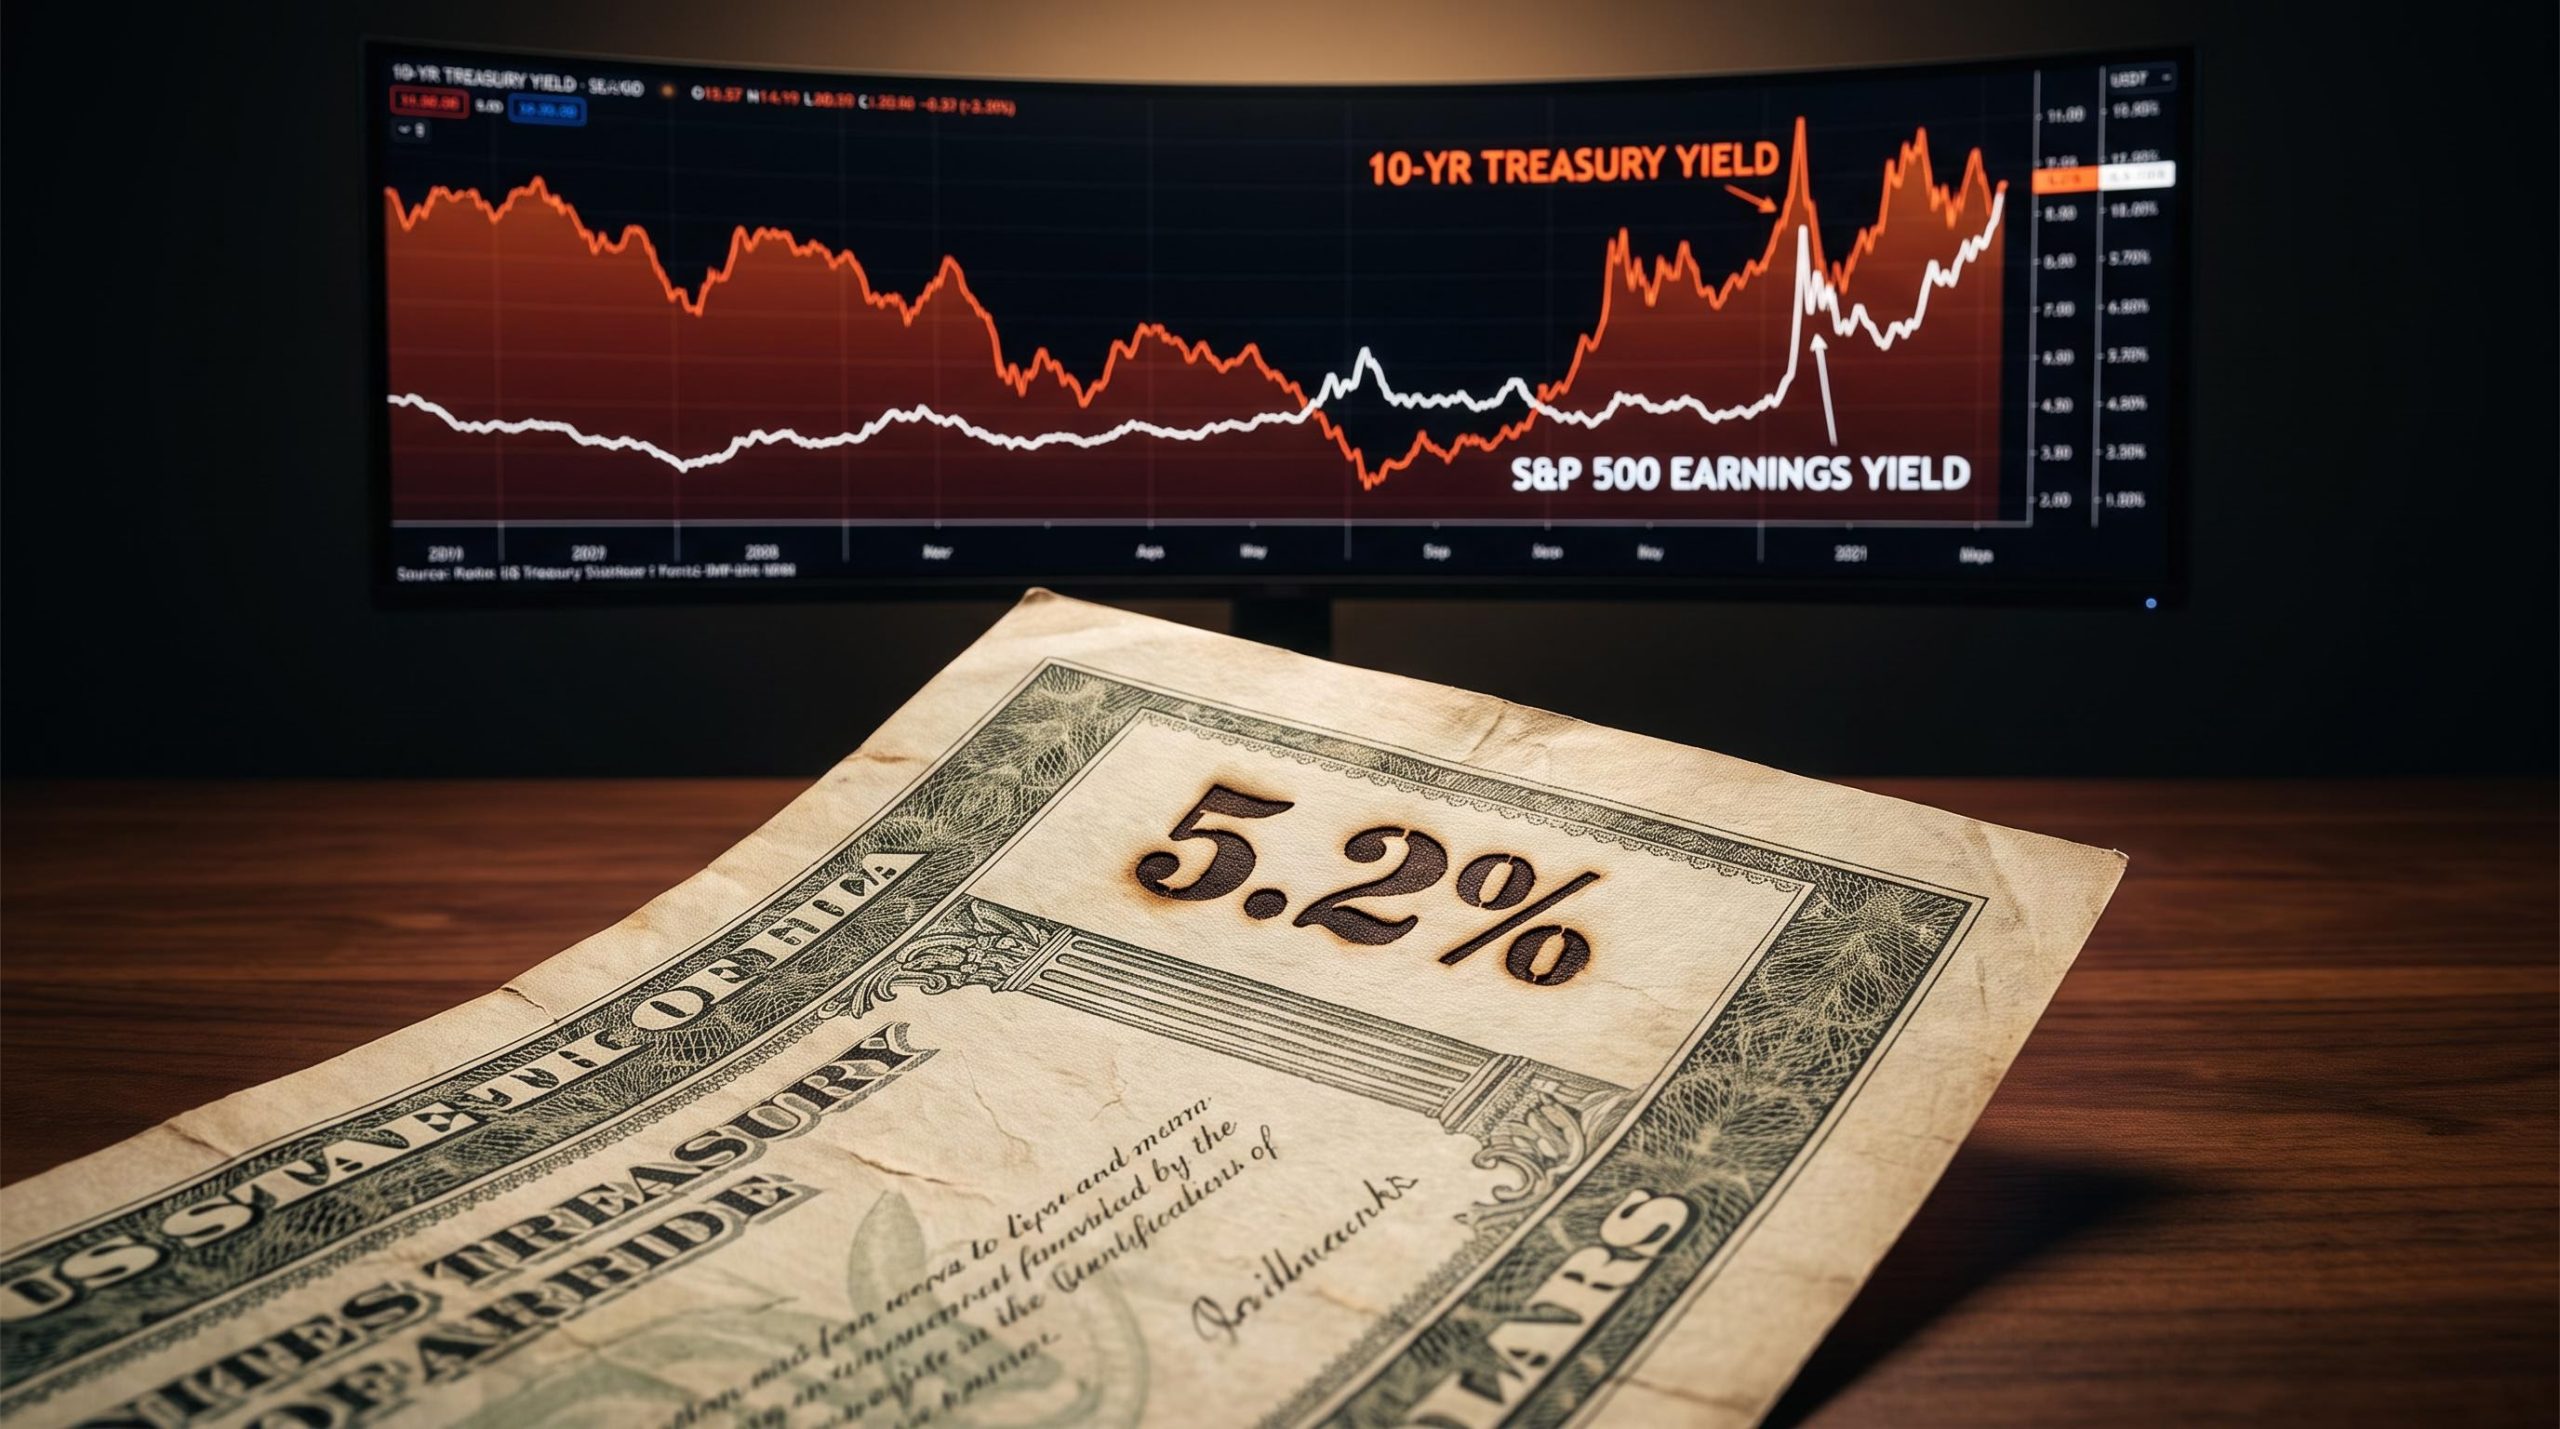
A risk-free US government bond now pays you more than 5%. At that level, it stops being background noise in the financial system and starts acting as a direct rival for every dollar you have parked in stocks.
That competition became impossible to ignore last week. On 25 September 2026, the 10-year Treasury yield reached 5.2% and the 30-year hit 5.49%, levels last seen in 2007 and 2004 respectively, according to Reuters. The speed of the climb matters as much as where it landed, because a fast move gives markets no time to adjust in an orderly way.
This is not only a bond story. When the yield you can earn for taking no risk climbs this high, it rewrites the maths behind every equity valuation on the board. Here is a framework for understanding what these levels actually mean for the risk sitting in your stock portfolio, and which variables will decide whether this environment sticks around or fades.
What a 5% Treasury yield actually signals
On a screen it looks like an ordinary number. In late trading on 25 September 2026, Reuters reported the benchmark 10-year Treasury yield at 5.158%, after touching an intraday high of 5.2297%, the highest since 2007. The 30-year yield closed at 5.4883%, after peaking at 5.5319% intraday, the highest since 2004.
Here are the four figures that define the moment:
- 10-year Treasury yield: 5.158% close, 5.2297% intraday high (highest since 2007)
- 30-year Treasury yield: 5.4883% close, 5.5319% intraday high (highest since 2004)
These are risk-free yields. The US government guarantees the return, which means they set the floor against which every other investment on earth gets priced. If Washington will pay you north of 5% for certainty, everything riskier has to offer more to justify the gamble.
Most people who follow markets watch the Fed funds rate and treat Treasury yields as an afterthought. That gets the causation backwards. The bond market is the leading indicator here, and it is telling you the price of safety has jumped.
The price-to-earnings inversion at the heart of this analysis rests on bond yield mechanics that many equity investors have never needed to understand before, because for most of the past decade yields were too low to matter as a competing return source.
The velocity of the move is its own separate risk, distinct from the level itself. Noel Smith, Managing Partner and Chief Investment Officer at Convex Asset Management, flagged the recent three-day move in yields as notably swift, and swiftness is precisely the problem.
The speed is the risk When yields climb this fast, markets cannot reprice corporate debt costs quickly enough to keep up. Sharp rises in interest rate volatility become disruptive because participants are forced to reassess financing costs across every credit category at once, according to Noel Smith of Convex Asset Management.
That is the insight to carry forward. When the risk-free rate lurches this quickly, the entire financial system has to recalibrate simultaneously, and you absorb that shock through your equity holdings whether or not a single company you own has ever issued a bond.
When big ASX news breaks, our subscribers know first
Why bonds and stocks are now competing for the same dollar
Start with a simple question. If a stock index and a government bond both offered you the same yield, why would you take on the risk of the stock?
To answer that, you need the earnings yield. The S&P 500 earnings yield is the inverse of the price-to-earnings ratio: it tells you how much the companies in the index are earning per dollar you invest, expressed as a percentage. That makes it the correct like-for-like comparison against a Treasury yield.
For most of the past three decades, equities paid a premium over bonds on this measure. According to Syz Group, the average spread since 1995 has been +1.55 percentage points in favour of stocks. That premium was the reason investors accepted equity risk in the first place. They were being paid extra for it.
Look at what has happened to that cushion.
| Time period | S&P 500 earnings yield | 10-year Treasury yield | Spread |
|---|---|---|---|
| Long-run average (1995 to present) | Higher than Treasuries | Lower than earnings yield | +1.55 pp |
| Mid-June 2026 (Syz Group) | 3.67% | 4.48% | -0.81 pp |
| Late September 2026 (broadcast session) | ~5.24% | Above 5.1% | Roughly flat |
According to Syz Group’s note published on 24 June 2026, the spread had turned negative, sitting at -0.81 percentage points and in just the 15th percentile of its 31-year history. By late September, with the earnings yield near 5.24% and the 10-year above 5.1%, the two had converged to roughly the same level.
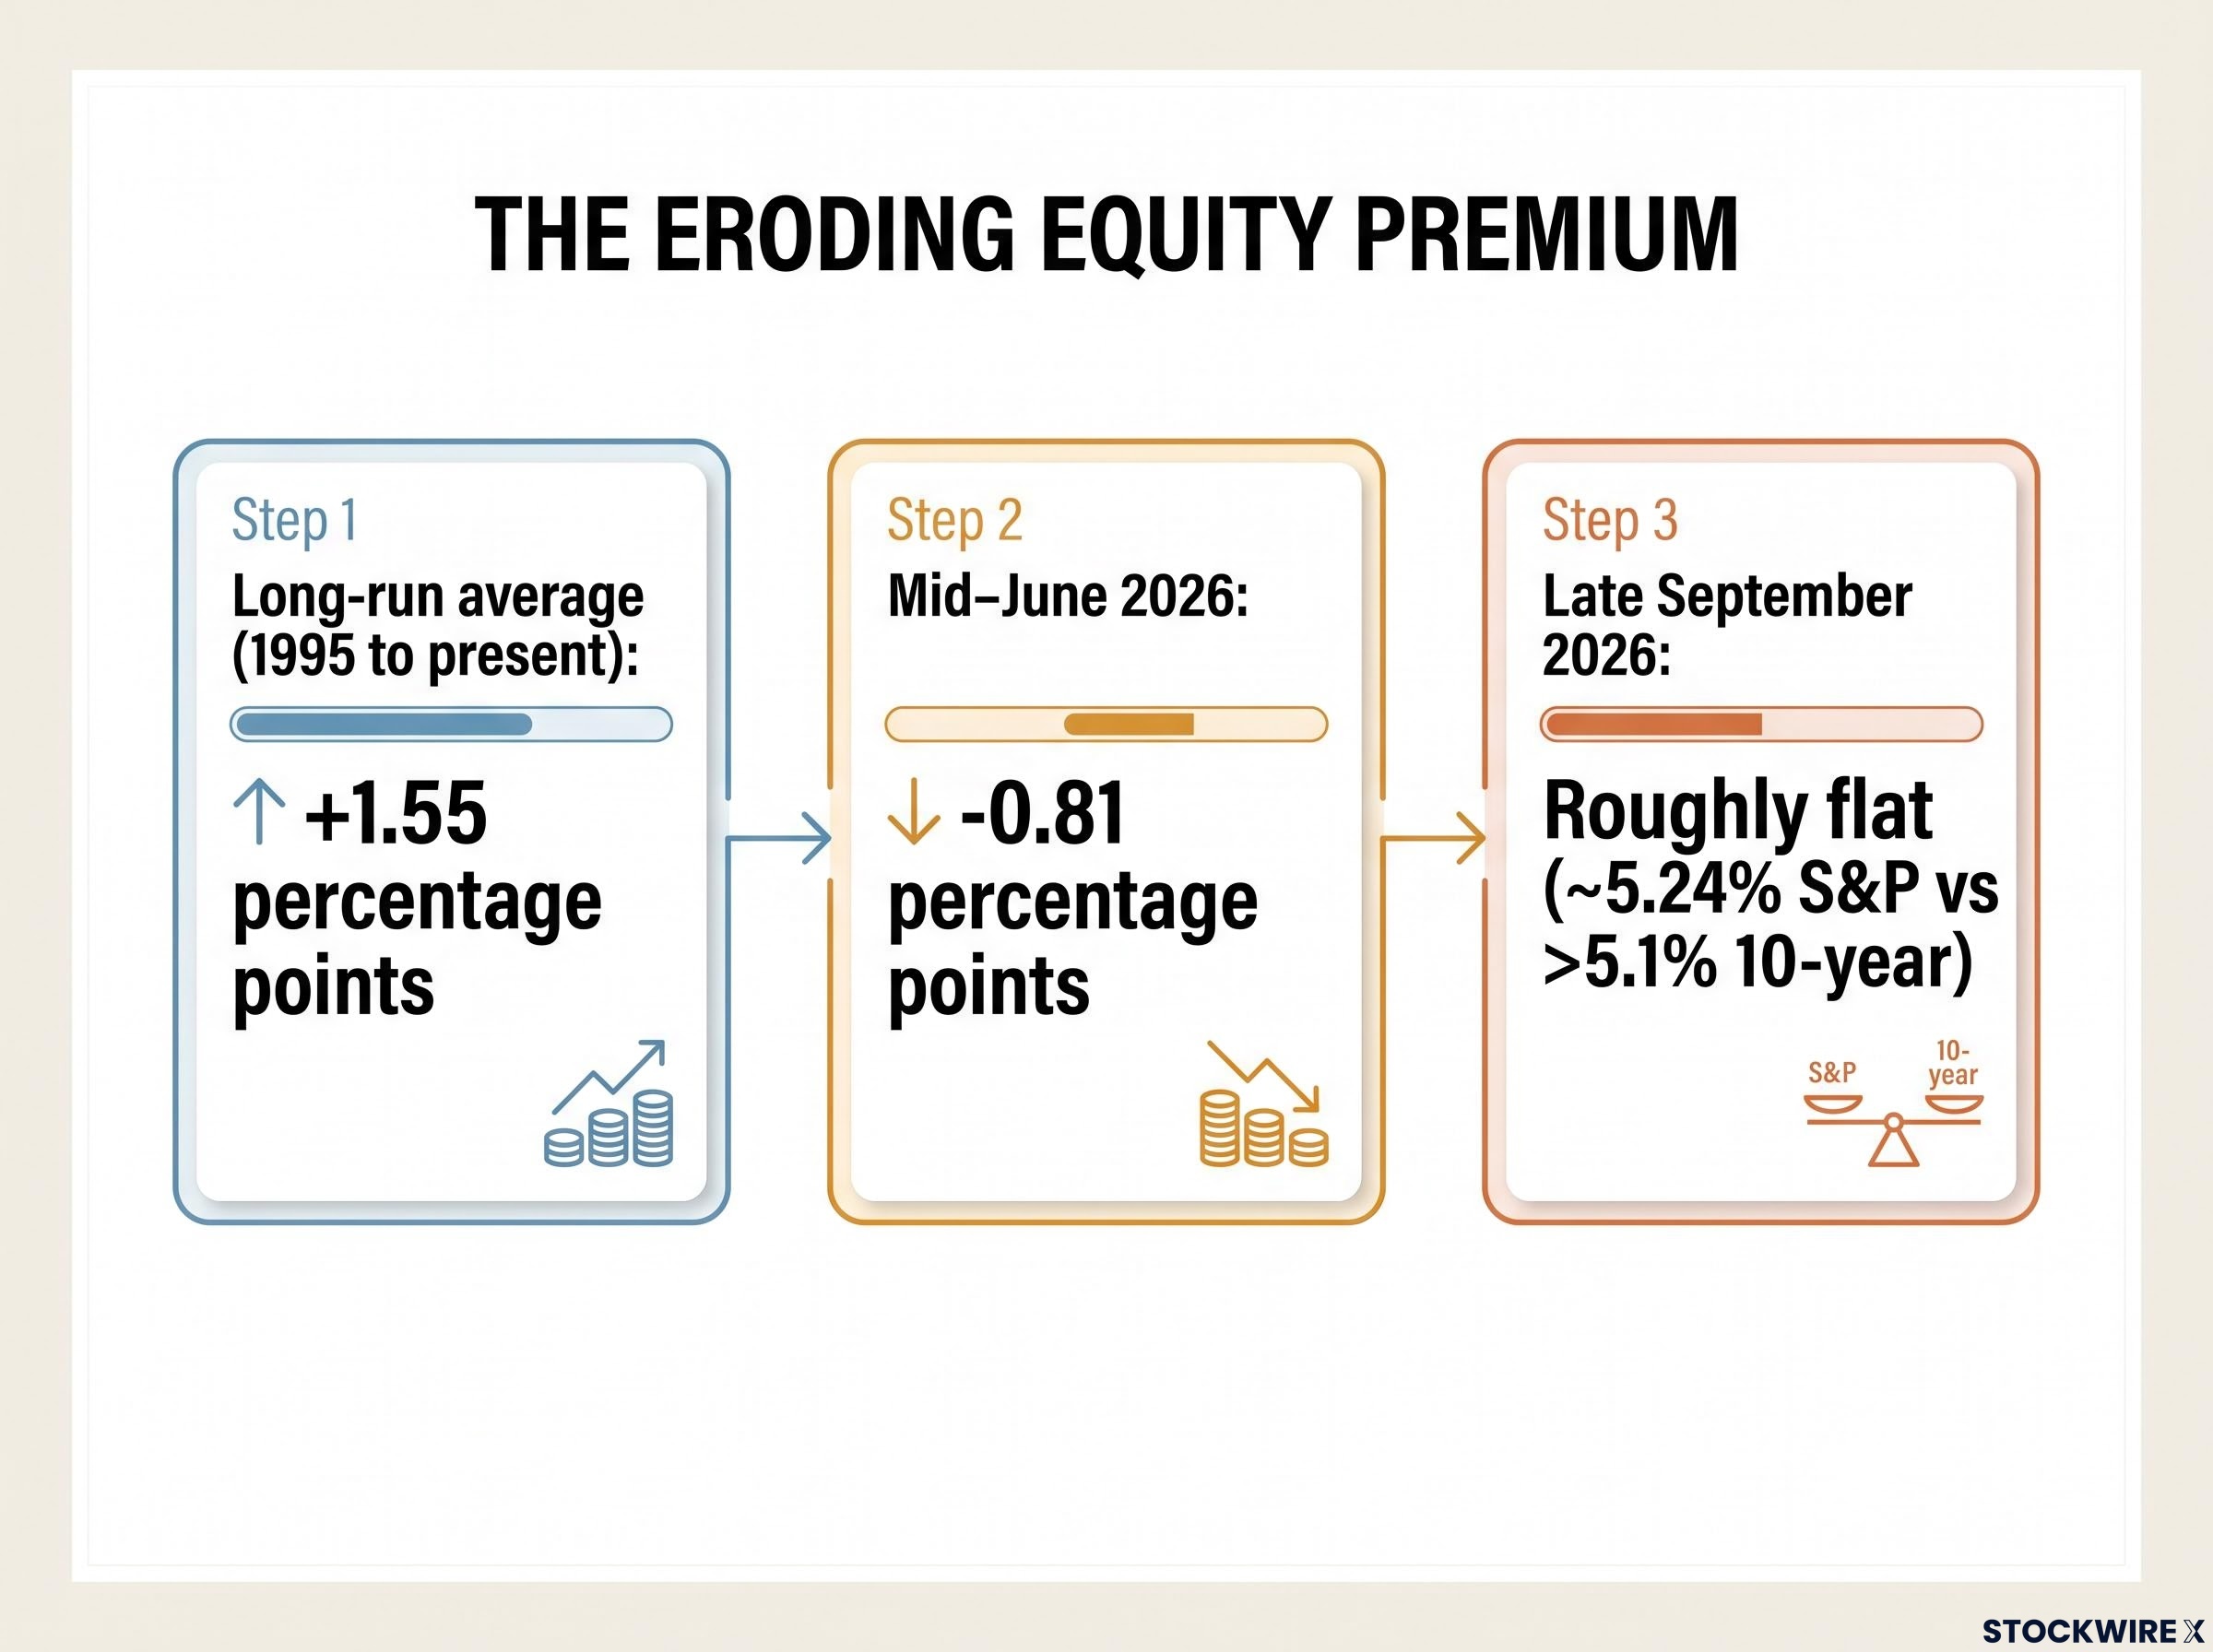
What this means for you personally is stark. The return you are implicitly accepting for holding equity risk is now roughly what the US government will pay you for holding no risk at all. That is the central tension pulling at every capital allocation decision right now, and it is why Syz Group calls this “the return of competition for capital.”
The last time this happened was the dot-com era
This configuration is rare. Hartford Funds’ September 2026 commentary points out that since early 2024, 10-year Treasury yields have outpaced the S&P 500 earnings yield, a reversal “not seen since the dot-com era.”
The comparison is worth understanding, not as a forecast but as a calibrating precedent. In the late 1990s, equity valuations were stretched and earnings yields were compressed. When bonds began genuinely competing for capital, the re-pricing of equity risk that followed was both significant and prolonged.
Hartford’s data covers from mid-1996 to mid-2026, and for most of those thirty years equities offered the higher earnings yield. The recent crossover is the exception, not the rule, which is precisely why institutional analysts are paying attention to it now.
How rising yields travel from the bond market into your equity portfolio
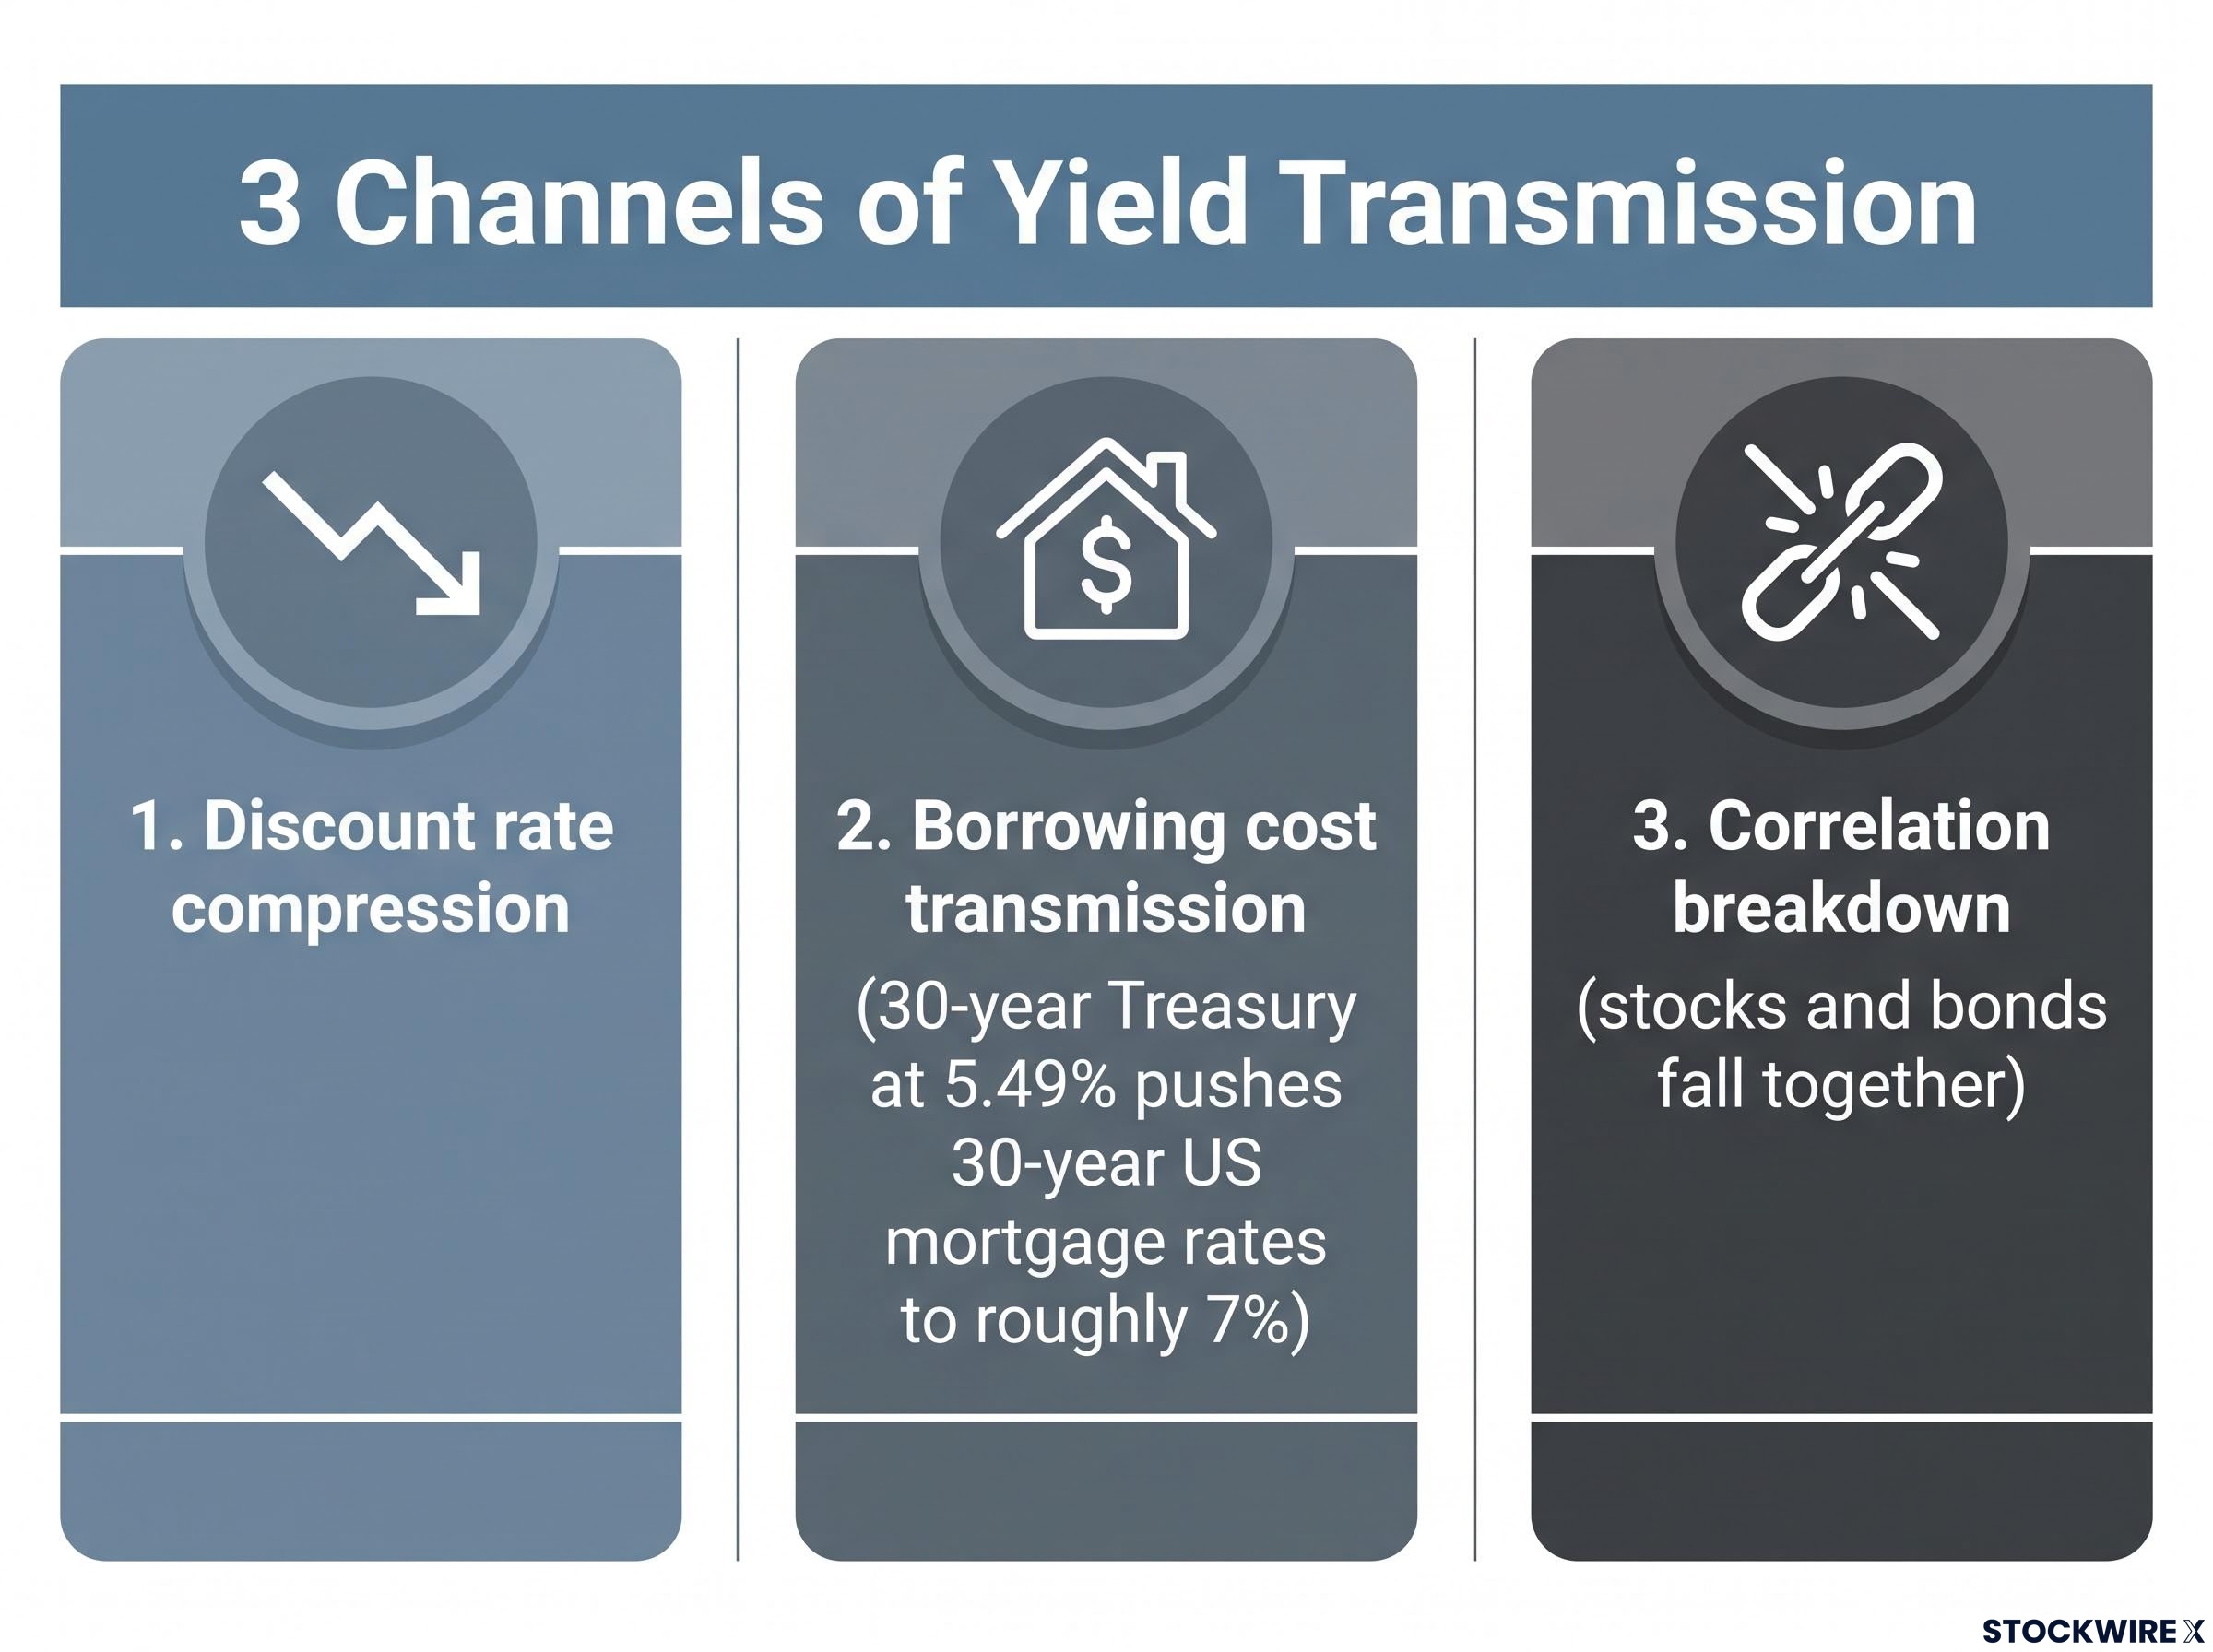
You do not need to own a single bond for rising yields to erode the value of your stocks. The transmission happens automatically, through three channels.
- Discount rate compression: Higher Treasury yields raise the rate at which future corporate earnings are discounted back to today, which lowers the present value of growth stocks even when their actual earnings have not changed. Syz Group notes that elevated yields tighten financial conditions by raising companies’ cost of equity and reducing the appeal of high-valuation growth strategies.
- Borrowing cost transmission: Bond market moves feed straight into real-economy financing, with the 30-year Treasury surge pushing 30-year mortgage rates to roughly 7%, according to Reuters.
- Correlation breakdown: When yields rise rapidly, stocks and bonds tend to fall together, breaking the assumption that bonds cushion equity drawdowns. Noel Smith of Convex Asset Management described stock-bond correlations as at or near all-time highs.
That mortgage figure is worth pausing on, because it makes the abstract concrete.
From the bond market to your monthly payment The 30-year Treasury yield at 5.49% has pushed 30-year US mortgage rates to roughly 7%, according to Reuters. That is the bond selloff arriving directly at household budgets, and the same mechanism raises corporate borrowing costs across the economy.
The correlation breakdown deserves the most attention, because it undermines the one assumption most portfolios are built on. Smith explained that a company’s access to reasonably priced credit shapes how volatile its stock tends to be, using the analogy of an individual with poor credit access making riskier financial decisions. When bond volatility rises, financial conditions tighten for equities too, and the diversification you thought you had quietly stops working.
The stock-bond correlation breakdown is not incidental to this environment: UBS research places the two-month rolling correlation between the S&P 500 and the 10-year Treasury yield at -0.69, the most extreme negative reading since 1996, and identifies core PCE above 3.1% as the threshold that keeps bonds from cushioning equity drawdowns.
Reuters attributes the proximate pressure to oil above $90 a barrel, geopolitical tensions, resilient growth, and elevated government spending. Whatever the trigger, the takeaway for you is the same: the channels linking yields to your equity value are structural and automatic, not optional.
Is this a permanent shift or a policy-cycle spike? What the futures market is saying
Here is where the genuine debate lives, and it is unresolved among institutional analysts as of late September 2026. Two credible frameworks compete to explain what is happening.
| Factor | Structural view | Cyclical view |
|---|---|---|
| Earnings yield spread | Negative almost continuously since May 2025, now in the 15th percentile of 31-year history: a regime change (Syz Group) | A temporary distortion driven by specific shocks that can reverse (Reuters) |
| Historical precedent | Reversal not seen since the dot-com era, signalling a lasting phase of bond-equity competition (Hartford Funds) | Yields tied to reversible drivers: oil above $90, geopolitical tension, fiscal supply concerns (Reuters) |
| Fed policy | Higher real rates as a durable feature of the environment | Elevated yields reflect a near-term tightening cycle, not a permanent floor |
The structural case rests on persistence. Syz Group argues that the spread staying negative almost continuously since May 2025, so far below its long-run average, means equity valuations have not yet fully adjusted to a world where risk-free yields compete head-on with earnings yields. Hartford Funds reinforces this by framing the dot-com comparison as a lasting phase rather than a blip.
Real yield movements are driving most of the pressure: Bruegel data attributes roughly 80% of the rise in long-term US rates since late 2024 to the real yield component rather than inflation expectations, classifying the selloff as a discount-rate shock rather than a straightforward inflation story.
The cyclical case rests on specific, reversible triggers. Reuters attributes the yield surge to oil above $90, geopolitical tension, and worries about government debt supply. If those pressures ease, yields could retreat.
Fed futures pricing supports the cyclical read in the near term. This is the single number you can track in real time.
What the futures market is pricing The Investing.com Fed Rate Monitor showed a 66.6% probability of a 25-basis-point hike at the next FOMC meeting as of 26 September 2026, with the target range shifting toward 4.00-4.25%. The broadcast session put the odds nearer 70%, with ZQ futures pricing roughly four more hikes over the following year.
The right question to carry into your own portfolio review is not “are yields high?” That much is settled. The question is whether you believe these drivers are permanent or reversible, because your answer determines whether current equity valuations look like a risk to trim or an opportunity to hold.
Navigating equity risk when the risk-free rate is no longer free from competition
For most of the past thirty years, holding stocks meant accepting risk in exchange for a return premium over bonds, that +1.55 percentage point cushion Syz Group identified. That premium has collapsed. If you have not re-examined your risk-to-return expectations, you are holding the same positions under fundamentally different conditions.
The useful posture is not to predict where yields go next. It is to know exactly what to watch. Three observable data points will tell you when the environment shifts.
- The October FOMC decision: With roughly 67-70% odds of a hike already priced in, the surprise lies in the gap between what the Fed delivers and what futures expect, so watch how the pricing moves after the meeting rather than the decision alone.
- The oil price trajectory: With crude above $90 a barrel feeding inflation fears, a sustained fall would strengthen the cyclical case that yields can retreat, while a further climb reinforces the structural read.
- The earnings yield spread: Track the S&P 500 earnings yield minus the 10-year Treasury yield as a live gauge of whether stocks are paying you enough for their risk. A move back toward the long-run average signals equities are compensating you again; a deepening negative spread says the opposite.
The core question is simple to state and hard to answer: are equities paying you enough to take on risk relative to a 5%-plus risk-free alternative? Those three variables will tell you when the answer changes.
For investors wanting to map these yield dynamics onto specific holdings, our dedicated guide to rate-sensitive assets walks through how TLT, IEF, LQD, and XLU each respond to this environment, including the institutional barbell strategy now being used to navigate the structural-versus-cyclical uncertainty.
This article is for informational purposes only and should not be considered financial advice. Investors should conduct their own research and consult with financial professionals before making investment decisions. Past performance does not guarantee future results, and the structural versus cyclical debate discussed here remains speculative and subject to change based on market developments.