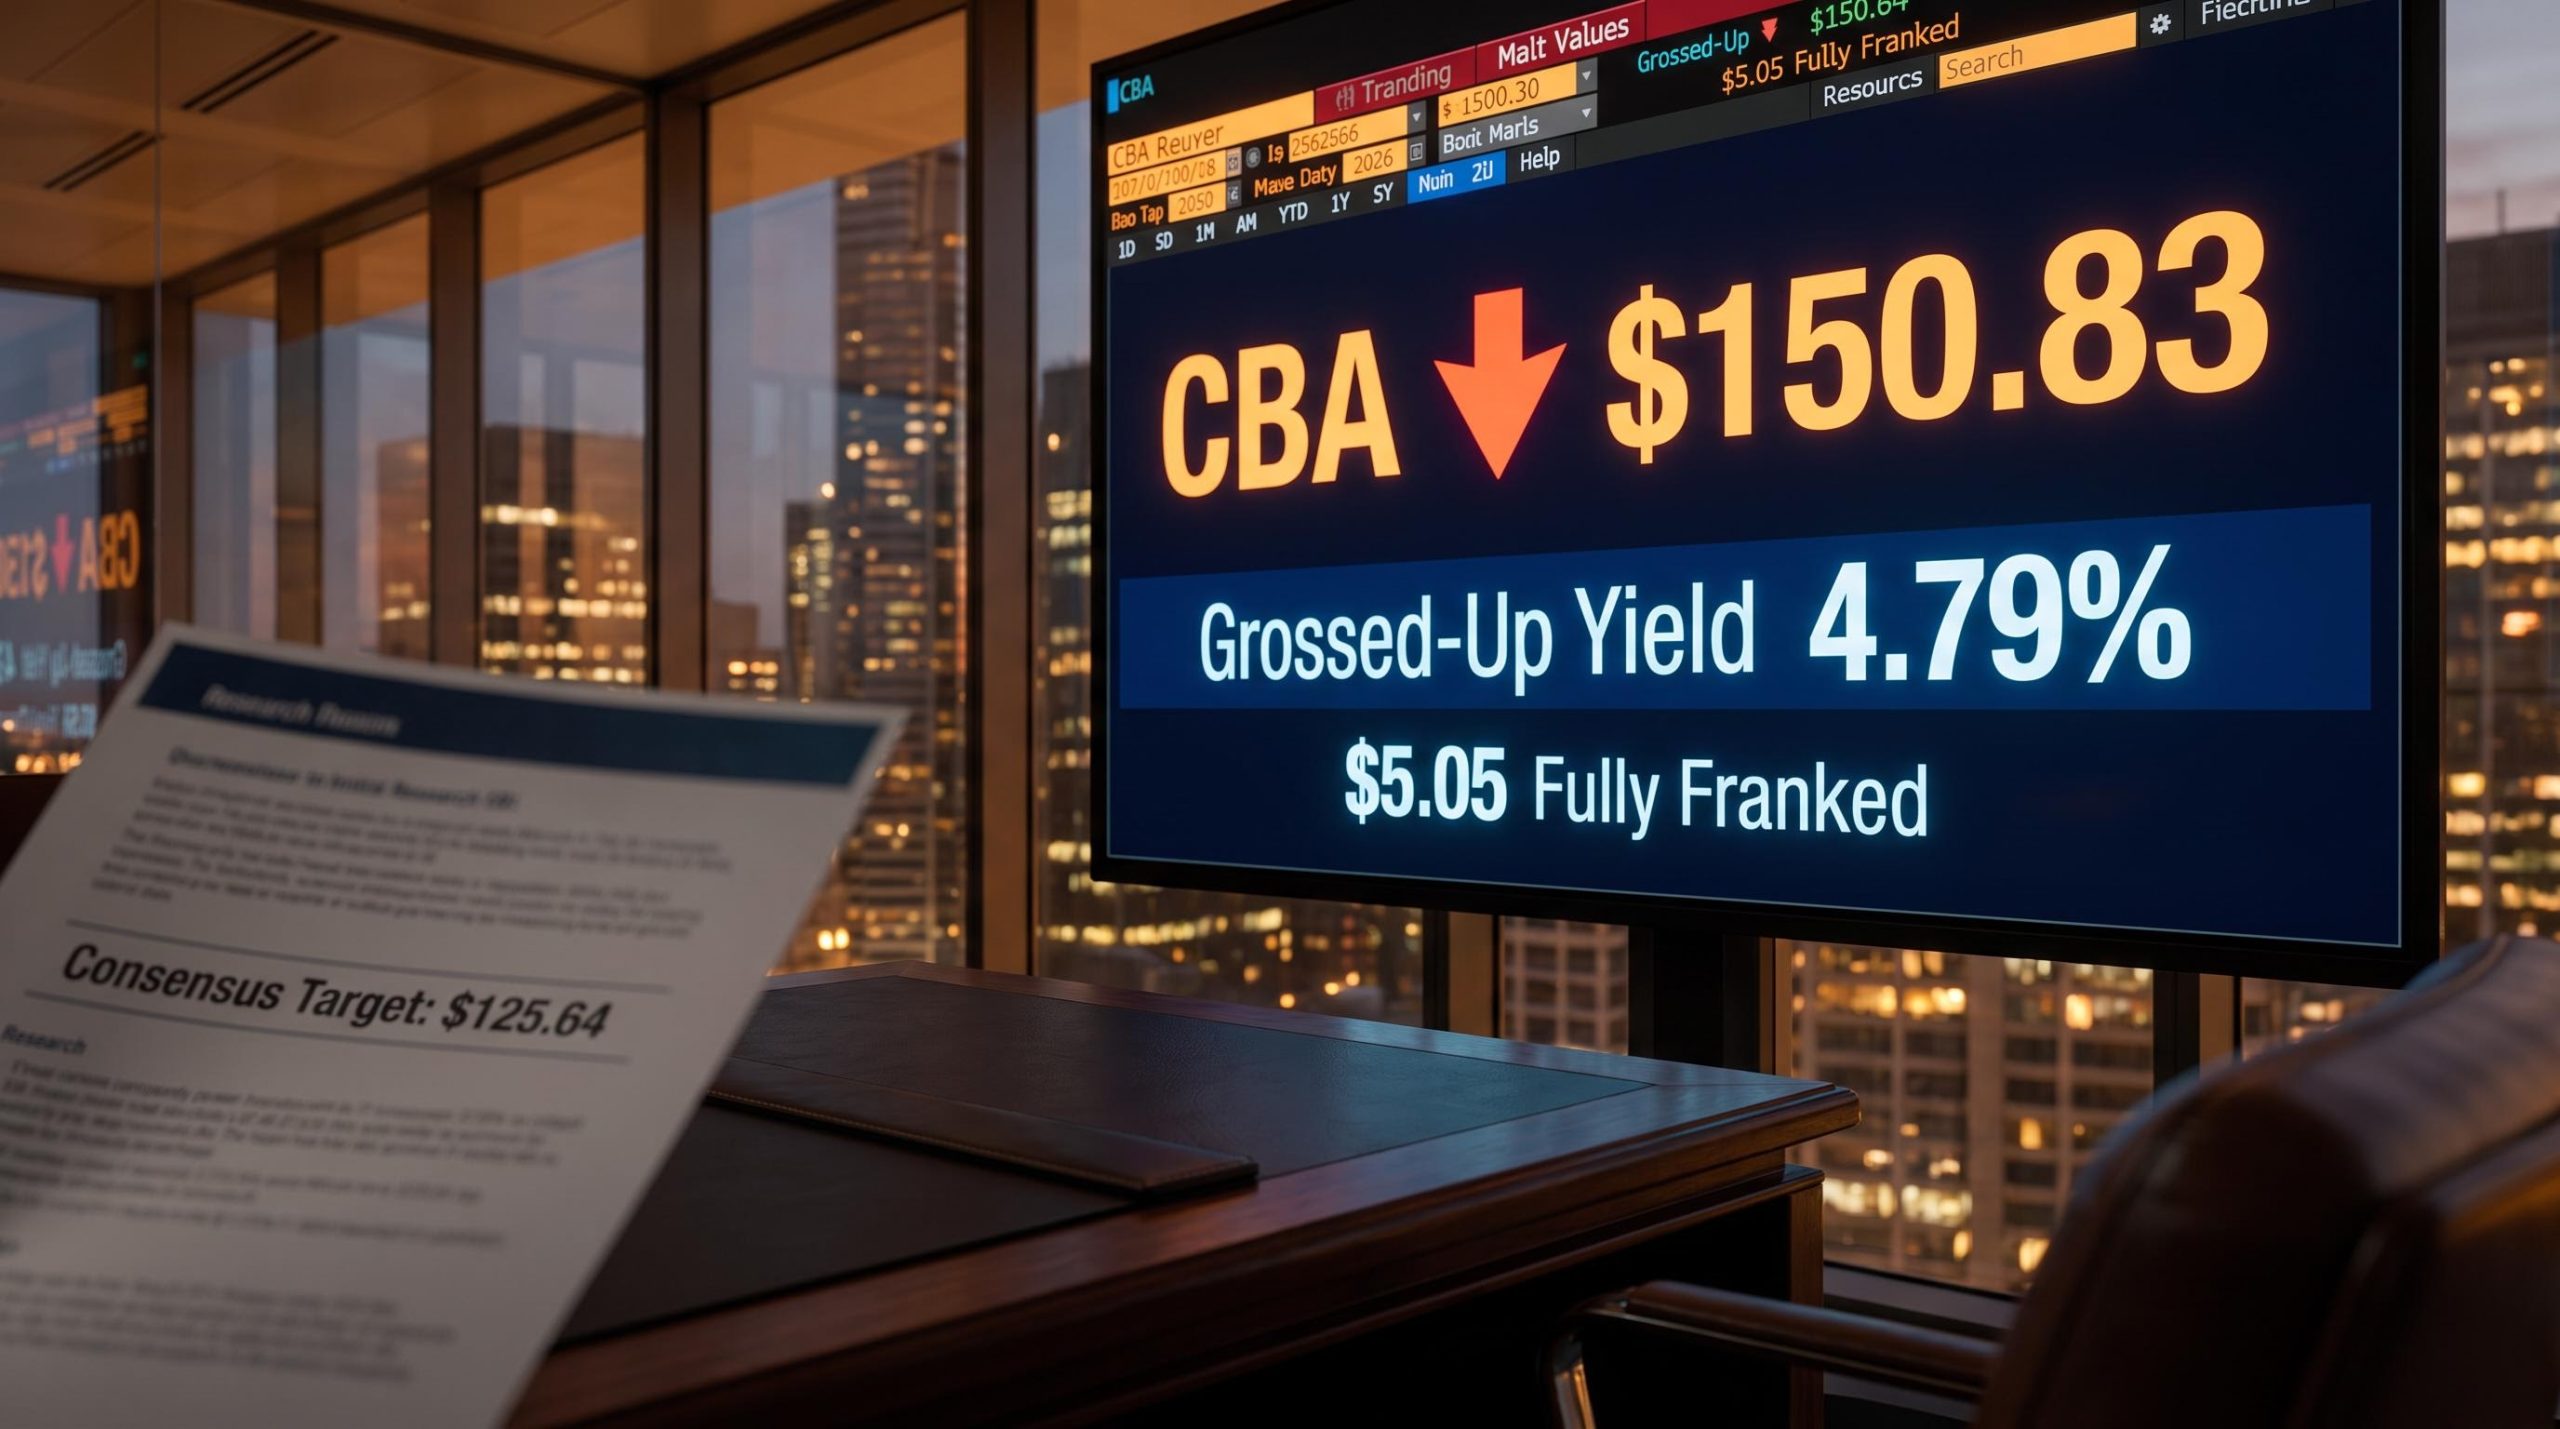
Commonwealth Bank of Australia just delivered a record annual profit and lifted its dividend for the sixth year running. Its shares are down roughly 16.9% from their August peak.
That contradiction is the whole story. The payout grew; the price fell. For income investors, the gap between those two facts has quietly opened up a number that did not exist a few weeks ago.
When CBA traded above $180 in early August 2026, its dividend yield sat below 3%. At the late-September price of roughly $150.37 to $150.83, the same $5.05 fully franked dividend now produces a trailing yield of approximately 3.36%. The bank’s six-year dividend growth streak is the other data point in play.
This analysis breaks down what that yield actually looks like at current prices, what six consecutive years of dividend increases tell you about the odds of a seventh, and what the risks are before you make an income-oriented decision on the stock. Treat it as a tool for that call, not a recap of the selloff.
What a 16.9% selloff actually does to CBA’s yield
Start with the arithmetic, because it moves in a way that surprises a lot of income investors. The dividend does not change when the price falls. The yield does.
CBA declared a total FY2026 dividend of $5.05 per share, fully franked, made up of a $2.35 interim paid in February 2026 and a $2.70 final that went ex-dividend on 19 August 2026 and was paid on 29 September 2026.
That $5.05 is fixed. Once declared, it does not respond to the share price. So when the stock sat above $180 in early August, the yield on that same payout was only about 2.81%. Drop the price to $150.83 and the identical dividend suddenly yields roughly 3.36%. The bank did not pay more. The market simply lowered the entry cost.
Dividend trap signals are worth reviewing before acting on a yield that has improved purely because the share price fell, because a rising yield driven by capital decline and a rising yield driven by genuine income growth require different portfolio responses.
| Share Price | Annual Dividend | Trailing Yield | Grossed-Up Yield (30% tax) |
|---|---|---|---|
| $180.00 | $5.05 | 2.81% | 4.01% |
| $165.00 | $5.05 | 3.06% | 4.37% |
| $150.83 | $5.05 | 3.36% | 4.79% |
The selloff has mechanically improved the entry yield by roughly 55 basis points against the August peak. That is real, and it is the reason a commercial-intent reader is looking at this stock now rather than a month ago.
The 3.36% trailing yield This is the yield on the dividend CBA has already paid. A buyer entering today has missed both the February interim and the September final for FY2026.
There is the catch. The $5.05 was a 20-cent lift on the FY2025 total of $4.85, a 4.12% increase, but you cannot buy that dividend now. It has been paid. Enter at $150 today and you are buying the yield of the next dividend, not the one just banked. The income case, in other words, depends entirely on what FY2027 delivers.
When big ASX news breaks, our subscribers know first
Why the stock fell, and what the correction does and does not tell you about CBA’s fundamentals
Not all of that 16.9% fall means the same thing. Some of it was pure mechanics. Some of it was a genuine reassessment of what the stock is worth. Pulling those apart is the difference between reacting to a one-off repricing and reading a real signal.
Four forces drove the decline:
- The ex-dividend adjustment. When the $2.70 final dividend went ex on 19 August 2026, the share price dropped to reflect that the entitlement had left the stock. This accounted for nearly one-third of the roughly 5.5% weekly fall around that date. It is repricing, not selling.
- Profit-taking on a result already priced in. CBA beat profit forecasts on 12 August 2026, yet shares fell more than 2% over the following two sessions. Investors treated a strong headline as fully anticipated and used it to trim exposure.
- A premium valuation correction. Analyst consensus sits well below where the stock has been trading, signalling that CBA was priced above modelled fair value.
- Broader sector pressure. Banks and miners both weighed on the ASX over the same period, adding a market-wide risk-off tone on top of the stock-specific moves.
Sector-wide margin pressure has been a consistent feature of ASX bank reporting in 2026, with deposit competition and mortgage refinancing compressing NIM from both sides across the Big Four, a dynamic that gives CBA’s 3-basis-point decline additional context beyond its own operating performance.
The valuation piece is where the real signal lives. As at 25 September 2026, the average 12-month analyst price target for CBA stood at $125.64, with a high of $144.99 and a low of $90.00.
Consensus 12-month price target: $125.64 That implies roughly 16.7% further downside from the late-September price of around $150.83.
Citi maintained a “Sell” rating with a target of $141.00 as at 16 September 2026, having lifted it from a prior $135.00. Notice what that means: even the more constructive “Sell” case sits below recent trading levels. When the most generous bearish estimate still points down, the correction is not a market overreaction to bad news. It is a partial normalisation from a price that was already stretched.
For your purposes, the distinction is practical. The ex-dividend portion is done and will not repeat. The valuation compression is an ongoing signal that the stock may have further to travel before it meets analyst-implied fair value.
Six years of consecutive dividend growth: how reliable is the streak, and what could break it?
CBA has raised its dividend every year from FY2021 through FY2026. Six straight increases, built off a low base after the bank cut its payout in 2020 when pandemic uncertainty and Australian Prudential Regulation Authority (APRA) guidance pushed the major banks to reduce distributions.
That streak is a genuine signal of earnings discipline, not marketing. The question is what would have to hold for it to reach seven.
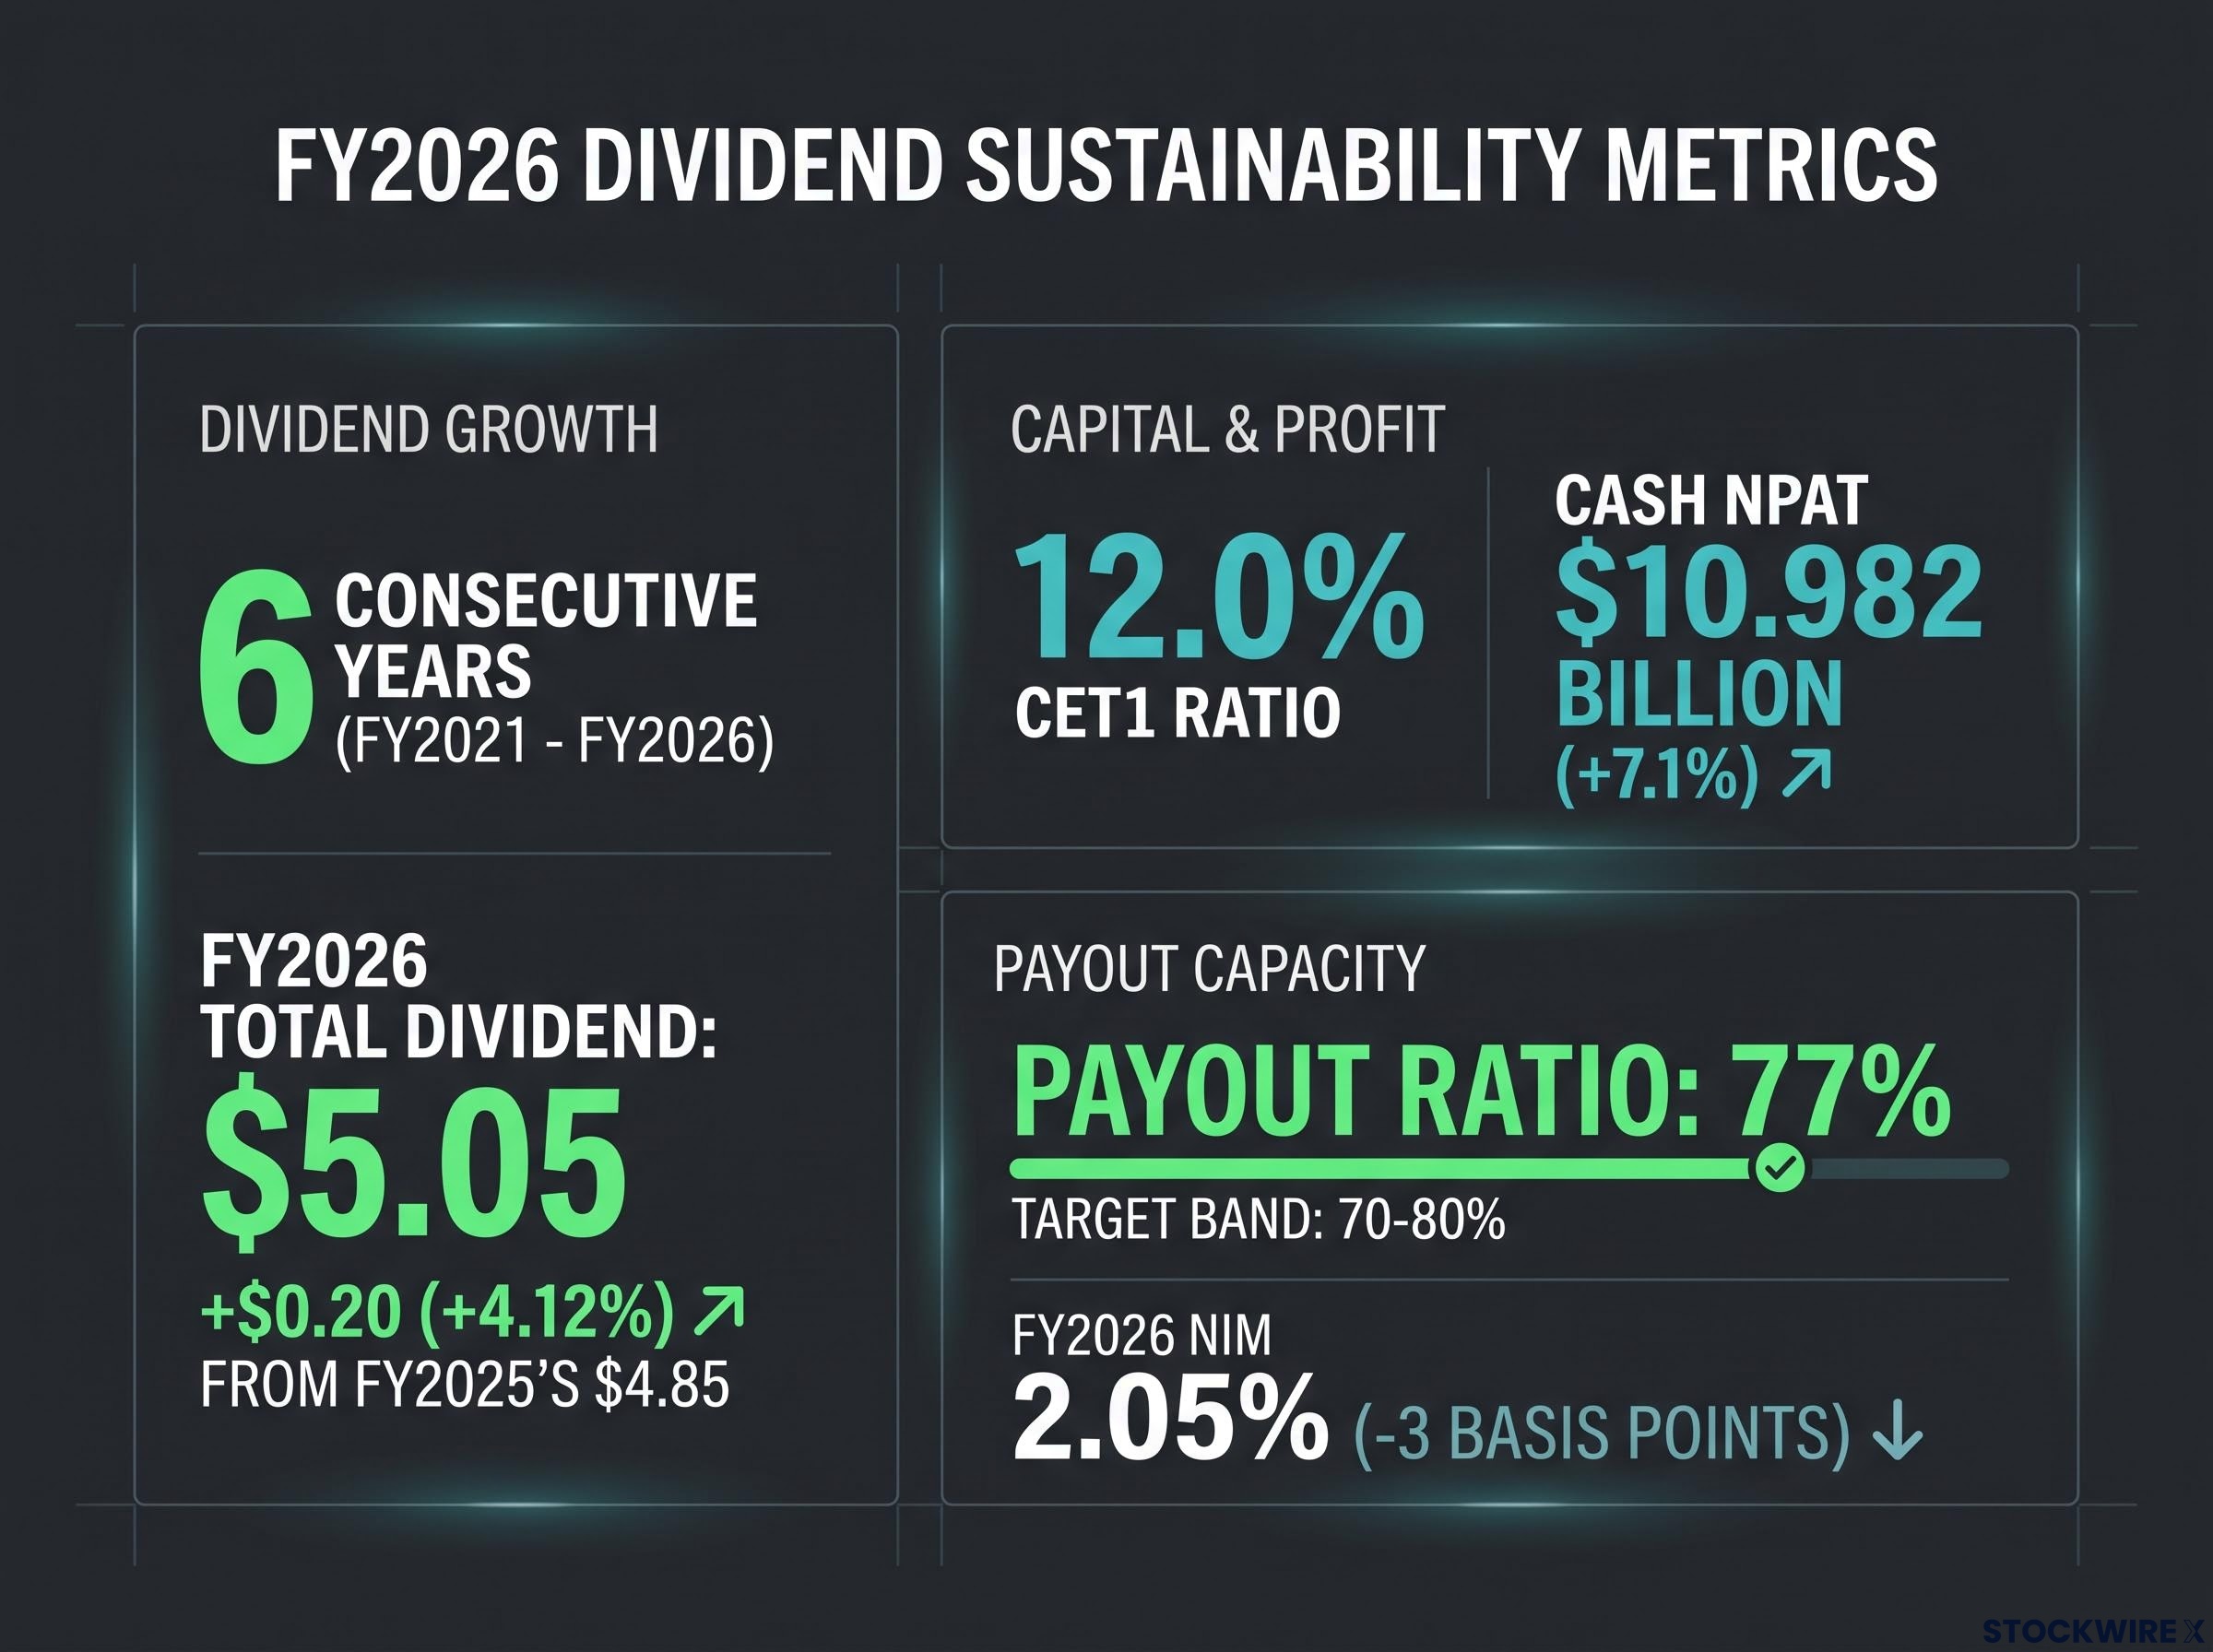
The capacity to sustain the payout looks solid. CBA’s Common Equity Tier 1 (CET1) capital ratio, the core measure of a bank’s financial strength, stood at 12.0%, comfortably above regulatory minima. Cash net profit after tax grew 7.1% to $10.982 billion, and the FY2026 payout ratio of 77% sits within the bank’s stated 70-80% target band.
| Metric | FY2025 | FY2026 |
|---|---|---|
| Total dividend per share | $4.85 | $5.05 |
| Payout ratio (cash NPAT) | Within 70-80% band | 77% |
| Year-on-year change | – | +$0.20 (+4.12%) |
The 77% payout ratio and 12.0% CET1 give CBA genuine headroom to hold the dividend even if FY2027 earnings growth slows. That headroom is what makes the seventh increase plausible rather than wishful.
The conditions that need to hold for a seventh consecutive increase
The risks are specific and observable, not abstract. Three variables will decide whether the streak extends:
- NIM trajectory. Net interest margin, the gap between what CBA earns on loans and pays on deposits, came in at 2.05% for FY2026, down 3 basis points year-on-year. Further compression would directly narrow the earnings base that funds the dividend, so watch the next two reporting periods closely.
- Credit quality. Rising impairment charges or non-performing loans in a tougher macro environment would eat into the profit that supports the payout. Impairment trends in the next cycle are the tell.
- Regulatory capital. Any APRA move to lift required buffers would force higher retention and squeeze the amount available for distribution.
NIM trajectory is the variable most directly tied to the earnings base that funds the dividend, because a sustained compression in the spread between lending rates and deposit costs flows almost immediately into cash profit available for distribution.
The read for an income investor entering at current prices is straightforward. You are effectively betting that year six becomes year seven. The capital buffer and moderate payout make that a reasonable bet. The NIM path and macro backdrop make it not a certainty.
Franking credits, the gross-up effect, and what the real income return looks like for Australian investors
The 3.36% headline yield understates what CBA actually delivers to an Australian resident taxpayer, because the dividend is fully franked. Franking credits are the tax already paid by the company at the corporate rate, passed on to you so the same profit is not taxed twice.
The ATO franking account rules govern how companies accumulate and pass on tax credits to shareholders, confirming that fully franked dividends like CBA’s carry credits equal to the 30% corporate tax already paid on underlying profits.
Here is why that matters. CBA has already paid tax at the 30% corporate rate on the profit behind its dividend. You receive a credit for that tax, and the pre-tax, or grossed-up, value of the dividend is what you compare against other income.
Work through the arithmetic:
- Dividend per share: $5.05, fully franked at the 30% corporate rate.
- Franking credit: $5.05 x (30 / 70) = approximately $2.16 per share.
- Grossed-up dividend: $5.05 + $2.16 = approximately $7.21 per share, which at a price of $150.83 produces a grossed-up yield of roughly 4.79%.
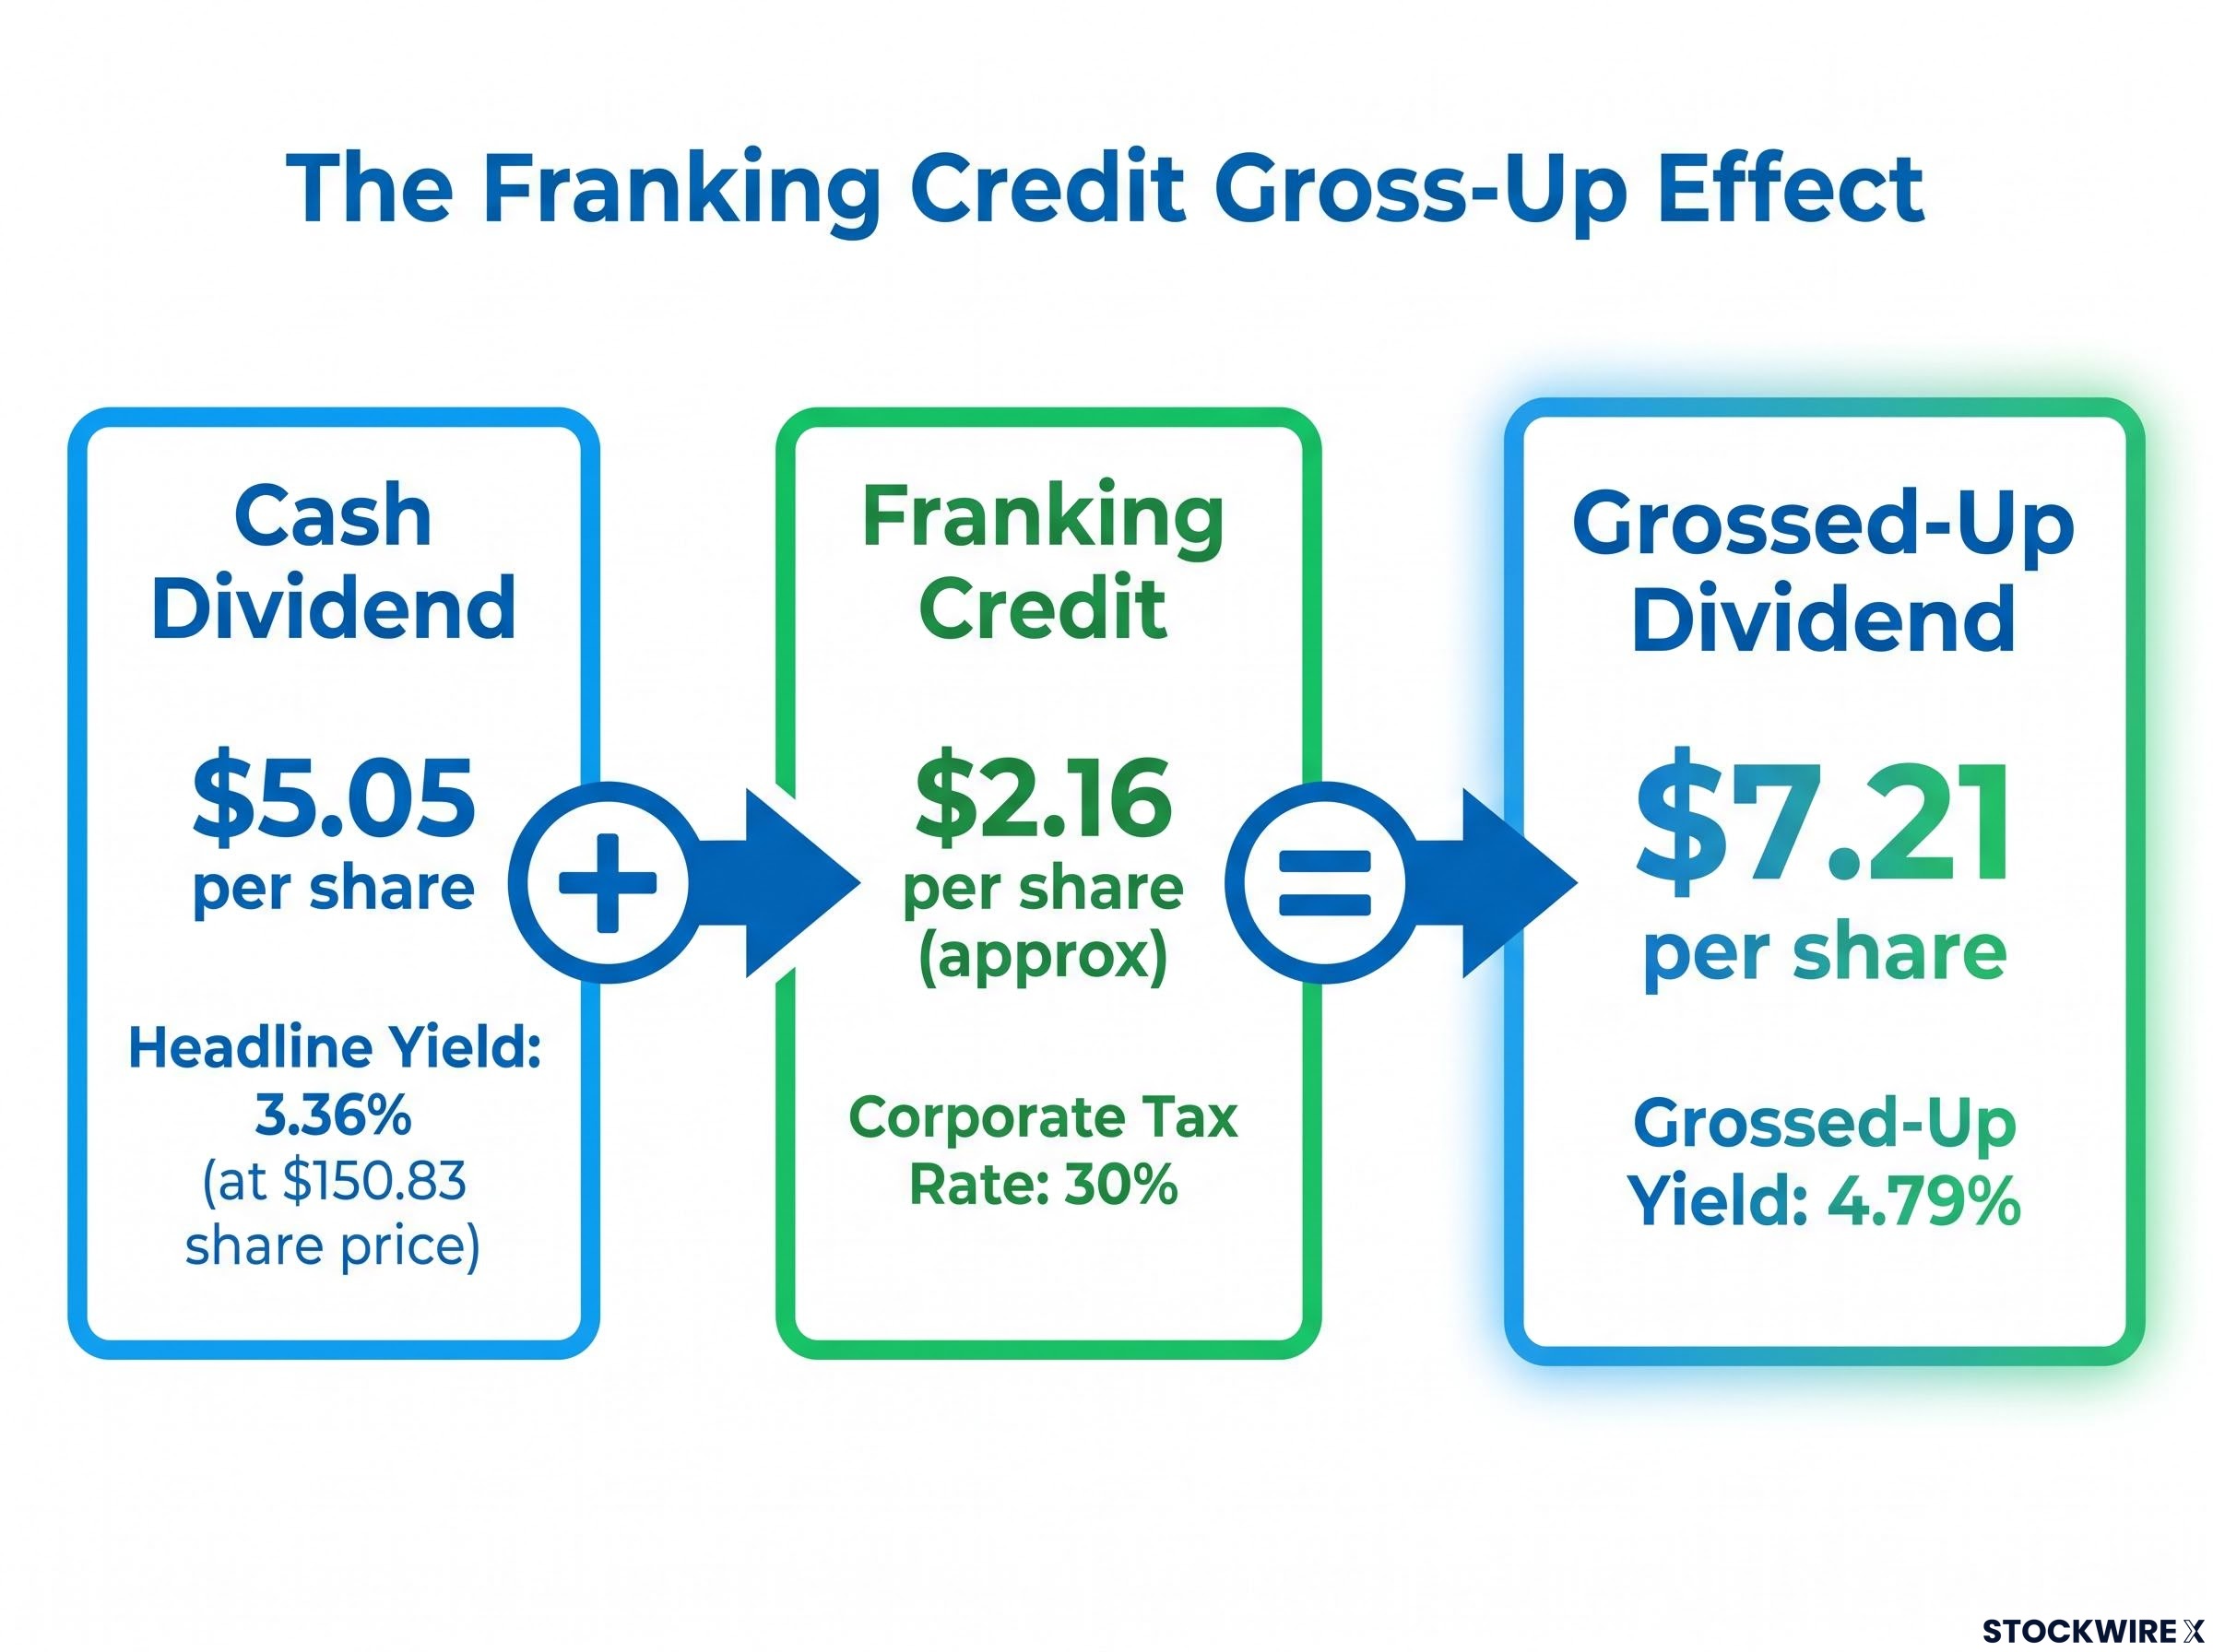
Grossed-up yield: approximately 4.79% This is the pre-tax equivalent income for an investor at the 30% marginal rate, materially above the 3.36% headline figure.
The gross-up benefit is most valuable for investors at or below the 30% marginal rate. For a self-managed super fund or a retiree in the 0-15% tax bracket, the effective income is considerably more attractive than the headline suggests, and can result in a refund of surplus credits. Investors on higher marginal rates still receive the credit, but the net benefit narrows.
This is the structural edge Australian bank shares hold over term deposits and much of fixed income, which cannot pass on franking. It gives you a like-for-like basis for comparison. The caveat is total return: a higher effective income yield counts for less if the capital value falls, and consensus still points to a target of $125.64.
What the current entry point means for income investors weighing CBA now
Pull the threads together and the trade-off becomes clear. The selloff has handed income investors a yield that simply was not available above $180, but the analyst community is signalling the stock may not have finished correcting.
That leaves two different calculations depending on what you actually need from the position.
If you hold for the dividend and are indifferent to near-term price movement, the maths favours patience: a franked, growing income stream from a bank sitting on a 12.0% CET1 ratio. If you need the total return to work inside a 12-month window, the consensus target of $125.64 and its implied 16.7% downside are a genuine headwind.
The key variables to weigh:
- Entry yield: approximately 3.36% trailing at current prices.
- Grossed-up yield: approximately 4.79% for investors at the 30% tax rate, and higher for those below it.
- Analyst consensus downside: roughly 16.7% to the $125.64 target.
- Dividend sustainability: six consecutive increases, with FY2027 dependent on NIM, credit quality, and APRA settings.
- Payout headroom: 77% of cash NPAT, inside the 70-80% policy band.
CBA’s payout policy, capital strength, and growth streak position it as a core income anchor, not a high-yield trade. At $150, you are paying a premium to analyst fair value for a dividend that is highly likely to be maintained but not guaranteed to grow. The case here is about income certainty, not income growth or capital upside.
Big Four dividend yields varied materially across the sector as at mid-2026, with NAB’s grossed-up yield sitting above 6% and CBA’s trailing the group at approximately 4%, a gap that matters to income investors weighing whether CBA’s brand premium is worth paying relative to peers offering higher franked distributions.
This article is for informational purposes only and should not be considered financial advice. Investors should conduct their own research and consult with financial professionals before making investment decisions. Past performance does not guarantee future results, and financial projections are subject to market conditions and various risk factors.
Making an income call on CBA in a partial correction
A 3.36% trailing yield, roughly 4.79% grossed-up, from a bank carrying a 12.0% CET1 ratio and a six-year dividend growth streak is a materially different proposition than the same stock offered above $180. The selloff has done the income investor a genuine, if partial, favour.
The tension does not resolve neatly. Consensus at $125.64 means anyone buying now for income may have to sit through further capital depreciation before any move back toward fair value. The income case and the total return case are pointing in different directions at this price, and pretending otherwise helps no one.
Three forward variables will settle it. Watch CBA’s NIM trajectory into FY2027, impairment charge trends in the next reporting cycle, and any APRA signalling on capital buffers. Those are the observable signals that will tell you whether a seventh consecutive dividend increase is probable or merely possible. The decision on whether that trade-off fits your portfolio is yours to make.