
You can spot a Head and Shoulders pattern in about two seconds. Three peaks, the middle one highest, a line running underneath. It is one of the first shapes any trader learns to recognise.
The problem is what happens next. According to Thomas Bulkowski’s study of more than 2,800 Head and Shoulders tops, only 51% actually reached their projected price target. That gap between how obvious the pattern looks and how often it delivers is exactly where traders get hurt.
This guide covers both the standard bearish Head and Shoulders chart patterns and their bullish mirror, the Inverse Head and Shoulders, because the two can appear on the same chart at once and demand the same toolkit applied in opposite directions. A real Bitcoin chart in 2025 showed both simultaneously.
By the time you finish, you will be able to draw and validate either pattern, calculate a measured move target, choose between two entry approaches with a clear rationale, and know exactly how much confidence the statistical record justifies putting behind the signal.
What these patterns are and why price forms them this way
Before you trade a shape, you need to understand what it records. These are reversal patterns, not continuation patterns, which means they mark the moment a trend runs out of fuel and turns.
Both variants are a snapshot of a power shift between buyers and sellers. Read them that way and you will stop seeing them everywhere.
The standard bearish formation
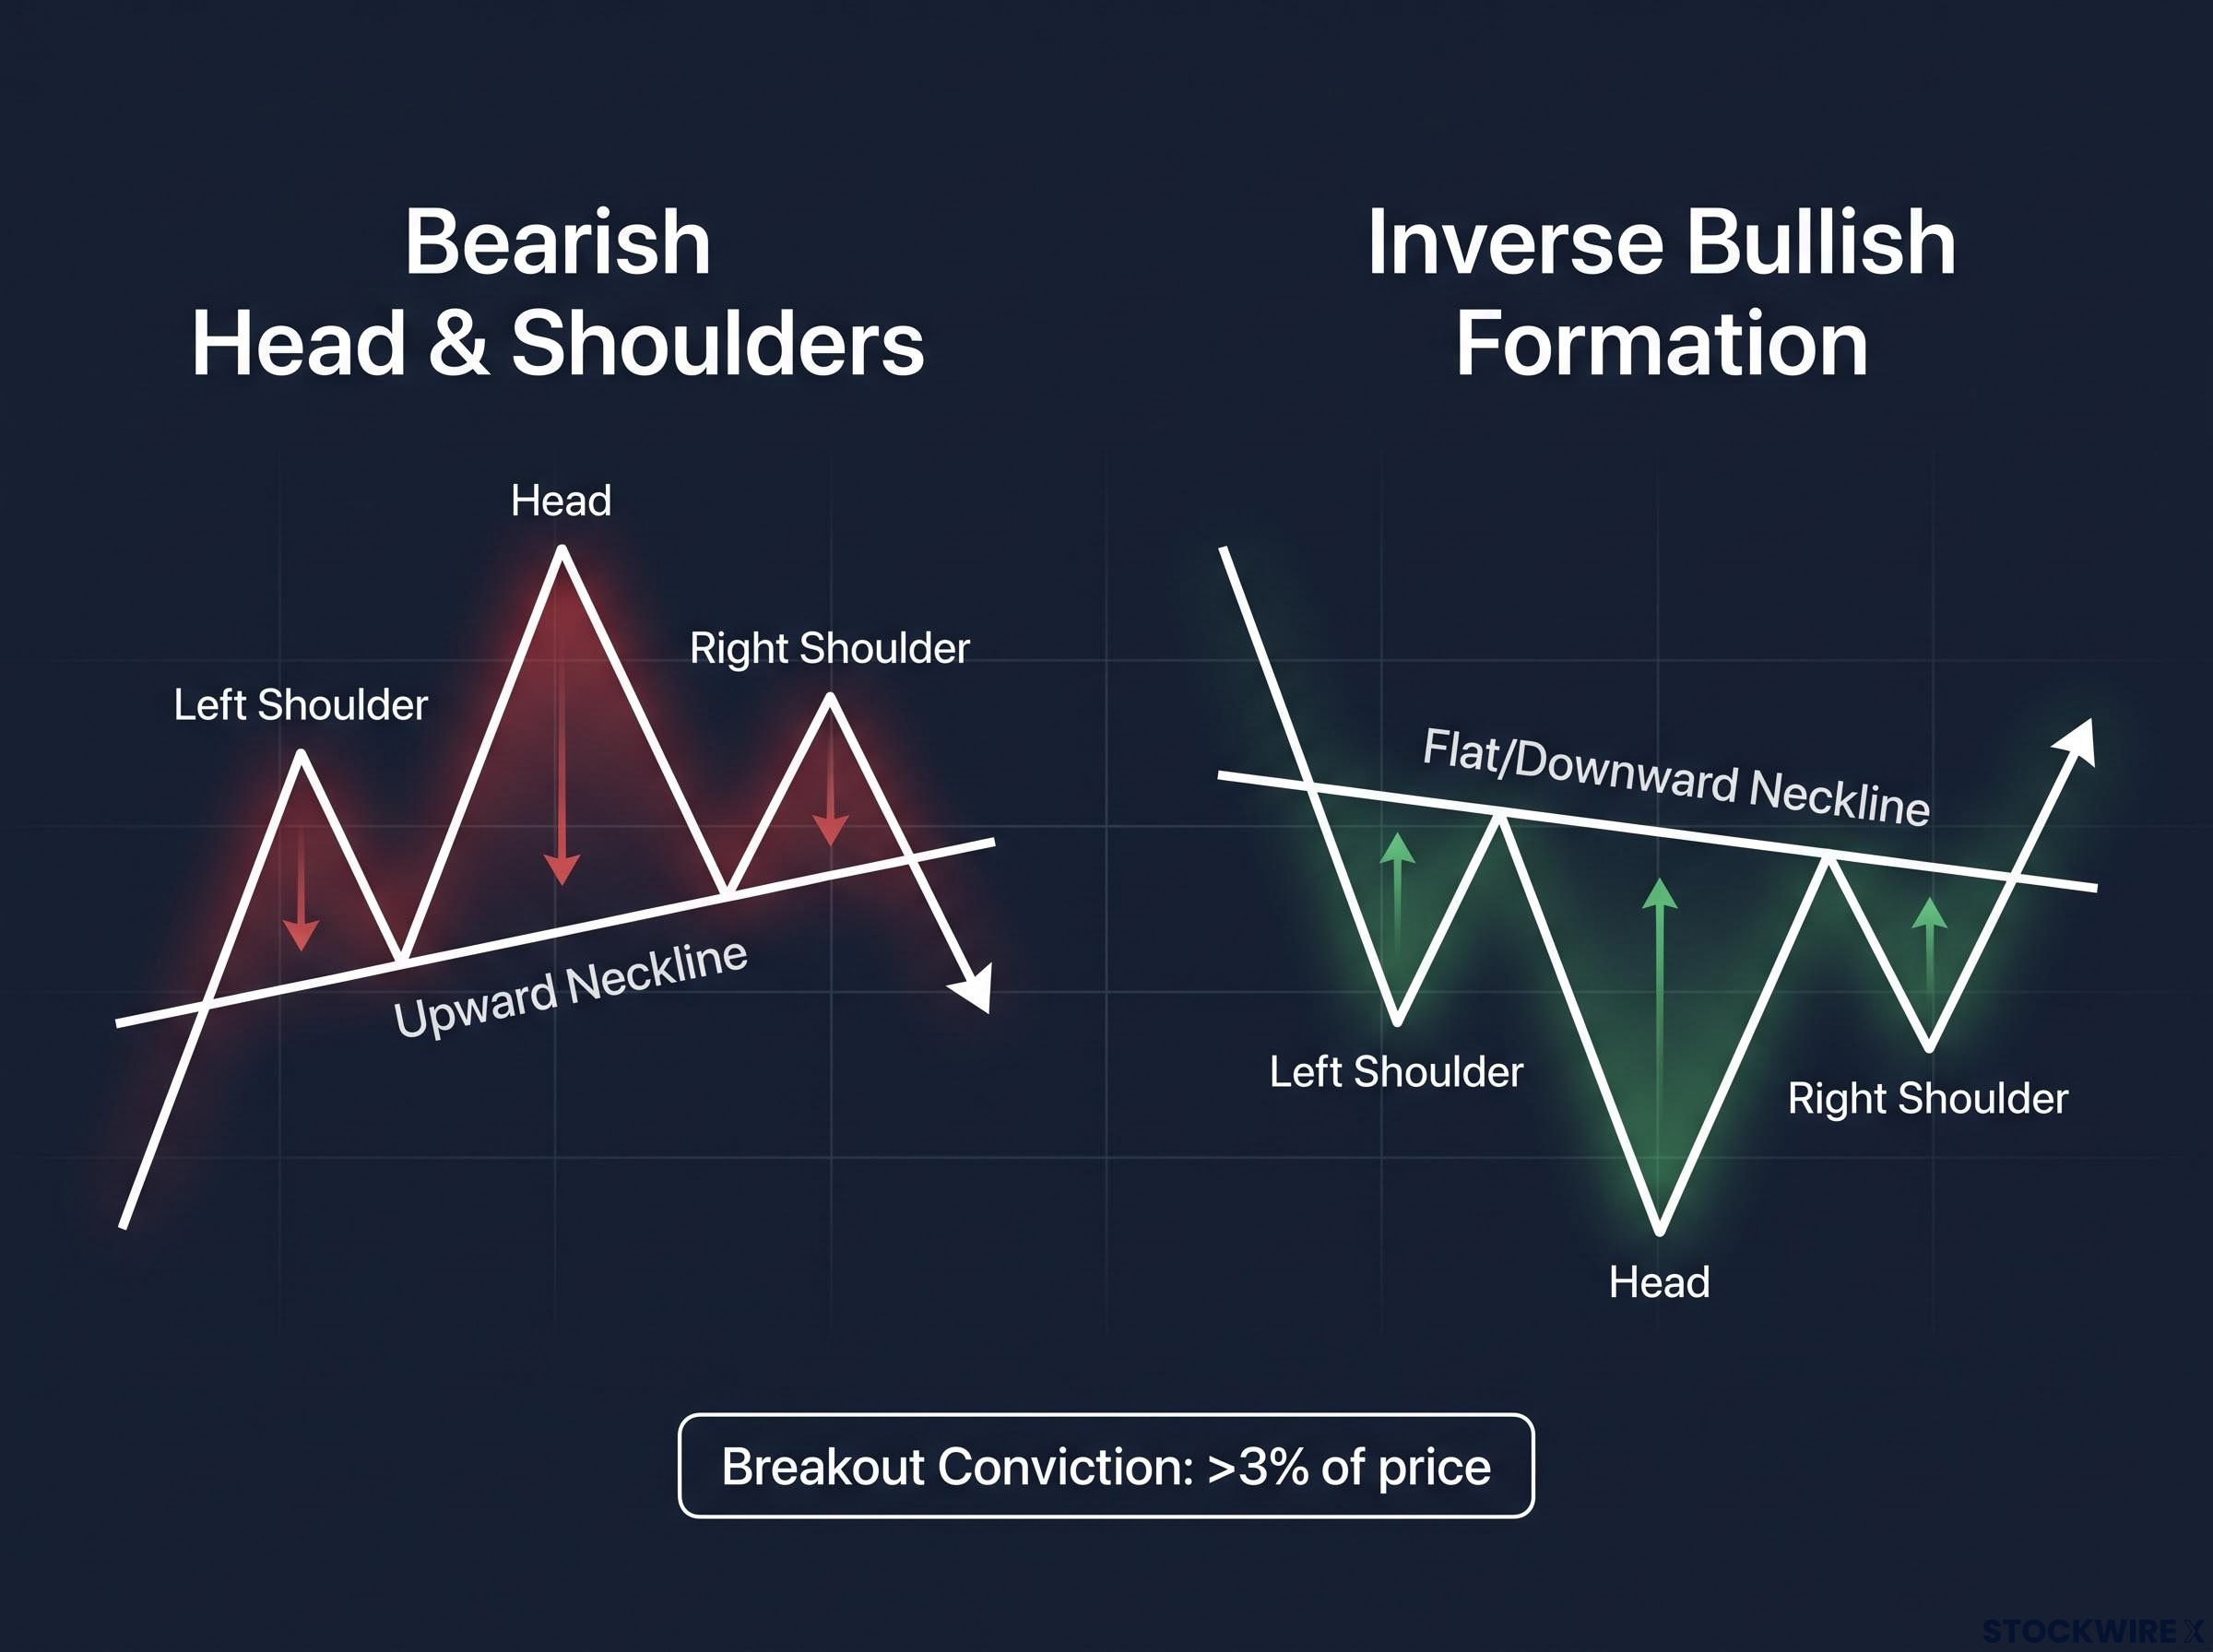
The bearish Head and Shoulders forms at the top of an uptrend and has three peaks:
- Left shoulder: the first peak, formed as the uptrend starts to tire
- Head: the central peak, and the absolute highest point in the entire formation
- Right shoulder: a lower peak, closer in height to the left shoulder
The neckline connects the two troughs (the armpits) beneath the shoulders, and in the standard variant it slopes upward. The logic is a sequence of failing momentum: price makes a higher high at the head, then fails to top it at the right shoulder. When price breaks below the neckline, buyers have lost control and the reversal is confirmed.
A genuine preceding uptrend is required. A Head and Shoulders forming after a sideways drift is not signalling a reversal, because there is no trend to reverse.
The inverse bullish formation
The Inverse Head and Shoulders is the mirror image, forming at the bottom of a downtrend with three troughs instead of three peaks:
- Left shoulder: the first trough
- Head: the deepest trough, the absolute lowest point in the formation
- Right shoulder: a shallower trough, closer to the level of the left shoulder
Here the neckline is flat or slopes slightly downward. Each successive trough being shallower tells you buyers are absorbing more of the selling each time. When price breaks above the neckline, buyers have taken structural control and the bullish reversal is confirmed. As with the bearish version, a real preceding downtrend has to exist for the pattern to mean anything.
The structural logic tells you something important: these patterns only carry weight at genuine trend reversals. If you are marking them in the middle of a range, you are almost certainly looking at noise rather than a signal. That single discipline separates traders who apply these patterns well from those who see them on every chart.
When big ASX news breaks, our subscribers know first
How to tell a valid setup from a pattern that fails the rules
Recognising the shape is not the same as confirming the setup. Run every candidate through the validity filters below in order, and reject anything that fails even one.
Validity checklist for both variants
For the bearish Head and Shoulders, all three tests must pass:
- The neckline runs continuously through both armpits, uninterrupted from left to right.
- Neither shoulder peak exceeds the height of the head.
- The neckline slopes upward.
For the Inverse Head and Shoulders, the tests mirror the above with one difference:
- The neckline runs continuously through both peaks between the troughs.
- Neither shoulder trough drops below the head.
- The neckline is flat or slopes slightly downward, the opposite orientation to the bearish variant.
Here is the honest problem with all of this. Necklines get drawn differently by different traders, and shoulder symmetry is a matter of interpretation, so the same chart can produce legitimately different pattern readings from two competent practitioners.
That subjectivity matters to you personally. The statistical success rates you will read about later were calculated on patterns that different researchers drew using different conventions, which is why no headline figure should be taken at face value.
What makes a breakout convincing
A valid pattern still needs a convincing breakout. A marginal move through the neckline, less than roughly 3% of current price, is prone to snapping straight back.
Experienced practitioners tighten the rule further. The SSFX Head and Shoulders script on TradingView does not treat any neckline crossing as a breakout at all.
The breakout conviction test A move through the neckline should exceed roughly 3% of market price to qualify. For a bearish pattern, the SSFX filter requires a candle that sweeps above the neckline and closes back below it. For the inverse, it requires a sweep below the neckline and a close back above. Rising volume on the break adds further confirmation.
Applying these filters before you act is your main defence against trading formations that look right but carry none of the underlying meaning the pattern is supposed to capture.
Calculating your measured move target and understanding what it tells you
Once a pattern is valid and the neckline breaks, you can project a price target. The method is mechanical and takes two steps.
First, measure the vertical distance from the head’s peak (or trough, for the inverse) down to the neckline. Second, project that same distance from the breakout point in the direction of the expected move.
That gives you a number. Now watch how a real chart treats that number.
On the Bitcoin bearish Head and Shoulders, the measured move projected a decline of roughly 56%. Price actually fell about 27% before a support zone near $60,000 halted the drop and reversed it. The pattern was valid and the neckline broke cleanly, yet price travelled only about half the projected distance.
The Bitcoin Inverse Head and Shoulders behaved more cooperatively. Its measured move projected an advance to approximately $107,000-$107,500, a level that also lined up with a prior high pivot point from 11 November of the previous year. When a target coincides with an existing technical level like that, the confluence adds interpretive weight.
Technical levels that coincide with a measured-move target, such as the prior November pivot high that aligned with the Bitcoin inverse pattern’s projected destination near $107,000-$107,500, carry more structural weight precisely because two independent frameworks arrive at the same zone rather than one.
| Pattern | Projected target | Actual outcome | Level that mattered |
|---|---|---|---|
| Bitcoin bearish H&S | ~56% decline | ~27% decline | Support near $60,000 halted the move |
| Bitcoin Inverse H&S | ~$107,000-$107,500 | Aligned with prior pivot high | Prior November high pivot |
Partial completion is not a pattern failure in the strict sense. Support and resistance zones interrupt moves for reasons that have nothing to do with pattern logic, and that is normal rather than exceptional.
How often does the full target actually get hit? A 2024 study in the Emperor Journal of Economics and Social Science Research found that only 9.52% of Head and Shoulders Bottom patterns reached their full target on the first reversal day. The cumulative figure rose to 46.693% by the third reversal day, still fewer than half.
For context on scale, a separate large Inverse Head and Shoulders on Bitcoin flagged by CryptoTimes on 11 September 2025 had a neckline near $112,000 that broke and converted to support, with a fresh measured move pointing toward roughly $360,000.
The takeaway is direct. Even with a textbook-valid pattern and a clean neckline break, treat the measured move as a possible destination, not a scheduled one. Plan your exits around the support and resistance levels that sit between your entry and the target, not at the target itself.
Choosing your entry point, breakout or retest
There is no universally correct entry. There are two approaches with a genuine trade-off between them.
The breakout entry means entering the moment the neckline is decisively broken. The retest entry means waiting for price to break the neckline, then pull back to test it as new resistance (bearish top) or new support (inverse bottom) before committing.
Resistance zones created by the neckline of a Head and Shoulders top function as supply zones for the same mechanical reason as any other resistance level: trapped buyers who purchased near the breakdown become sellers when price returns to their cost basis, which is precisely why the retest entry works when it works.
Here is how they compare:
- Breakout entry: captures the move from the earliest point, but carries greater false-signal exposure, especially on low-volume breaks.
- Retest entry: offers confirmation that the market respects the new level, but risks missing the trade entirely when no pullback comes and price accelerates away.
Bulkowski’s data gives the retest approach a strong anchor.
The retest happens more often than not In Bulkowski’s study of more than 2,800 Head and Shoulders tops, 68% pulled back to retest the broken neckline after the initial break. For most setups, the patient entry is available.
That 68% figure tells you waiting for the pullback is not overly cautious, it is the statistically supported choice. But the other 32% are real trades that a retest-only rule will miss, so the breakout entry keeps its place when breakout volume is unusually strong or when missing the move entirely is the greater risk.
Stops have three standard options, from tightest to widest:
- Above the neckline: the tightest stop, best paired with retest entries where the neckline has already proven itself.
- Above the right shoulder: a middle-ground stop that allows more room while still invalidating the pattern if hit.
- Above the head: the widest and most conservative stop, giving the trade maximum breathing space at the cost of a larger loss if wrong.
Both entry methods and all three stop options apply equally to the bearish and inverse variants. The only thing that changes is direction: for an inverse bottom, the stops sit below the neckline, right shoulder, and head respectively. Choosing your method before the setup appears, rather than deciding in the moment, is what keeps the application disciplined.
What the statistical record actually says about these patterns
Now for the numbers, delivered straight. Bulkowski’s dataset of Head and Shoulders tops found that 51% reached the full measured-move target, the average decline from head to subsequent low was 16%, and the break-even failure rate was 19%.
The Emperor Journal figures are harder still. Fewer than 10% of Head and Shoulders Bottom patterns hit their full target on the first reversal day, and fewer than half did so even by the third.
The Bitcoin inverted head and shoulders that completed in August 2026 is a particularly useful reference point here: Bulkowski-derived datasets put the inverse variant’s target achievement rate at 71%-83%, noticeably higher than the 51% figure for standard bearish tops, which itself reflects how the two formations differ in the supply and demand dynamics driving them.
| Source | Metric | Finding |
|---|---|---|
| Bulkowski (2,800+ tops) | Full target reached | 51% |
| Bulkowski | Average decline / break-even failure | 16% decline / 19% failure |
| Emperor Journal (2024) | Target hit, first reversal day | 9.52% |
| Emperor Journal (2024) | Target hit by third reversal day | 46.693% |
| Practitioner synthesis (2026) | Headline success rate | 60%-80% |
So why do practitioner guides quote 60%-80% success? Those higher figures typically use a looser definition of success, counting any favourable move rather than full measured-move completion, and they draw on different samples across asset classes and timeframes. The empirical studies with stricter completion criteria consistently land lower.
The one statistic to size your risk around Bulkowski’s 19% break-even failure rate means roughly one in five of these patterns will not deliver even a break-even outcome. That is a direct argument for defining your stop before you enter, rather than assuming the pattern has managed the risk for you.
Volatile markets and shorter timeframes tend to produce more false patterns and lower practical reliability than any headline figure suggests. None of this makes the patterns useless. It positions them accurately: one useful input among several, not a high-confidence standalone signal. Traders who treat them as the latter are working from a misreading of the evidence.
Applying these patterns with the discipline the statistics demand
You now have the full validation chain. The value of these patterns comes not from memorising it, but from calibrating when the surrounding conditions justify acting.
Run every setup through this sequence:
- Trend confirmed: a genuine uptrend before a bearish pattern, or downtrend before an inverse.
- Pattern valid: all three structural criteria satisfied.
- Neckline defined: drawn cleanly through both armpits or peaks.
- Breakout qualified: move exceeds roughly 3% of price, ideally with rising volume and a close beyond the neckline.
- Target set as a range: measured move treated as a guideline, with exits planned around interim support and resistance.
- Entry and stop committed: breakout or retest chosen in advance, stop placed before entry.
Context dependency is not a flaw. It is how technical analysis works. The same pattern on a strong-trending daily chart with high volume carries meaningfully more weight than on a five-minute chart in a choppy, thin session.
Keep three things front of mind:
- Timeframe gradient: these patterns work on daily, weekly, hourly and shorter charts, but reliability declines as the timeframe shortens.
- Asset class variability: volatile or thinly traded instruments demand extra caution.
- Volume as the primary quality filter: a high-volume breakout is the single clearest sign a signal deserves your attention.
The Bitcoin examples show both sides: clear structural setups with measurable targets and alignment to prior pivots, and no guarantee price travels the full distance. The traders who get consistent value are not those who spot these patterns most often, but those most selective about when to act on them.
For readers wanting to translate a confirmed Head and Shoulders neckline break into a structured trade from the short side, our dedicated guide to building short positions covers the exact entry signals, stop mechanics, and borrow costs that determine whether a technically valid pattern produces a profitable short.
This article is for informational purposes only and should not be considered financial advice. Investors should conduct their own research and consult with financial professionals before making investment decisions. Past performance does not guarantee future results.