
Brad Jacobs made his name and his fortune on a single trick, repeated across three companies: issue stock when the market values it richly, then use that expensive currency to buy businesses at cheaper multiples, pocketing the spread as value for shareholders. It worked at United Rentals, at XPO, and it was the founding logic behind QXO. But the common shareholder buying QXO today at around $12-13 per share is walking into a version of that machine where the central mechanism has been quietly disabled, while Jacobs himself sits in preferred stock earning a guaranteed high-single-digit yield with warrants convertible at $4.566 per share.
The platform itself is not in question. Across fifteen months, QXO assembled an $18 billion-plus revenue building-products distribution business through three acquisitions, Beacon, Kodiak, and TopBuild, all closed between April 2025 and July 2026. The scale is genuine and the operating momentum is real.
The question this analysis answers is narrower and more useful: not whether the platform exists, but whether the terms on which common shareholders participate in it are actually favourable. Here is a framework for reading QXO’s capital structure from the bottom up, so you can see exactly where your claim sits relative to everything ranked ahead of it.
How QXO built a $30 billion acquisition stack in 15 months
The pace tells the first part of the story. In just over a year, QXO deployed capital across three deals that transformed it from a shell into a distribution leader, and each one introduced a new, more senior claim into the capital structure.
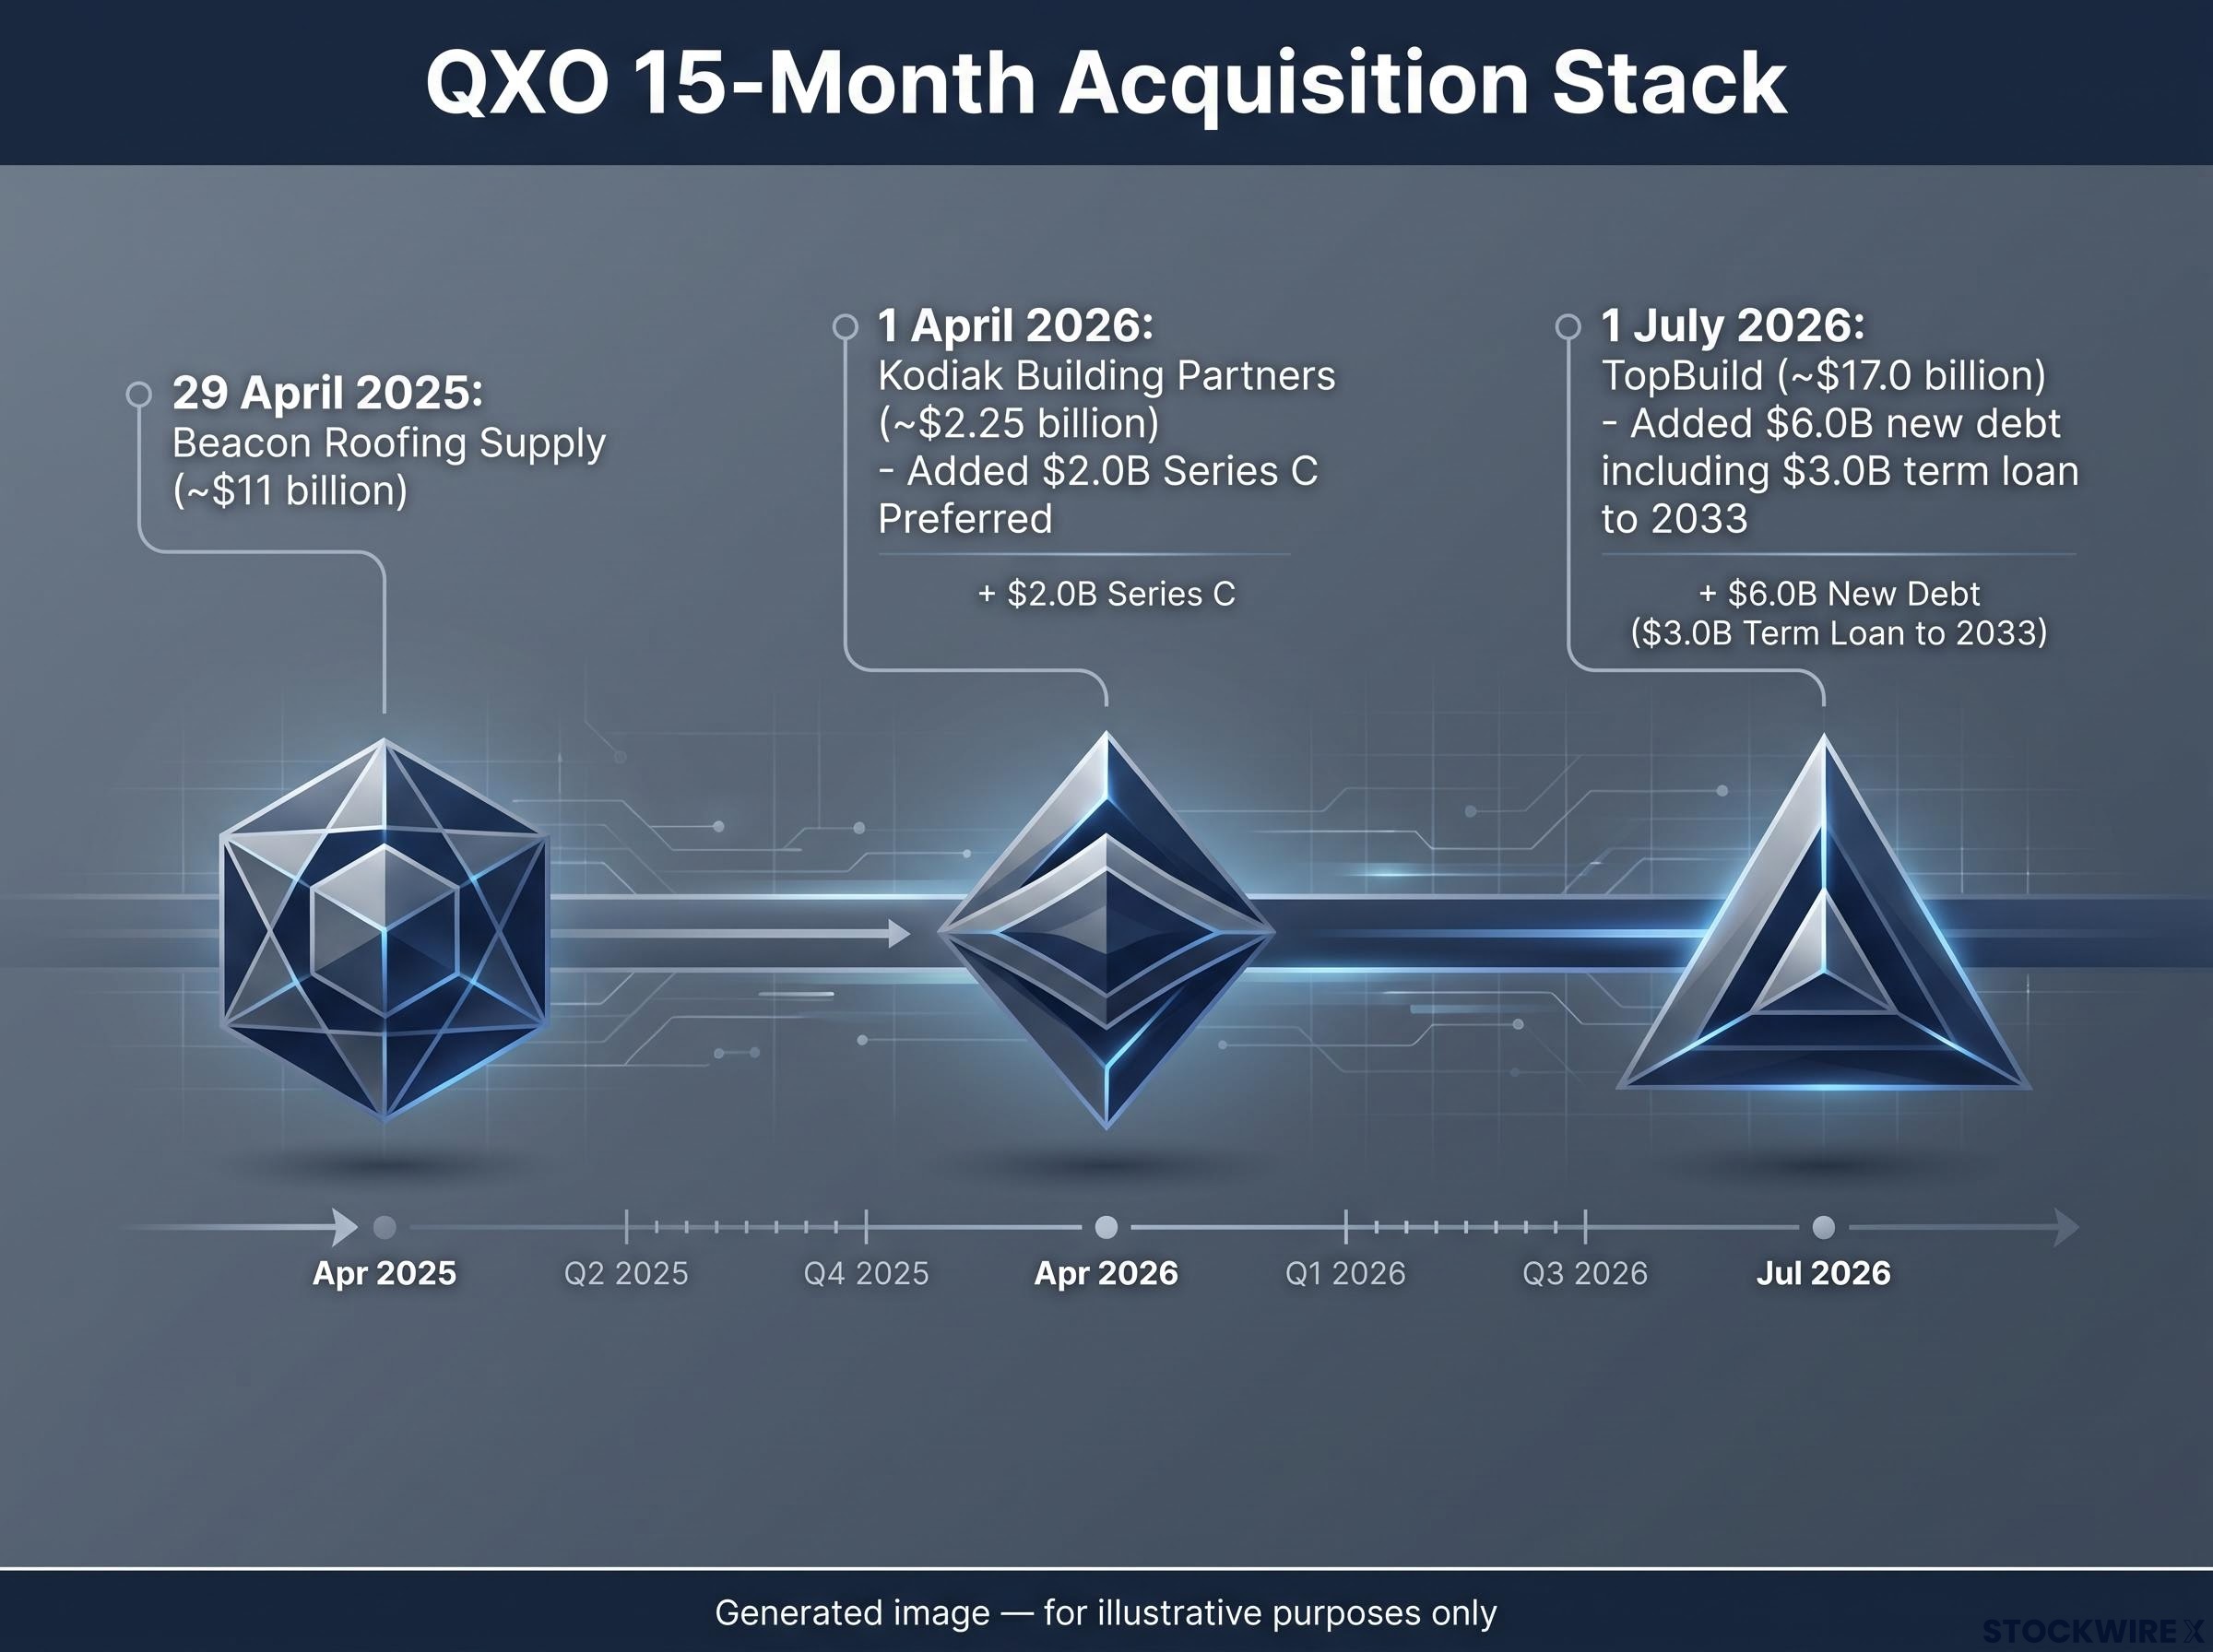
Beacon Roofing Supply came first. QXO agreed to acquire it at $124.35 per share in a transaction valued at roughly $11 billion, closing on 29 April 2025 and rebranding as QXO Building Products.
Kodiak Building Partners followed. QXO announced the $2.25 billion acquisition in February 2026 and closed it on 1 April 2026, paying $2.0 billion in cash plus 13.2 million shares. To fund the cash portion, QXO simultaneously issued 200,000 shares of Series C Preferred Stock for $2.0 billion in cash, a new senior instrument stacked above common equity.
Then came TopBuild, the largest of the three. QXO agreed to acquire it for approximately $17.0 billion, roughly $6.4 billion in cash plus about 312.5 million shares, closing on 1 July 2026. That deal required around $6.0 billion of new debt, including a $3.0 billion incremental term loan maturing in 2033.
The SEC filing confirming the TopBuild close details the consideration received by former TopBuild shareholders, including cash, QXO common stock, or a combination, and establishes the official record of a transaction that added roughly $6.0 billion of incremental debt to the capital structure in a single day.
At the TopBuild announcement, Jacobs noted the company had built its market position through more than $13 billion of acquisitions. On a full-year 2025 pro forma basis, the combined platform generates roughly $18.1 billion in revenue and more than $2 billion in adjusted EBITDA, an approximate 12% margin. The operating engine is producing: Q2 2026 adjusted EBITDA reached $272 million, up 33% year-on-year.
| Acquisition | Close Date / Total Value | Cash Component | Shares Issued | New Instrument Introduced |
|---|---|---|---|---|
| Beacon Roofing Supply | 29 April 2025 / ~$11B | Not specified | Not specified | Not specified |
| Kodiak Building Partners | 1 April 2026 / ~$2.25B | $2.0B | 13.2M shares | Series C Preferred ($2.0B) |
| TopBuild Corp. | 1 July 2026 / ~$17.0B | ~$6.4B | ~312.5M shares | $3.0B term loan to 2033 |
Each deal layered a distinct financing instrument onto the stack:
- Kodiak: $2.0 billion Series C Preferred stock
- TopBuild: $6.0 billion of incremental debt including a $3.0 billion term loan to 2033
Read the pattern rather than the individual deals. Every successive acquisition added a new instrument ranking ahead of common equity, which means your residual claim has not merely been diluted in share count. It has been progressively subordinated, pushed further down the queue of who gets paid first.
When big ASX news breaks, our subscribers know first
Reading the capital stack from the bottom: where common equity actually sits
To understand what you own, build the stack from the top down and see what has to be satisfied before any value reaches the bottom.
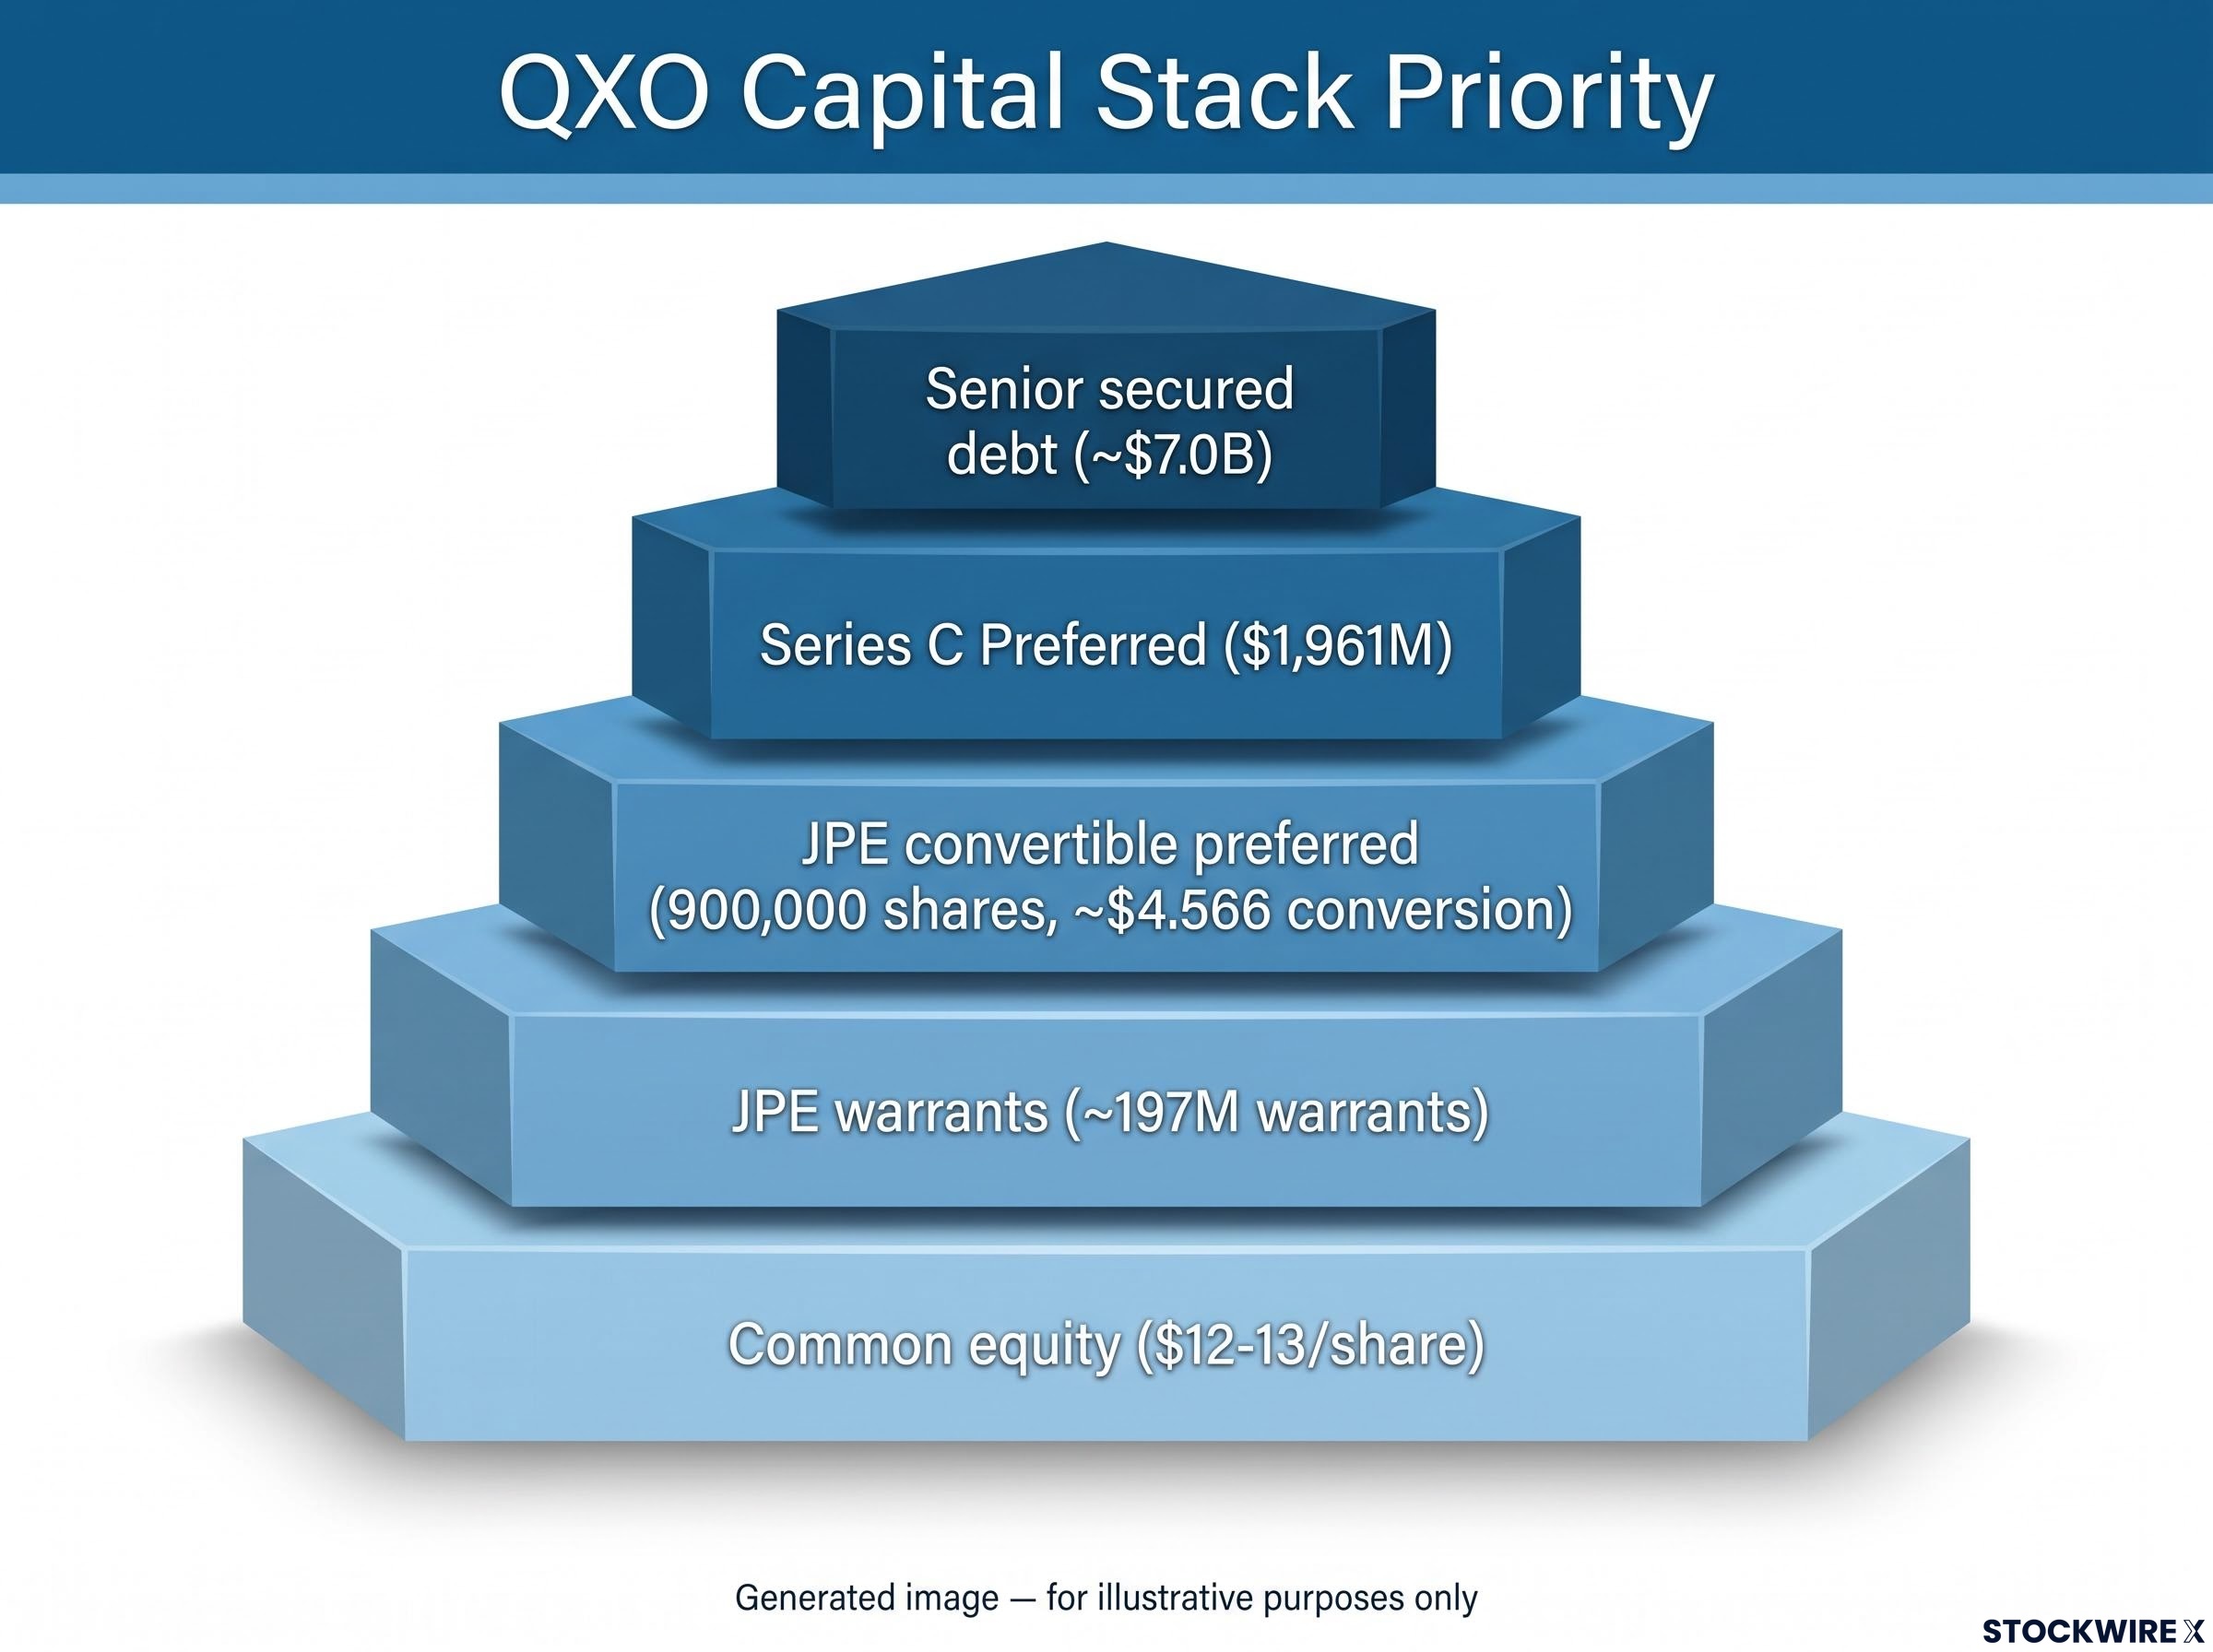
At the top sits roughly $7.0 billion in senior secured debt, including the new borrowings for TopBuild. This debt gets serviced first, in good times and bad, regardless of how the business performs. Q2 2026 long-term debt net stood at $6,029 million, with total debt approaching $7.0 billion once revolving lines are included.
Below the debt sits the $2.0 billion Series C Preferred, carried on the Q2 2026 balance sheet at $1,961 million. Preferred stock ranks ahead of common: its dividends and liquidation rights must be honoured before ordinary shareholders see a cent of residual value.
Next comes Jacobs’ own layer, the convertible perpetual preferred held through Jacobs Private Equity. Per the SC 13D/A filed 20 April 2026, JPE holds 900,000 preferred shares convertible into approximately 197 million common shares at $4.566 each, and this preferred carries a fixed high-single-digit annual yield that also ranks above common.
Then the warrants. JPE holds roughly 197 million warrants across three strike tiers, another potential flood of new shares waiting above your claim.
JPE warrant strike tiers (SC 13D/A, 20 April 2026) 50% exercisable at $4.566 25% exercisable at $6.849 25% exercisable at $13.698
Only after all of this comes common equity, the residual claimant sitting at the very bottom.
There is a timing wrinkle worth flagging. The Q2 2026 balance sheet covers the period ending 30 June 2026, but TopBuild closed on 1 July 2026, one day later. That means the published Q2 figures do not yet capture the full post-TopBuild leverage, so the true debt load today is higher than the last reported numbers suggest, with estimated net debt-to-EBITDA exceeding four times projected pro forma EBITDA.
| Layer | Instrument | Notional | Key Terms | Shares Underlying |
|---|---|---|---|---|
| 1 (most senior) | Senior secured debt | ~$7.0B | Term loan to 2033 | N/A |
| 2 | Series C Preferred | $1,961M | Priority dividends | N/A |
| 3 | JPE convertible preferred | 900,000 shares | ~$4.566 conversion, high-single-digit yield | ~197M |
| 4 | JPE warrants | ~197M warrants | $4.566 / $6.849 / $13.698 strikes | ~197M |
| 5 (residual) | Common equity | Market ~$12-13/share | Last in line | N/A |
With the share price at $12-13, the $4.566 and $6.849 warrant tiers are firmly in-the-money, and even the $13.698 tier sits near-the-money. What this tells you is that the dilution here is not some distant hypothetical waiting on a share price rally. It is a present feature of the stock you are evaluating today.
Why your data terminal may be understating dilution
Here is a practical trap. The diluted share count you see on a platform such as Yahoo Finance includes warrants that are in-the-money at the reporting date, but it does not always capture every convertible instrument, and basic share counts exclude warrant conversion entirely.
With QXO around $12-13, the $4.566 and $6.849 tiers, which together represent 75% of the roughly 197 million warrants, or about 148 million shares, are in the money. The $13.698 tier may or may not be reflected depending on the reporting date.
If you rely on a headline diluted EPS figure without reading the notes to the financial statements or checking the SC 13D/A directly, you can materially underestimate how much dilution actually sits above your claim. The screening tool makes the risk look smaller than it is.
The equity arbitrage that no longer works at current prices
The mechanism Jacobs built his career on is real, and it worked. The logic is straightforward: issue equity when your stock trades at a premium valuation, then use that richly priced currency to acquire businesses at lower multiples. The gap between the two is captured as value for existing shareholders. Jacobs has described this capital arbitrage as his primary value-creation lever, and it drove the entire QXO roll-up.
But the mechanism only functions under specific conditions. Consider the three it requires:
- A high stock price relative to the intrinsic value of acquisition targets
- The ability to issue new equity without punitive dilution to existing holders
- Targets available at multiples below the company’s own valuation
At QXO’s current setup, those conditions have broken down. With the stock at $12-13 and Jacobs’ preferred converting at $4.566, the company is not trading at the kind of premium that makes premium-valuation equity issuance work. Layered on top of an already heavy preferred and warrant overhang, issuing more common stock now would either be priced at levels that punish existing holders or meet resistance from investors wary of further dilution. The first two conditions are effectively unavailable.
So the value-creation path has shifted. The substitute mechanism is operational: realising synergies across the combined Beacon, Kodiak, and TopBuild platform, expanding margins, and deleveraging through free-cash-flow generation. QXO’s own investor materials reflect this pivot, emphasising combined revenue, EBITDA, and margin performance rather than deal arbitrage.
The operating momentum to support that path exists. Q2 2026 adjusted EBITDA of $272 million grew 33% year-on-year, and the pro forma combined platform targets more than $2 billion in adjusted EBITDA. But this route matures slowly, with free-cash-flow projections pointing to roughly 2030 before meaningful cash generation at scale arrives.
The macro headwind Mortgage rates in the 6-7%+ range pressure new residential construction, which accounts for approximately half of QXO’s revenue mix. Elevated rates slow housing starts, and distributors tied to new builds feel that volume decline more sharply than repair-focused peers.
Here is what changes for you. You are not buying the version of QXO that Jacobs originally engineered for equity investors at high stock prices. You are buying a heavily leveraged operating platform that has to earn its way out of its own capital structure through cash generation over several years. That distinction should reshape how you model both the holding period and the risk.
What the United Rentals precedent teaches about high-leverage building platforms
There is a real precedent for a Jacobs-led, high-leverage, construction-adjacent business hitting a downturn, and it is worth using as a diagnostic rather than a warning.
During the 2008-2009 financial crisis, United Rentals, which Jacobs previously led, saw its stock fall more than 90% from its peak. The cause was the combination QXO now carries: high leverage meeting demand deterioration in a cyclical business tied to construction. Yet the stock recovered substantially over the following years, delivering large cumulative gains for holders who did not sell at the bottom.
Survival was not luck. URI made specific choices: it cut capital expenditure aggressively, reduced costs, preserved liquidity, and prioritised paying down debt over pursuing new acquisitions through the downturn. Recovery then followed from stabilising construction demand, successful deleveraging, and the scale advantages URI retained in a consolidating industry.
The value of this case is that it isolates the variables that decide the outcome. For serial-acquirer roll-ups, survival versus distress tends to split along clear lines:
- Favours survival: manageable near-term maturities, ample liquidity, positive cash flow under stress, and a willingness to pause acquisitions and focus on integration
- Favours distress: short-dated debt with tight covenants, aggressive acquisition pacing that outruns integration, and capital structures skewed toward senior instruments that consume value ahead of common equity
The URI episode is not a forecast for QXO. It is a map of the variables that will determine what happens to common shareholders, and you should use it to stress-test your own assumptions about where QXO sits on each one.
Applying the URI template to QXO’s current position
Run the survival checklist against QXO today. On near-term maturities, the picture is mixed but not alarming: the $3.0 billion term loan does not mature until 2033, which gives real runway before any refinancing wall. That is a point in QXO’s favour.
On fixed obligations, the picture is heavier. The roughly $7.0 billion of total debt plus the layered preferred instruments mean substantial fixed financial commitments remain in place regardless of market conditions, and preferred dividends and debt service do not pause when demand softens. With estimated net debt-to-EBITDA exceeding four times, there is limited cushion.
On cyclicality, there are genuine partial offsets. Repair-and-remodel demand and commercial exposure across the combined platform provide some cushion against the new residential construction weakness that mortgage rates in the 6-7%+ range are likely to cause. Those offsets are real, but at current leverage levels they soften the blow rather than remove it.
The Freddie Mac Primary Mortgage Market Survey shows prevailing 30-year fixed rates remaining in the elevated range that constrains new residential construction starts, a direct pressure on the roughly half of QXO’s revenue mix tied to new builds.
What the capital structure tells you before you invest
Pull the four threads together and the picture for common shareholders comes into focus. Three structural features work against you: the layered debt-and-preferred stack that must be satisfied first, the multi-tier warrant overhang creating near-term dilution, and the impaired equity-arbitrage mechanism that removed Jacobs’ original value engine.
The two sides of the case are clear. The bull argument rests on execution: realising synergies, pushing margins beyond the ~12% EBITDA level, and deleveraging through free cash flow by around 2030. The bear argument is that $7.0 billion of debt plus preferred obligations at greater than four times leverage leaves common equity dangerously thin if construction markets soften materially.
The more durable takeaway is a framework you can apply to any serial-acquirer platform. Ask three questions:
- Where does common equity sit in the capital stack relative to senior instruments?
- Is the primary value-creation mechanism, whether equity arbitrage, synergies, or organic growth, currently available to the company?
- Does the leverage level match the cyclicality of the underlying end markets?
If the deleveraging thesis is your investment thesis, then QXO’s own emphasis on scale, combined EBITDA, and margin improvement points to the right metrics to track. Monitor these:
- Adjusted EBITDA trajectory, from the Q2 2026 baseline of $272 million toward the $2 billion-plus pro forma target
- Net debt-to-EBITDA ratio movement
- Free-cash-flow progress toward the roughly 2030 target
- Mortgage-rate trajectory as a proxy for new-construction demand
| Scenario | Key Assumption | Capital Structure Impact | Common Equity Outcome |
|---|---|---|---|
| Bull | Synergies realised, margins expand, demand holds | Free cash flow deleverages toward 2030 | Residual value grows as senior claims shrink |
| Bear | Construction softens, EBITDA compresses | Fixed debt and preferred obligations persist | Thin residual claim, high dilution risk |
The question you need to answer is not whether QXO succeeds as a business. It is whether, at $12-13 per share, you are being compensated for the specific structural risks you bear relative to every senior holder in the stack.
This article is for informational purposes only and should not be considered financial advice. Investors should conduct their own research and consult with financial professionals before making investment decisions.
Past performance does not guarantee future results. Financial projections are subject to market conditions and various risk factors, and forward-looking figures such as the 2030 free-cash-flow target are speculative and subject to change based on market developments and company performance.