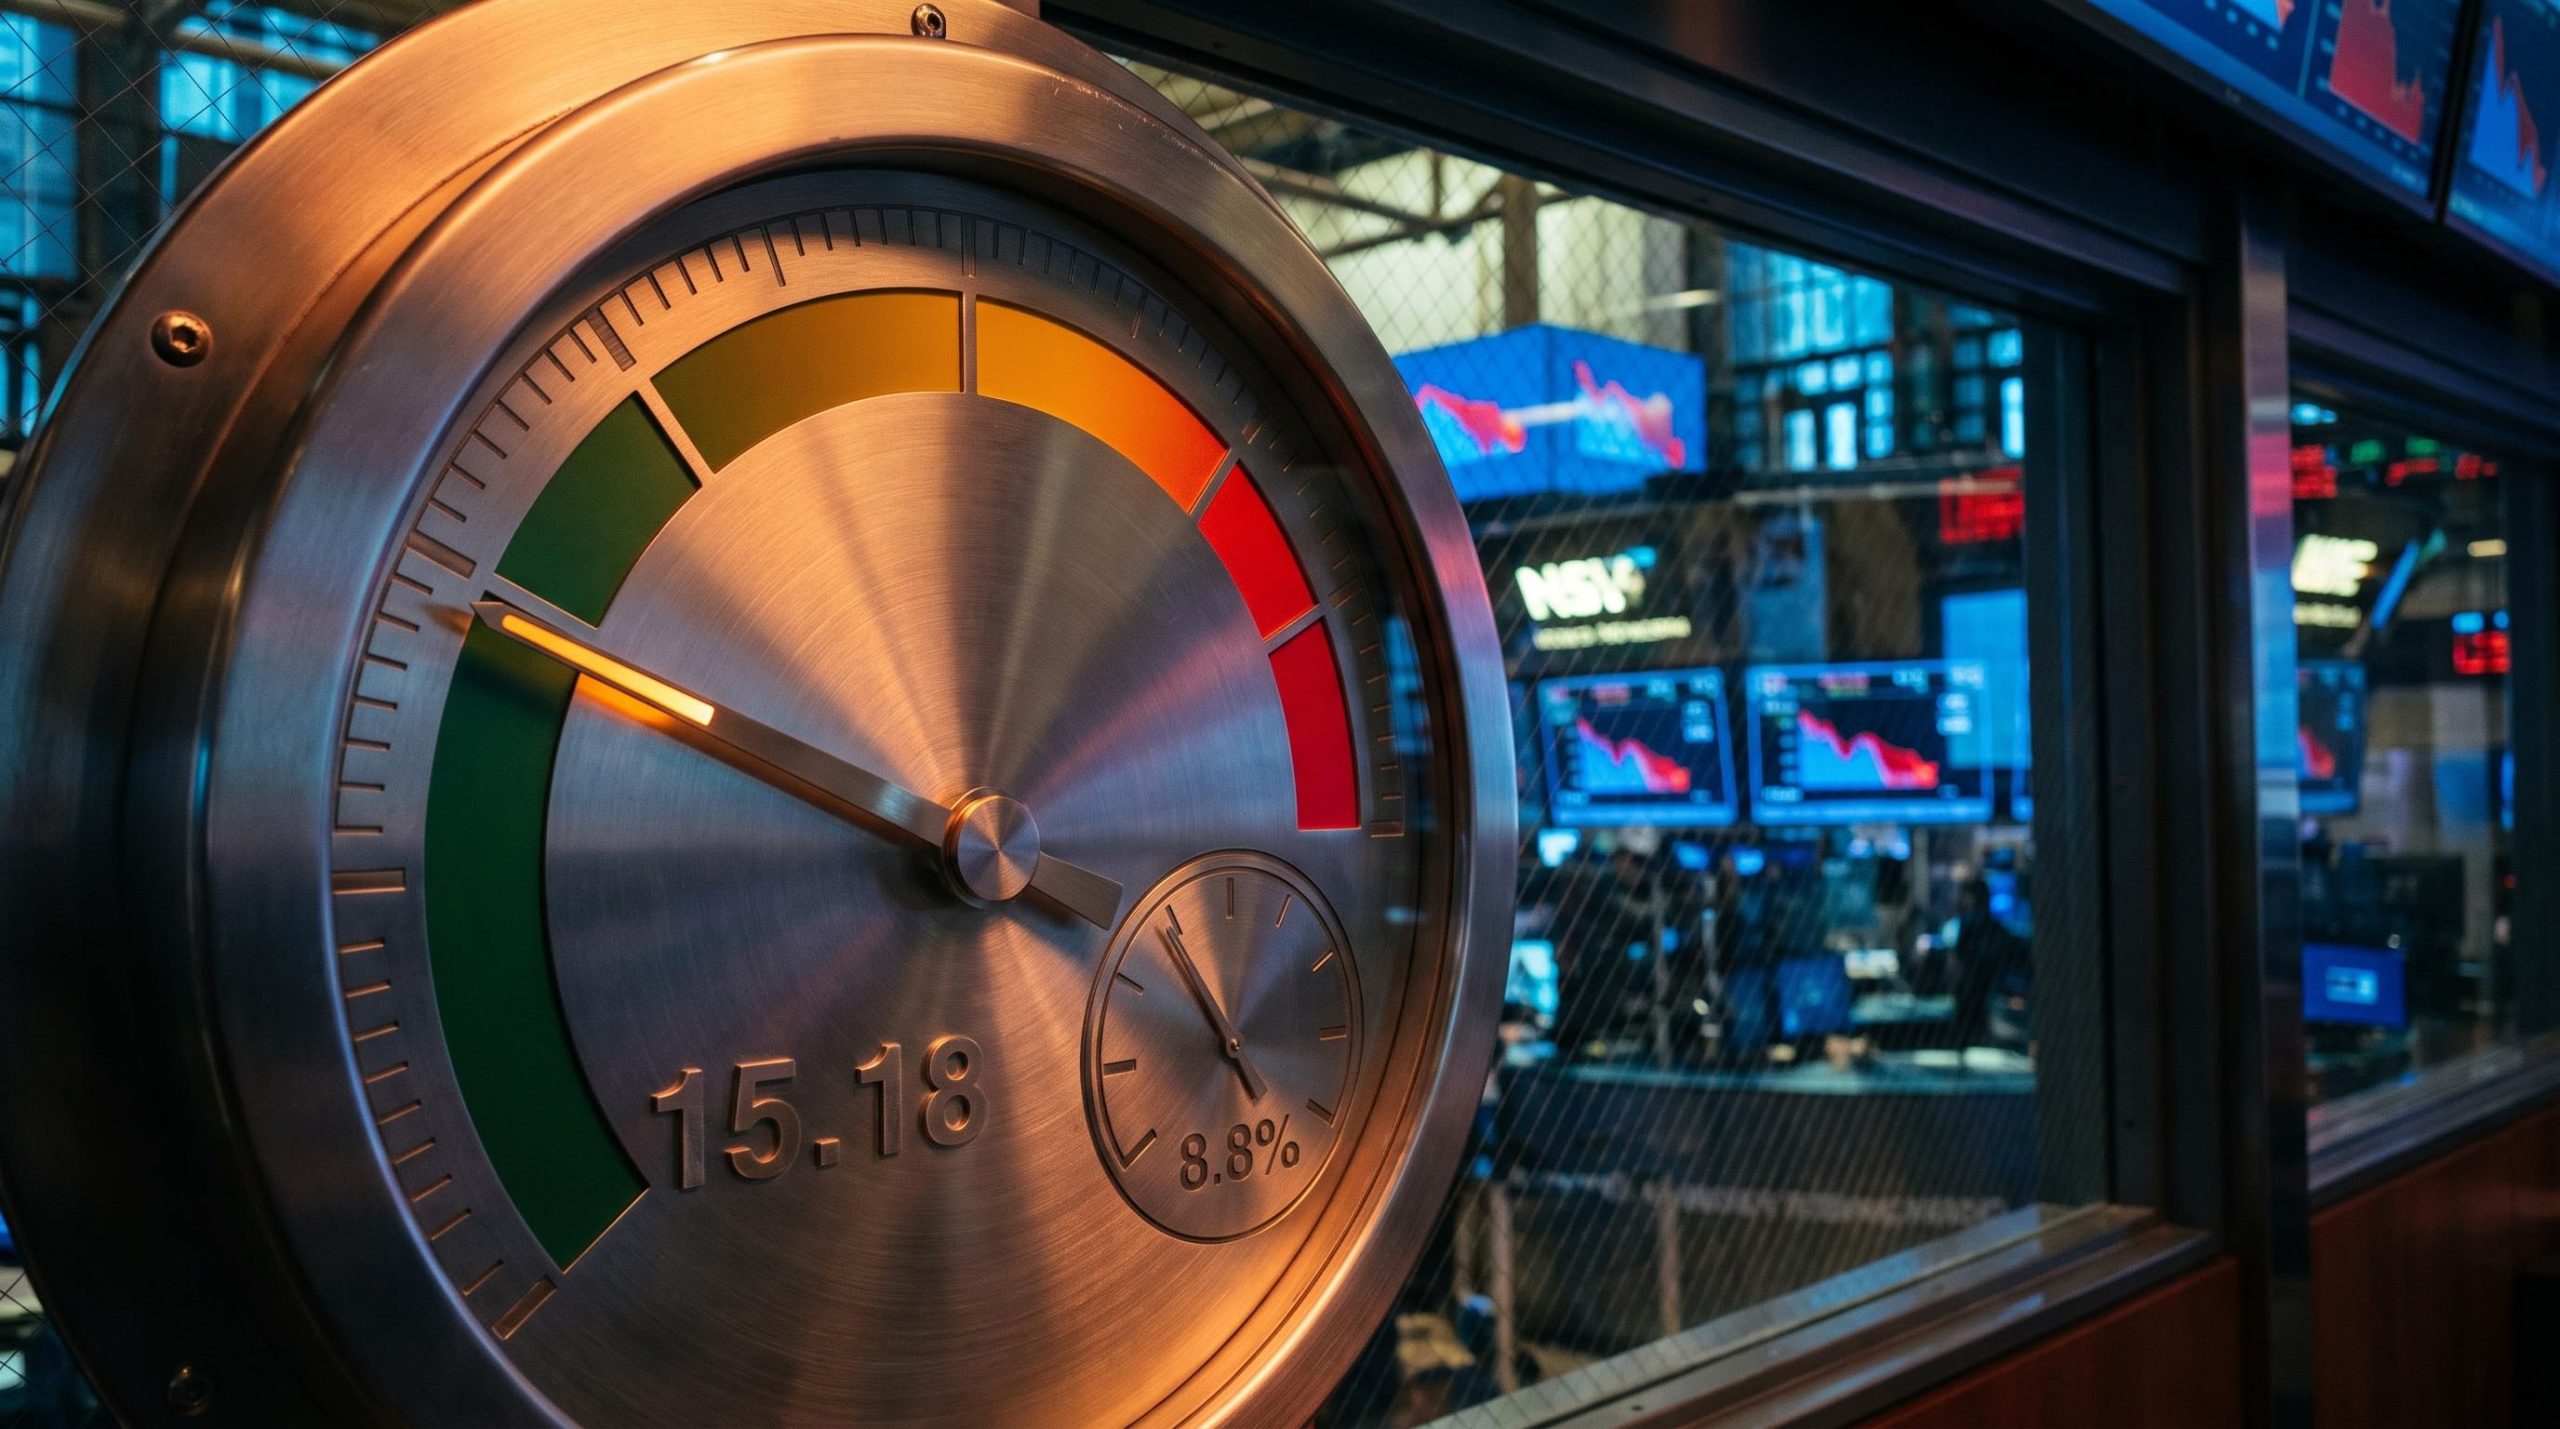
A quiet market feels like a safe market. That instinct is exactly what gets self-directed investors hurt.
Right now, in late September 2026, the Cboe Volatility Index sits in the mid-teens. On the surface, that reads as calm. Underneath, several major US indices are showing rotational stress and technical fractures that the headline number is not capturing.
This is the trap. Extended stretches of extreme quiet tend to breed complacency, and complacency is the raw material of violent reversals.
The disconnect between a low VIX and deteriorating price action beneath it is precisely the kind of signal most investors miss until it lands on the front page.
After reading this, you will have a framework for reading volatility metrics alongside index-level chart signals. That combination lets you spot hidden market risk before it becomes a headline, and it changes how you interpret a low VIX historic lows warning when everyone around you is relaxed.
The illusion of the low volatility bull market
Pull up the VIX right now and you will see a number that looks reassuring. As of 23 September 2026, the index closed at 15.18, according to Cboe Global Markets, with recent sessions clustering in the 14-16 range. That is near the bottom of its 52-week span of 13.38-35.30.
So what is the VIX actually telling you? It measures implied volatility on the S&P 500: essentially, what options prices say about how much the index is expected to move over the next 30 days. A low reading means traders are paying very little for protection because they expect very little turbulence.
Saxo Bank formally classified the mid-September 2026 environment as a “Low Vol Bull” regime. Their 14 September 2026 note logged the VIX at 15.84, the S&P 500 sitting 0.65% above its 50-day moving average, and 20-day realised volatility at 8.8% and falling. Realised volatility measures how much the index has actually moved recently, and under 9% is a genuinely quiet market.
Here is where the calm becomes dangerous. When protection is this cheap, the entire market has effectively priced out near-term risk. That unanimous complacency is not a comfort. It is the condition that lets a shock do maximum damage, because almost no one is positioned for it.
The decoupling is measurable: on 2 September 2026, the VIX closed at 15.20 while the VIXEQ, which tracks stock volatility vs VIX at the individual equity level, sat at 40.5, revealing that the index was masking enormous dispersion beneath an artificially pinned surface.
Volatility also tends to mean-revert. Extremely low readings are far more likely to be followed by higher volatility than by further compression, which is why many institutional risk models treat prolonged quiet as a late-cycle warning rather than a new normal.
| Metric | September 2026 reading | What it signals to investors |
|---|---|---|
| Spot VIX | 15.18 (23 September 2026) | Near the bottom of the 52-week range; minimal near-term fear priced in |
| 20-day realised volatility | 8.8% and falling | Actual index moves are genuinely small, reinforcing the calm |
| Forward options pricing | Futures in contango, skew elevated | Day-to-day calm, but tail protection is still in demand |
Why cheap insurance creates systemic risk
Prolonged calm encourages short-volatility positioning. When option premiums look rich against tiny realised moves, traders sell index options, structured products, and VIX futures to collect that premium. Over time, this builds a crowded, systemic short-vol position across the market.
The problem surfaces when a shock hits. Those sellers are suddenly forced to buy volatility back, all at once, which amplifies demand for protection and turns a modest selloff into a steep one. That feedback loop is not theoretical, and it is why cheap insurance today can mean expensive damage tomorrow.
Approximately $1.5 trillion in short-volatility exposure from systematic strategies and structured product issuers is mechanically suppressing measured volatility without reducing the underlying economic risk, meaning the headline reading reflects the market’s positioning mechanics as much as its genuine assessment of near-term stability.
When big ASX news breaks, our subscribers know first
Modern market plumbing and the broken gauge
There is a deeper problem with taking the VIX at face value, and it has nothing to do with sentiment. The gauge itself may be measuring the wrong things.
The standard VIX calculation focuses on a 30-day implied volatility window built from S&P 500 index options. That design made sense when index options were where hedging happened. The plumbing of the options market has since changed, and a large share of real risk activity now flows through channels the 30-day calculation barely touches.
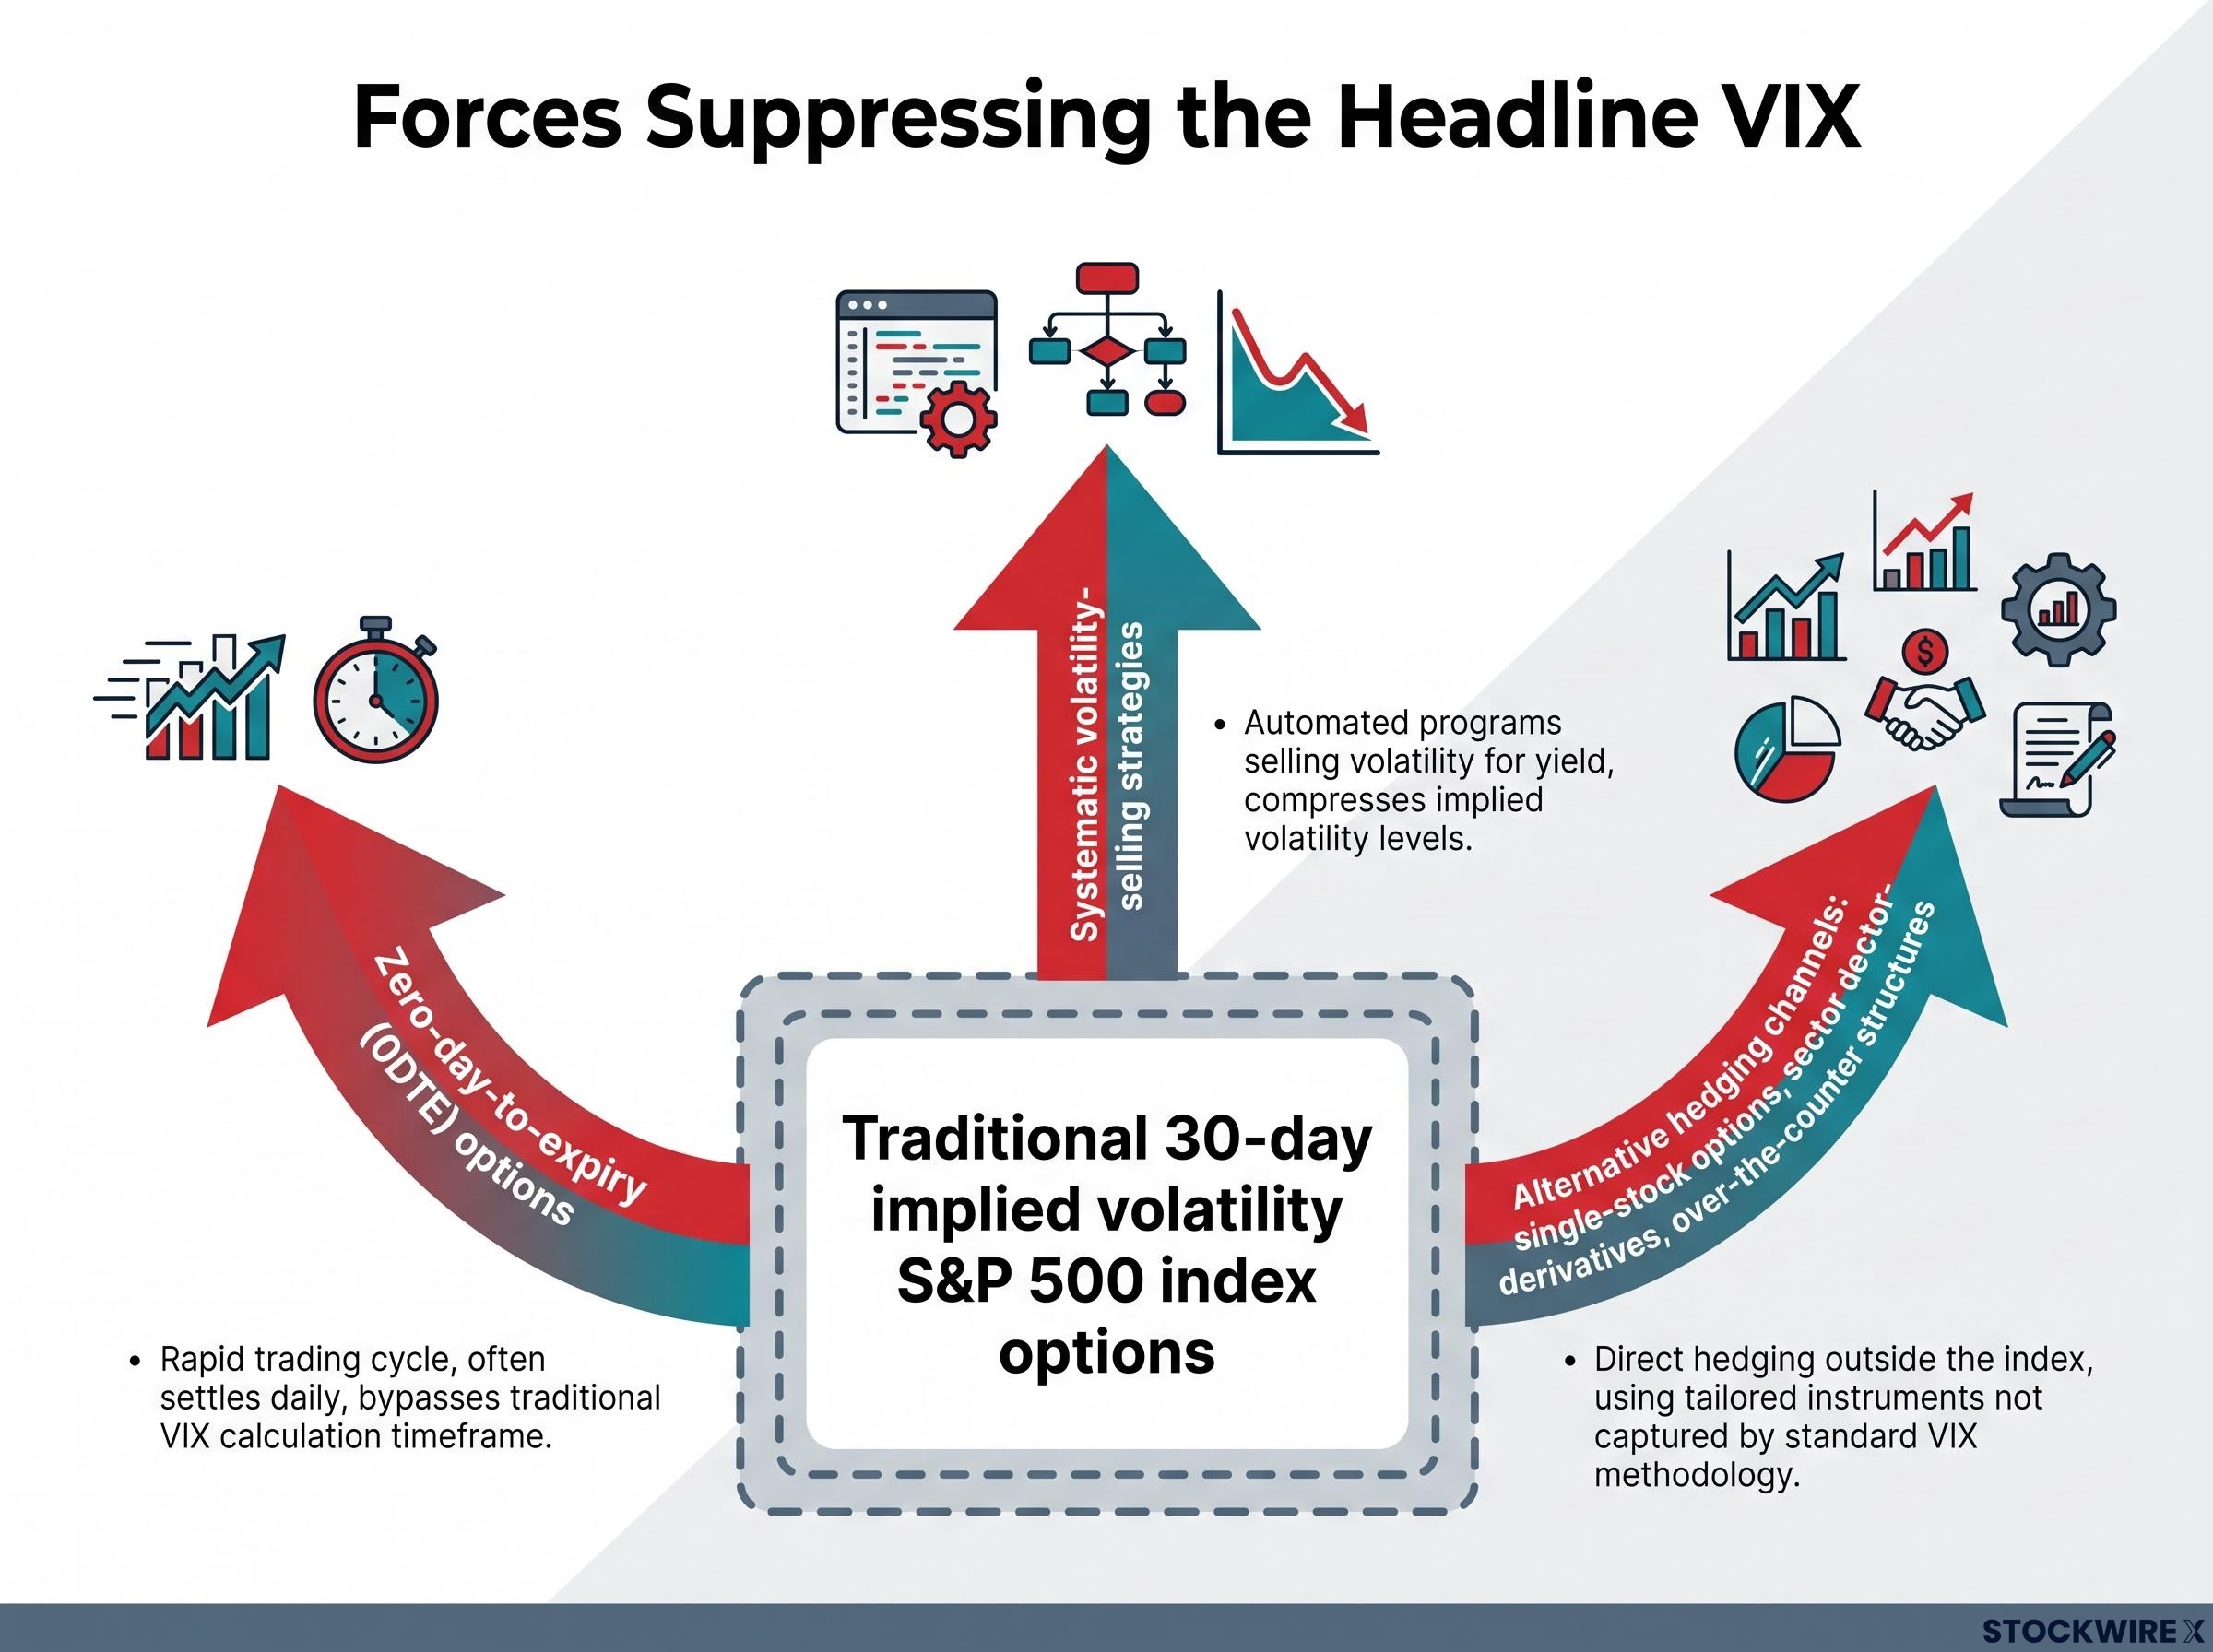
Three structural forces are suppressing the headline number:
- Zero-day-to-expiry (0DTE) options. Enormous hedging and speculative activity now concentrates in options expiring the same day. These very short-dated contracts do not feed into the 30-day VIX window, so intense intraday flows can leave the headline reading artificially low.
- Systematic volatility-selling strategies. Vol-selling funds, option-writing programmes, and structured products continuously supply options into the market. This persistent supply pushes implied volatility lower for reasons of mechanics, not conviction.
- Alternative hedging channels. Institutions increasingly hedge through single-stock options, sector derivatives, and over-the-counter structures rather than S&P 500 index options. If index options are not the main hedging vehicle, the VIX understates how much protection the market is actually buying.
There is a dealer dynamic underneath all this too. Market makers often end up long volatility and short gamma, hedging their books dynamically in ways that absorb options flows and structurally suppress index-level spikes. That stores latent risk that never appears in the headline figure.
What this means for you is uncomfortable but useful. The shift of volume into 0DTE and off-index hedging tells you the traditional fear gauge is missing large amounts of real risk. The numbers on your financial portal are not wrong, exactly. They are fundamentally incomplete, and taking false comfort from a low VIX means evaluating your exposure against outdated assumptions rather than actual market mechanics.
The technical fractures widening beneath the surface
If the VIX is muted and possibly blind, the next question is obvious: what is the price action itself saying? In September 2026, the honest answer is that it is deteriorating, and the contrast with the calm headline is stark.
The broad market has been trading sideways for roughly four months following a prior peak, punctuated by sharp swings in both directions. That kind of choppy consolidation is punishing for both buyers and sellers, repeatedly triggering false breakouts and false breakdowns. Beneath it, specific indices are fracturing in ways that matter.
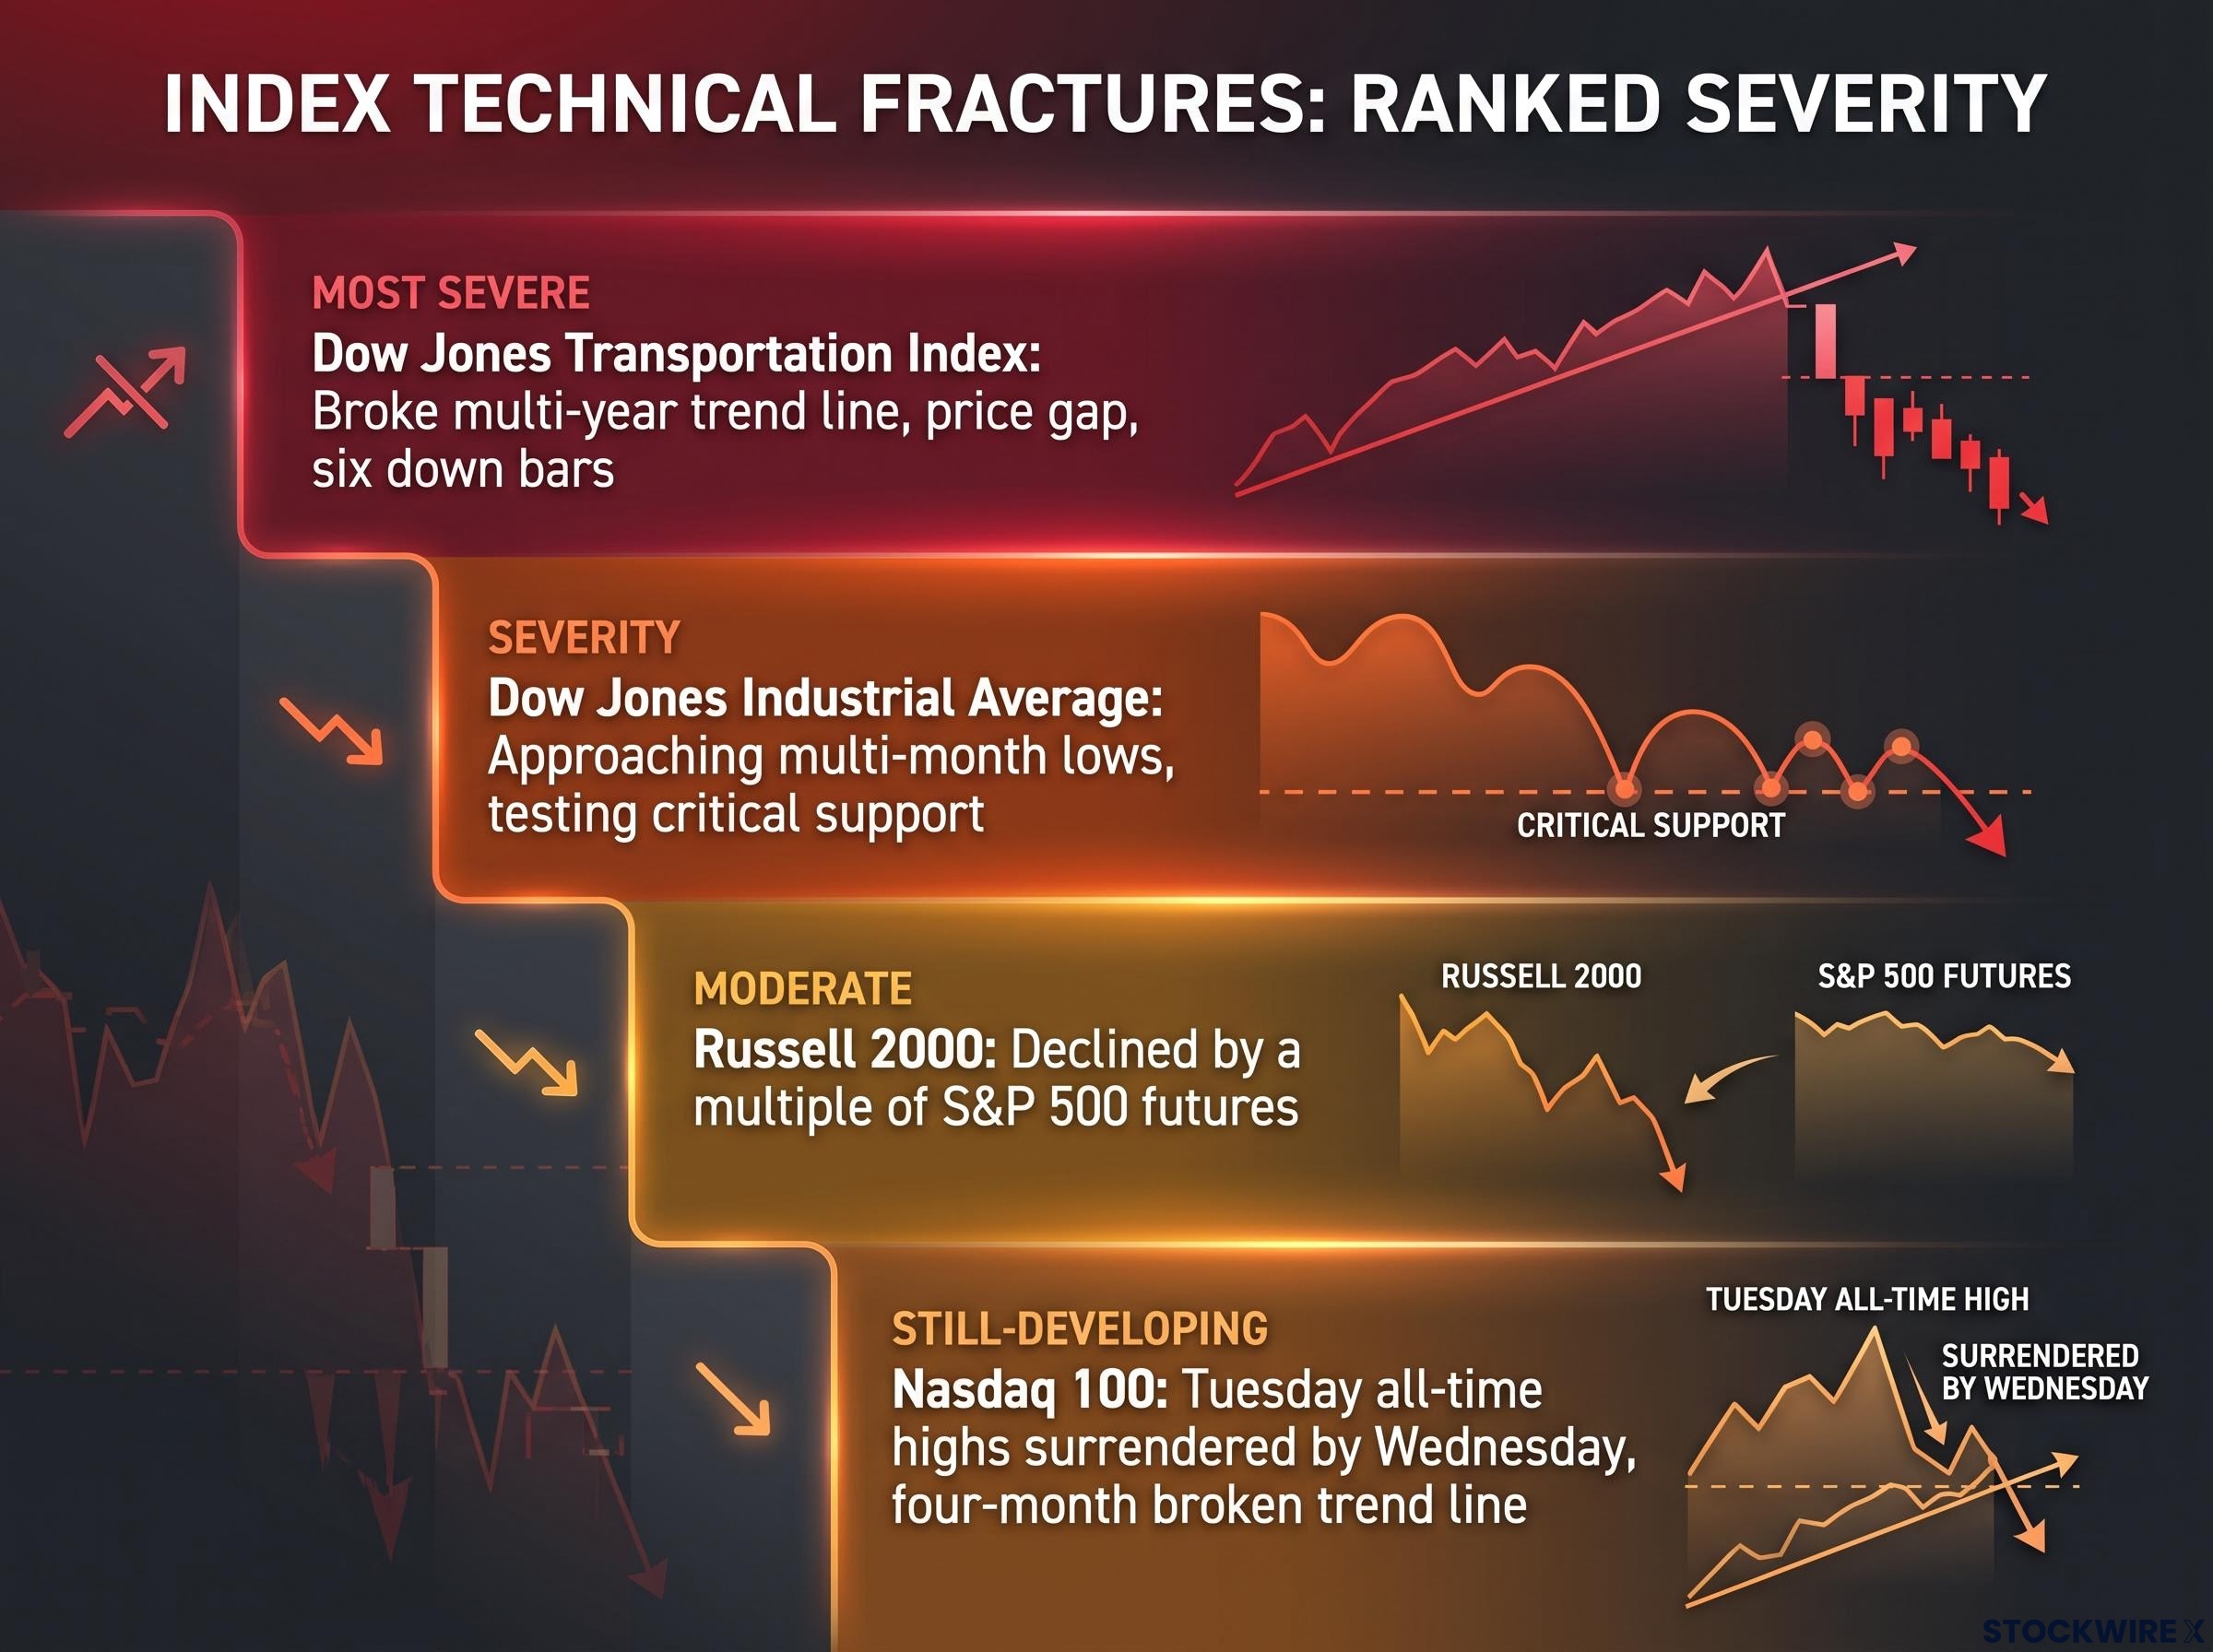
Ranked from most severe to still-developing, here is what the charts are showing:
- Dow Jones Transportation Index. Broke its multi-year trend line roughly a week before the session under analysis, following a solid distribution pattern, a price gap, and six consecutive down bars. The clearest bearish signal in the set.
- Dow Jones Industrial Average. Among the weakest major US indices for several months, approaching multi-month lows and testing critical support, with a close below the prior Wednesday’s low potentially completing a topping pattern.
- Russell 2000. Declined by a multiple of the S&P 500 futures during late-September sessions, a hallmark of risk-off rotation out of smaller, speculative names.
- Nasdaq 100. Pushed to all-time highs on a Tuesday, then surrendered the gains entirely by Wednesday, still working around a four-month broken trend line. A failed breakout, not yet a confirmed break.
That divergence, large-caps holding while small-caps buckle, is a familiar risk-off pattern. When money leaves the speculative end of the market first, it usually reflects institutions quietly reducing risk rather than adding it.
The transportation index as a leading indicator
The Transportation Index break deserves its own attention. Transport stocks, the trucking, rail, and freight names, move goods around the real economy, which is why their price action often leads the broader industrial and consumer picture.
A clean violation of a multi-year trend line, supported by volume distribution and sequential down bars, is not a shallow pullback. It reads as institutional distribution: large holders steadily selling into strength.
The signal here is direct. When transports break down while the headline indices look calm, it tells you the calm is hiding a stealth correction, and that the weakness may spread into the industrial and consumer sectors your portfolio likely holds.
What the smart money is actually pricing in
Here is the contradiction that ties everything together. The spot VIX says relax. The forward market says something very different.
VIX futures for September and October 2026 have been trading at a premium to spot, roughly 0.8 to 2.5 points above the cash index, with the curve in steep contango. Contango simply means later-dated contracts cost more than nearer ones, which signals that traders expect more volatility ahead, particularly around upcoming CPI releases and Federal Reserve decisions. One analysis by TS2.tech pegged that premium at up to 17% above spot in early September.
VIX futures contango is not a lag or a pricing error: on 31 July 2026, the August contract settled at 18.10 against a spot close of 15.99, a 13% premium driven by structural non-replicability and persistent hedging demand that no arbitrage mechanism can close, which is why the curve’s current steep slope carries genuine forward-looking content.
Skew is telling the same story. Saxo’s skew metrics have held in the elevated 145-155 range even under the “Low Vol Bull” label. Skew measures how much more expensive downside protection is relative to upside bets, and elevated skew means deep out-of-the-money put options, the crash insurance, remain pricey.
Read together, this is the asymmetry. Day-to-day, the market is priced for calm. Behind the scenes, institutions are still paying up for protection against a sharp drop. That gap between cheap spot volatility and expensive tail risk is what large players are quietly positioning around, and it is the strongest argument for reviewing your own downside protection now rather than after a shock.
History rhymes with this setup.
In February 2018, the “Volmageddon” episode saw inverse VIX products collapse after a long stretch of ultra-low volatility, as crowded short-vol positions were forced to unwind at once. The 2006-2007 period offers a longer-fuse version: the VIX sat near or below 15 even as systemic risk accumulated in housing and structured credit. Both show that low index volatility can coexist with mounting fragility, and that mean reversion, when it comes, arrives fast.
Navigating the volatility gap without selling early
The core contradiction is now clear. Headline volatility is suppressed, arguably understated by market structure, while the technical picture beneath it deteriorates and the forward curve prices in real risk. Those signals point the same direction.
The honest framework is one of asymmetry. With the market priced for continued calm, the upside from here looks limited while the downside has room to surprise. That does not mean sell everything today.
A low VIX is a vulnerability marker, not a timing tool. These regimes can persist for months, and treating a low reading alone as a sell signal usually just generates early exits and missed gains. Patience and disciplined risk management matter more than a dramatic exit.
The practical takeaway is preparation over prediction. Review your hedges, trim your most speculative exposure, and know your exit levels before you need them. The most dangerous moment to buy the dip is when everyone assumes the water is safe.
For investors who want to apply the mosaic method in practice, our full explainer on reading multiple volatility factors walks through how to combine the VIX level, term structure slope, the realised-to-implied spread, and dealer gamma positioning into a single coherent risk picture rather than chasing whichever single indicator is loudest.
This article is for informational purposes only and should not be considered financial advice. Investors should conduct their own research and consult with financial professionals before making investment decisions. Past performance does not guarantee future results, and these statements are speculative and subject to change based on market developments.