
The Eurozone economy just delivered its strongest composite reading since April 2023. The euro fell anyway.
That contradiction sits at the centre of today’s currency story. EUR/USD has broken definitively below its 200-day simple moving average, surrendering one of the most closely watched technical floors in the world’s most heavily traded currency pair. The break lines up with a broader macroeconomic shift, as renewed Federal Reserve hawkishness fuels a systemic dollar bid now sweeping across global currency and commodity markets.
For traders, this is not a European problem. It is a dollar problem, and understanding the difference changes how you position around every level from here.
This analysis lays out a clear framework for reading the pair’s near-term price action. It maps the specific downside support levels now in play, explains the conflicting signals flashing across major momentum indicators, and connects the chart damage to the policy divergence driving it.
Sizing up the 200-day moving average breakdown
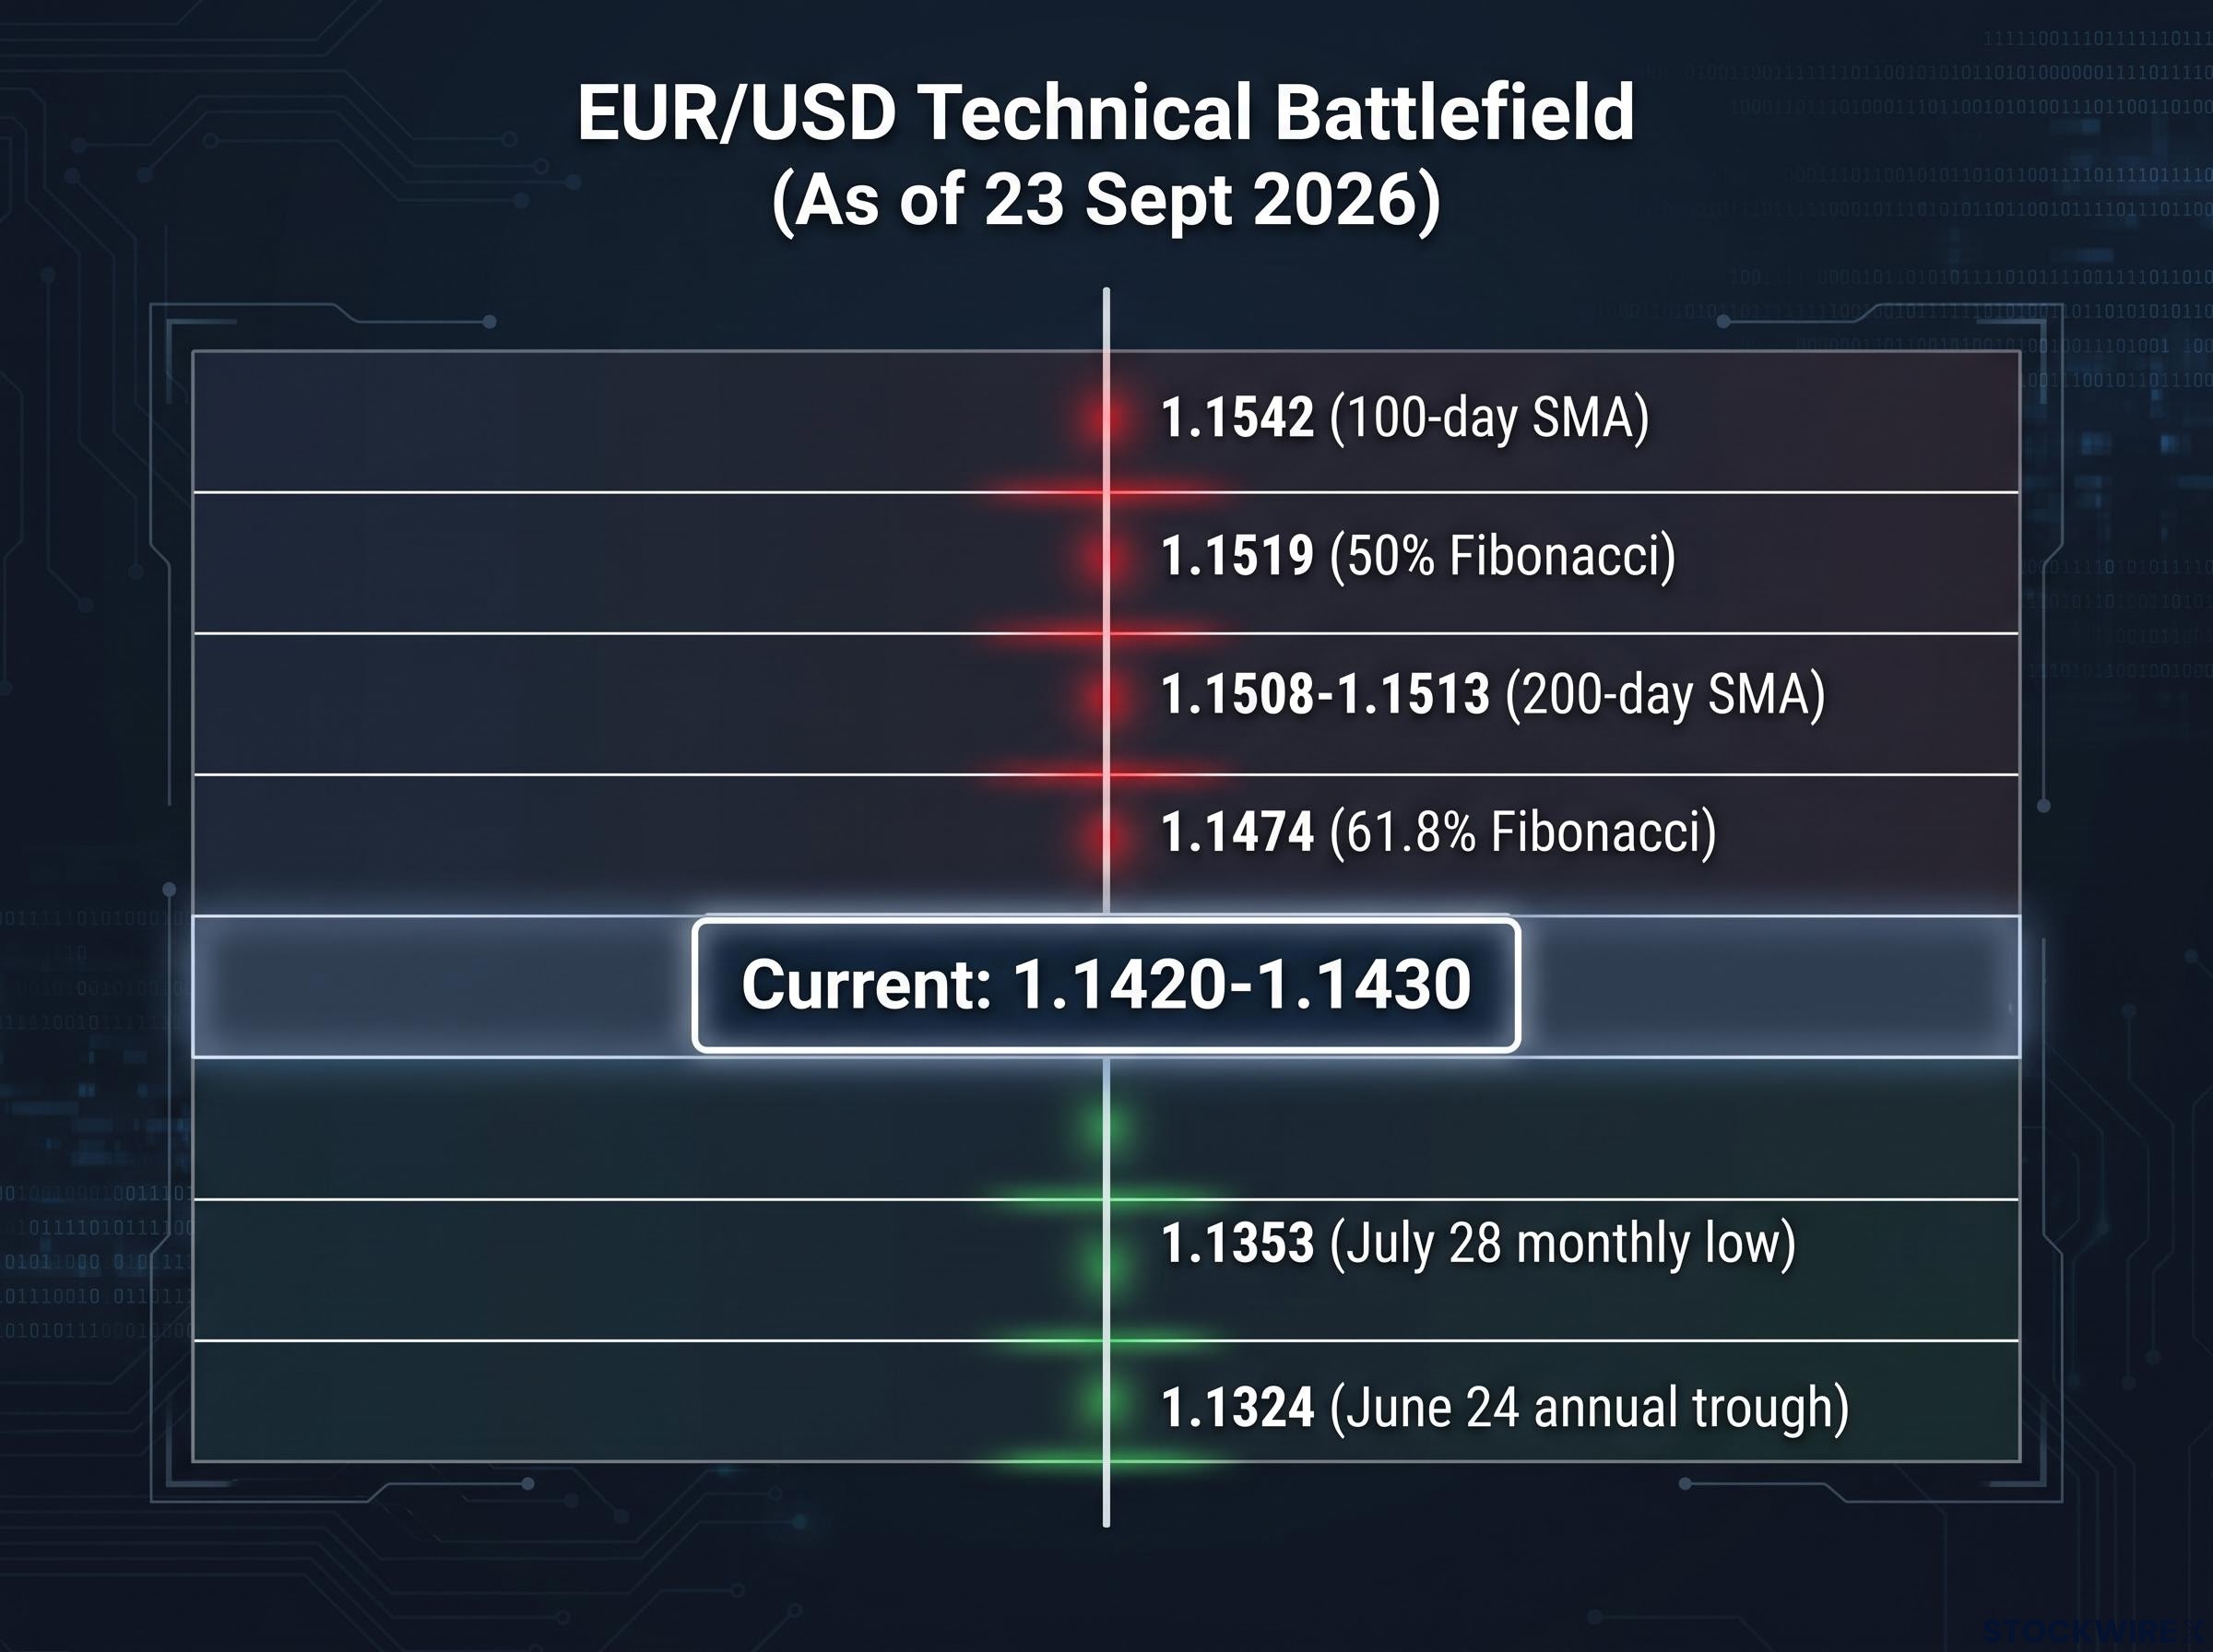
The technical damage is layered, and it is worth walking through in sequence. As of 23 September 2026, EUR/USD trades near 1.1420-1.1430, sitting below both of its major long-term moving averages. The pair has breached its 100-day SMA, currently near 1.1542, and, more significantly, it has dropped beneath the 200-day SMA.
That 200-day line has drifted lower over recent months as newer data replaced older observations, and it now sits in the 1.1508-1.1513 region, roughly the 1.15 handle. A moving average is simply the average closing price over a set number of days, and the 200-day version is the benchmark most institutional desks use to define the medium-term trend. Losing it is not a rounding error.
Moving average crossovers always arrive late by design: the 200-day SMA can only signal a trend change after prices have already trended in the new direction for weeks, which is why the break below the 200-day line in EUR/USD confirms a shift already priced into momentum indicators rather than predicting fresh direction from scratch.
The loss of the 1.15 handle tells you the medium-term bias has shifted firmly bearish. Your trading strategy now has to look further back, to older historical floors, to gauge where large buyers might step in.
Those floors are specific. The first is the July 28 monthly low at 1.1353. Below that sits the June 24 annual trough at 1.1324, the lowest point of 2026. Pablo Piovano, Senior Analyst at FXStreet, cautions that further losses cannot be excluded given the break beneath the 200-day SMA, with selling pressure likely to test that July floor before the June low comes into focus.
On the upside, any recovery attempt runs into resistance quickly. The 50% Fibonacci retracement at 1.1519 and the 61.8% retracement at 1.1474 cap near-term rebounds, with the former now clustered right around the reclaimed 200-day line.
| Level type | Price target | Significance |
|---|---|---|
| Resistance | 1.1542 | 100-day SMA, secondary overhead barrier |
| Resistance | 1.1519 | 50% Fibonacci retracement, near the recovered 200-day SMA |
| Resistance | 1.1474 | 61.8% Fibonacci retracement, first ceiling on any bounce |
| Support | 1.1353 | July 28 monthly low, initial downside target |
| Support | 1.1324 | June 24 annual trough, the 2026 low |
These are the boundaries of the current battlefield. Where the pair trades between them tells you whether sellers are pressing the trend or whether a corrective bounce has room to run.
When big ASX news breaks, our subscribers know first
Why stretched momentum complicates the current downtrend
Here is where the picture gets more complicated, and where most retail traders get caught. The trend is strong and pointing down, but the momentum behind it is stretched to a point that argues against selling blindly.
Two indicators tell that story together. The Average Directional Index (ADX) measures how strong a trend is, without saying anything about its direction. The Relative Strength Index (RSI) measures whether a move has become overextended, on a scale of zero to 100.
Both were developed by J. Welles Wilder in his 1978 work on technical trading systems, and both are reading toward extremes right now. ADX readings across major platforms range from 29 to 52, well above the level of roughly 25 that Wilder used to confirm a trending market. That is a powerful, persistent downtrend.
The RSI, meanwhile, is sitting between 28 and 34, at or just below the 30 mark that signals oversold conditions. A reading near 30 in a falling market means the selling has been intense enough that a pause or counter-move becomes more likely, even if the broader trend stays intact.
That is the tension. A high ADX warns against betting against the trend, while a near-oversold RSI warns against piling into fresh shorts at unfavourable prices. Both cannot be acted on at once, which is precisely why this setup demands patience.
Institutional desks generally treat this combination as producing three scenarios:
- Trend continuation after shallow consolidation. Price drifts sideways or bounces modestly to work off the oversold condition, then resumes lower while ADX stays elevated and moving-average resistance caps the rebound. This is the primary path when trend strength holds.
- Sharp mean-reversion rally. A strong catalyst, such as a dovish Fed surprise or upbeat Eurozone data, triggers a fast short-covering bounce. The medium-term trend can remain bearish even as the pair snaps higher for a session or two.
- Potential trend exhaustion. If RSI stays oversold but price stops making new lows and ADX begins to roll over, many analysts read that as an early sign the downtrend is losing energy and a more durable base is forming.
The takeaway for your own positioning is direct. You cannot simply sell the breakdown when momentum is this stretched. The disciplined move is to watch for shallow consolidations that reset the oversold condition before committing fresh capital, rather than chasing the move at its most extended point.
For traders wanting to build a more systematic framework around the ADX and RSI confluence described here, our comprehensive walkthrough of stacking technical indicators explains how combining signals from independent analytical families raises the estimated probability of a trade moving in the anticipated direction from roughly 60% with one factor to approximately 85% with three.
How Federal Reserve policy overrides European data surprises
So why is the euro falling while European data comes in hot? The answer sits with the Federal Reserve, not the European Central Bank.
The dollar’s structural grip on global markets means Fed rate decisions transmit into currency strength far beyond the bilateral EUR/USD rate: the dollar appears on one side of 89.2% of all global FX transactions, giving the Fed an outsized transmission mechanism that no other central bank can replicate.
The Federal Open Market Committee raised its benchmark target range by 25 basis points to 3.75%-4.00% at its meeting concluded on 16 September 2026. More important than the hike itself was the guidance that came with it. The updated dot plot, which charts where each policymaker expects rates to head, showed 16 of 18 officials projecting at least one further hike by year-end, pushing the median endpoint toward 4.00%-4.25%.
This is a Fed signalling that it intends to stay restrictive, and possibly tighten further. That is a straightforwardly dollar-positive backdrop, and it explains the sustained selling in EUR/USD far better than anything happening in Frankfurt.
The shift in tone has been sharp. Through the middle of the year, the consensus among economists surveyed by Reuters was for the Fed to hold steady for the rest of 2026. By mid-September, that same consensus had flipped to expecting the September hike plus at least one more move by early 2027, a decisive turn from a summer pause back into an autumn tightening cycle.
The September PMI divergence
Against that hawkish US backdrop, the Eurozone delivered genuinely strong numbers. Flash Purchasing Managers’ Index (PMI) data released on 23 September 2026, a survey of business activity where any reading above 50 signals expansion, beat expectations across the board.
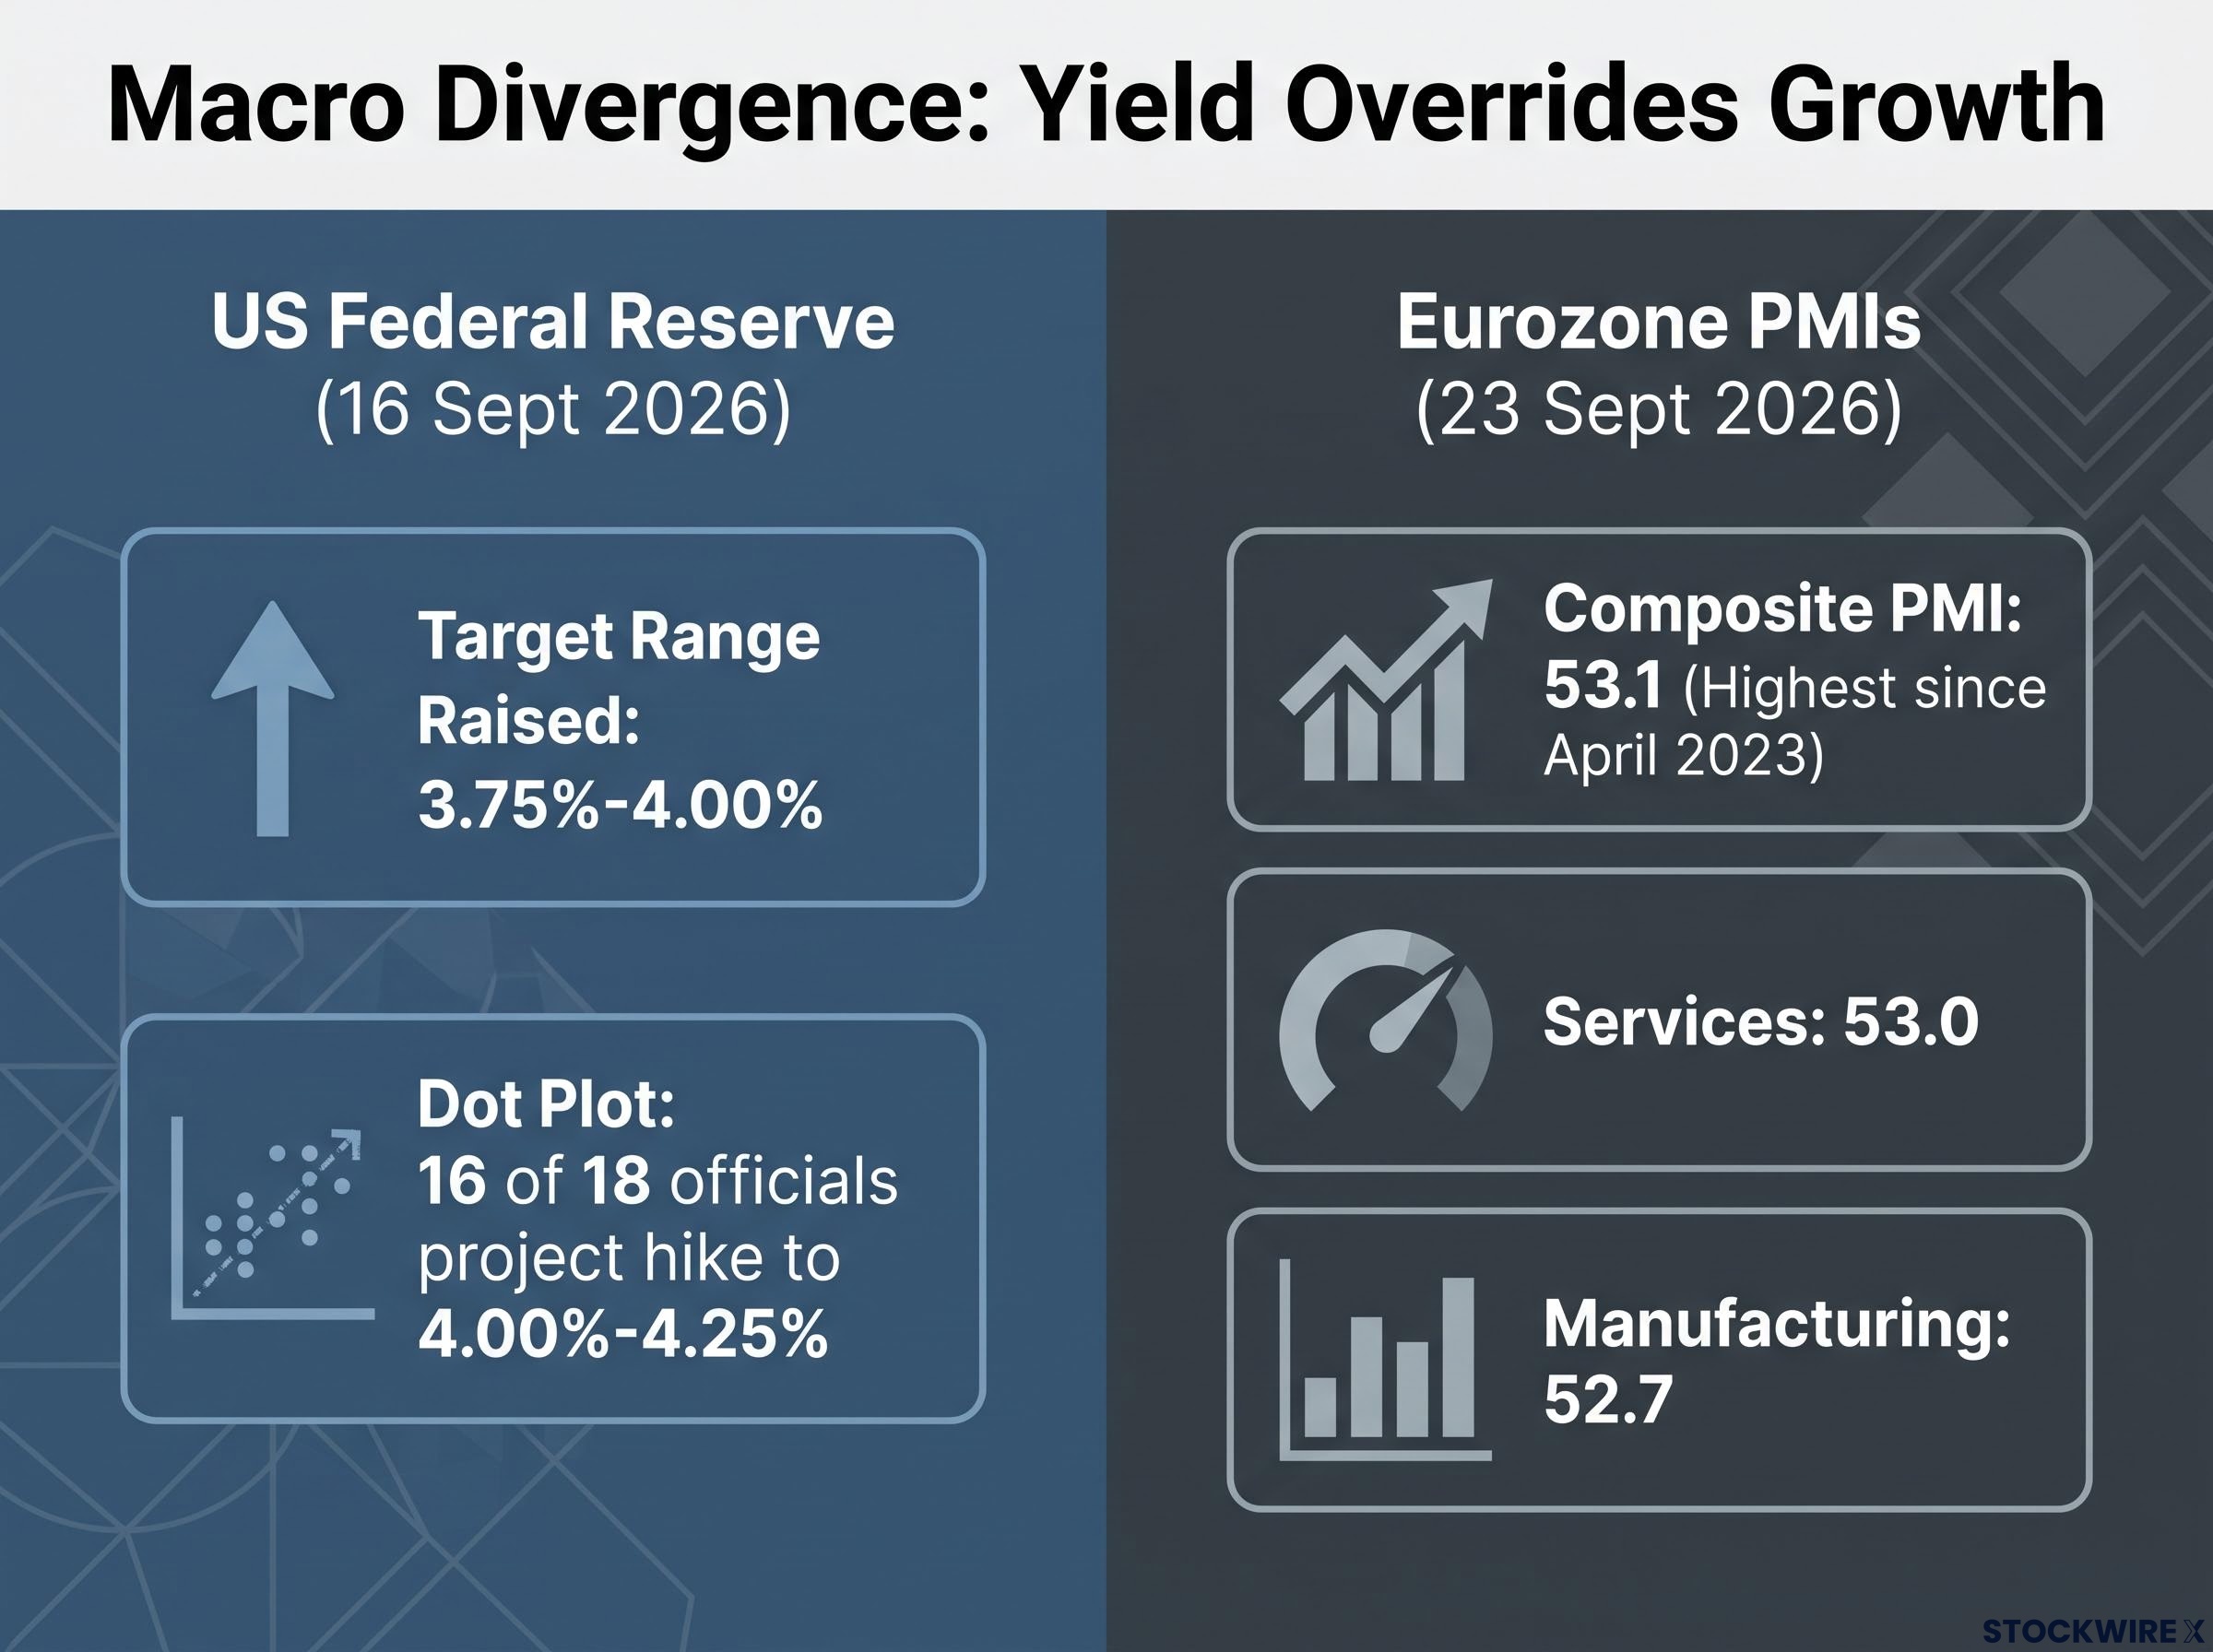
The Composite PMI jumped to 53.1, the highest since April 2023. The Services PMI rose to 53.0, and Manufacturing held at 52.7. On paper, that is exactly the kind of surprise that should support a currency.
The euro fell anyway. That reaction tells you something concrete: the market is prioritising absolute yield advantage over relative economic momentum. When one central bank is still raising rates and offering higher returns on its currency, strong growth data elsewhere struggles to compete.
For your own read, the implication is clear. Keep your focus fixed on US rate expectations rather than on European indicators, because right now the dollar’s yield advantage is overriding almost everything the Eurozone reports.
Validating the dollar bid through cross-asset signals
Pull the camera back and the picture sharpens further. The euro’s weakness is not an isolated European story. It is one thread in a broad dollar move showing up across currencies, metals, and even digital assets.
The same Fed-driven strength is pressuring risk-sensitive and yield-sensitive assets everywhere:
- AUD/USD is testing the 0.7100 level, weighed down by soft Australian data as flash PMIs showed manufacturing slipping into contraction, layered on top of the broad dollar bid.
- USD/JPY is hovering in the mid-157.00s, near two-week highs. The Bank of Japan raised its short-term rate target to 1.25% from 1.00% in a 7-2 vote, but the move was read as less hawkish than some expected, leaving the yen soft against a firm dollar.
- Gold is under pressure near $4,300, as rising yields reduce the appeal of a metal that pays no interest.
- Bitcoin is trading above $86,000, up more than 6% on the week, holding firm on strong institutional demand through spot exchange-traded funds even as traditional assets soften.
The pattern is what matters here. When the dollar breaks higher simultaneously against the yen, the Australian dollar, and gold, that confirms for you that the euro’s breakdown is a systemic macroeconomic move, not a case of localised European weakness.
The DXY breakout confirms this dynamic: the Dollar Index cleared 100 for the first time in seven weeks on a unanimous Fed hike to 3.75-4.00% and a dot-plot median that jumped 30 basis points, with the USD outperforming every major currency pair over the same week EUR/USD lost its 200-day floor.
That distinction protects you from tunnel vision. Trade EUR/USD as a dollar story, and every one of these cross-asset moves becomes a confirmation signal rather than background noise.
Establishing risk parameters for the next technical test
The setup comes down to a collision between a confirmed technical breakdown and a Fed that shows no sign of softening. The 200-day SMA has been lost, momentum is strong but stretched, and the policy divergence firmly favours the dollar.
That leaves two paths to watch. A continuation lower opens the door to the 1.1353 July floor and then the 1.1324 June trough, most likely after a shallow consolidation resets the oversold RSI. A relief rally, sparked by a dovish catalyst or a short squeeze, would need to reclaim the 1.15 resistance zone to signal anything more than a corrective bounce.
The next catalyst arrives quickly. The Trump-Xi summit on 24 September 2026 could determine whether the US-China trade truce holds, injecting fresh volatility across every asset discussed here.
This article is for informational purposes only and should not be considered financial advice. Investors should conduct their own research and consult with financial professionals before making investment decisions.
Past performance does not guarantee future results, and these forward-looking scenarios are speculative and subject to change based on market developments.