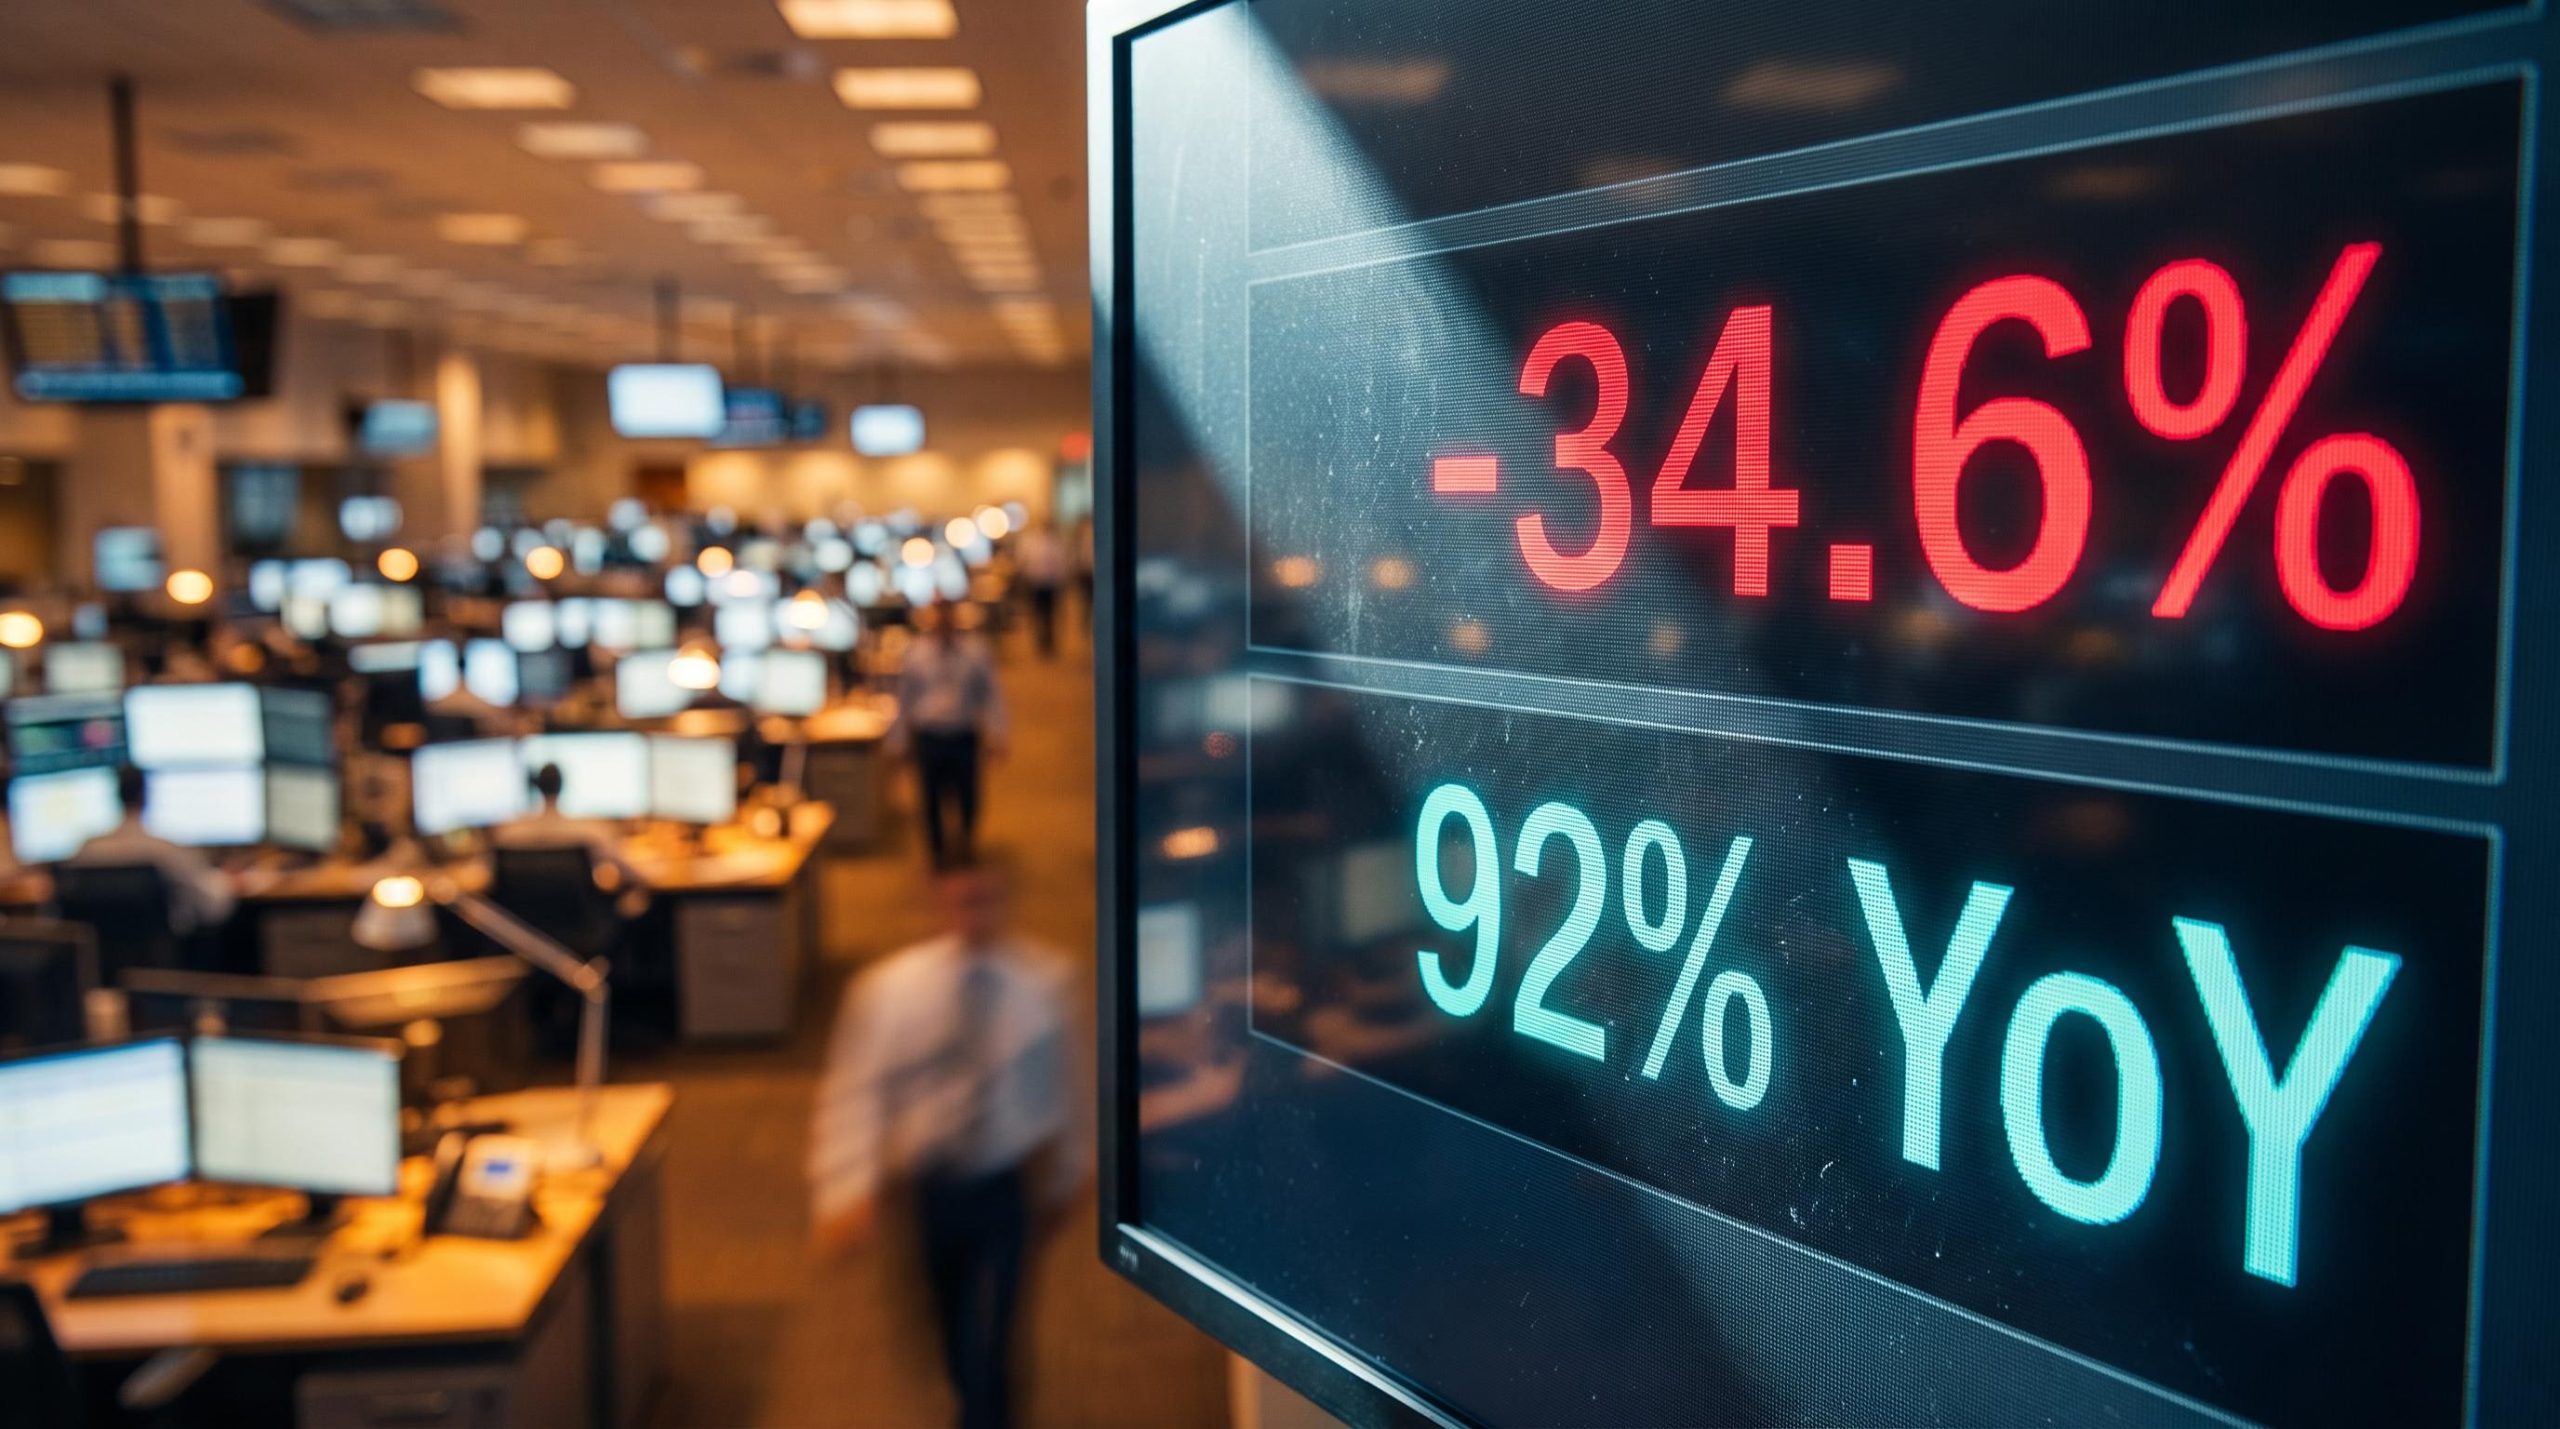
Two numbers from the second quarter of 2026 describe the same market and appear to tell opposite stories. Worldwide data-center capital spending grew 92% year-over-year, according to IEEE ComSoc, and inflation-adjusted spending on information-processing equipment hit $752 billion, per the Bureau of Economic Analysis. Both figures scream boom.
Yet in that same quarter, a key growth-rate measure of AI investment registered a -34.6% contraction. One number signals acceleration. The other signals a turning point. The distinction between them is the entire reason to keep reading.
For U.S. investors, the timing of this AI investment cooling matters right now. Hyperscalers are committing between $660 billion and $900 billion to capital expenditure in 2026, roughly a 36% increase over 2025. But J.P. Morgan projects that spending will consume 90-100% of operating cash flow this year, up from 60% in 2025. When capital efficiency tightens that fast, the rules of the trade change underneath the investors still watching the headline dollar figures.
This piece maps the four pressure points that determine whether the cycle is entering a productive consolidation or the early stage of a structural unwind. The goal is to give you a lens for reassessing technology sector exposure now, rather than after the market has repriced it for you.
The growth rate signal hiding inside the headline numbers
Start with the two figures side by side. Data-center capex rose 92% in Q2 2026 against the prior year. In the same window, the AI investment growth rate came in at -34.6%. Both are accurate. The confusion comes from measuring two different things.
The 92% figure is the absolute level: how much money moved into infrastructure compared with a year ago. It is still enormous, and it is still rising. Combined hyperscaler capex reached $129.8 billion in Q1 2026, up 80% year-over-year.
The -34.6% figure is the rate of change: how fast that growth itself is expanding or shrinking. It turned negative because the baseline it is measured against was extreme. Prior-year growth rates were running two to three standard deviations above historical norms, so even a modest cooling registers as a dramatic deceleration in arithmetic terms.
That is the analytical distinction. Spending volume is still climbing. Spending velocity has rolled over.
The individual 2026 commitments show why the absolute figures remain so large:
- Amazon: $200 billion
- Microsoft: $190 billion, including an estimated $25 billion impact from higher memory and component prices
- Alphabet: $180-190 billion
- Meta: $125-145 billion
- Oracle: approximately $50 billion
Professionals already see the deceleration coming. Wall Street consensus embeds a sharp drop in cloud capex growth from one year to the next.
Cloud capex growth is expected to fall from 54% in 2025 to 19% in 2026, the most compressed expression of the deceleration thesis on the table.
The gap between a 92% spending increase and a -34.6% growth-rate contraction tells you the cycle has crossed from acceleration into deceleration. That single distinction separates investors reading momentum from those reading trajectory, and the ones anchored only to the dollar figures are effectively a quarter behind.
| Metric | 2025 level | 2026 level | Change |
|---|---|---|---|
| Cloud capex growth rate | 54% | 19% | Sharp deceleration |
| Capex share of operating cash flow | 60% | 90-100% | Efficiency squeeze |
| Hyperscaler quarterly capex (Q1) | Prior-year base | $129.8B | +80% YoY |
When big ASX news breaks, our subscribers know first
What the capex-to-cash-flow gap means for equity valuations
Equity markets have not caught up to any of this. The NASDAQ has been printing all-time highs and the S&P 500 has traded near record levels, even as corporate bond yields on AI-heavy balance sheets approach 8-9%. For context, the S&P 500’s historical 10-year compound annual growth rate is roughly 8%, meaning some of these companies are now borrowing at rates that rival the long-run return of the broad equity market.
S&P 500 tech concentration reached 37.5% of the index by mid-2026, exceeding the dot-com peak of roughly 34%, which means any multiple compression in mega-cap AI names now produces an outsized index-level decline relative to what historical drawdown patterns in a more diversified market would imply.
There are two honest ways to read current valuations, and both deserve a fair hearing.
- The priced-in view: The slower but still-high investment path is already embedded in prices. If AI revenues and margins track expectations, current levels hold, supported by genuine ongoing demand.
- The disconnected view: Balance-sheet risks and lagging depreciation charges are not yet reflected. If monetisation slips or overcapacity emerges, multiples face real downward pressure.
The disconnected view has a stronger structural anchor, and it does not rely on AI failing. It relies on accounting.
Analysts project a $600 billion cash shortfall between capital investments and expected cash generation for Microsoft, Alphabet, Amazon, and Meta through 2028, the single most compressed expression of balance-sheet risk in this cycle.
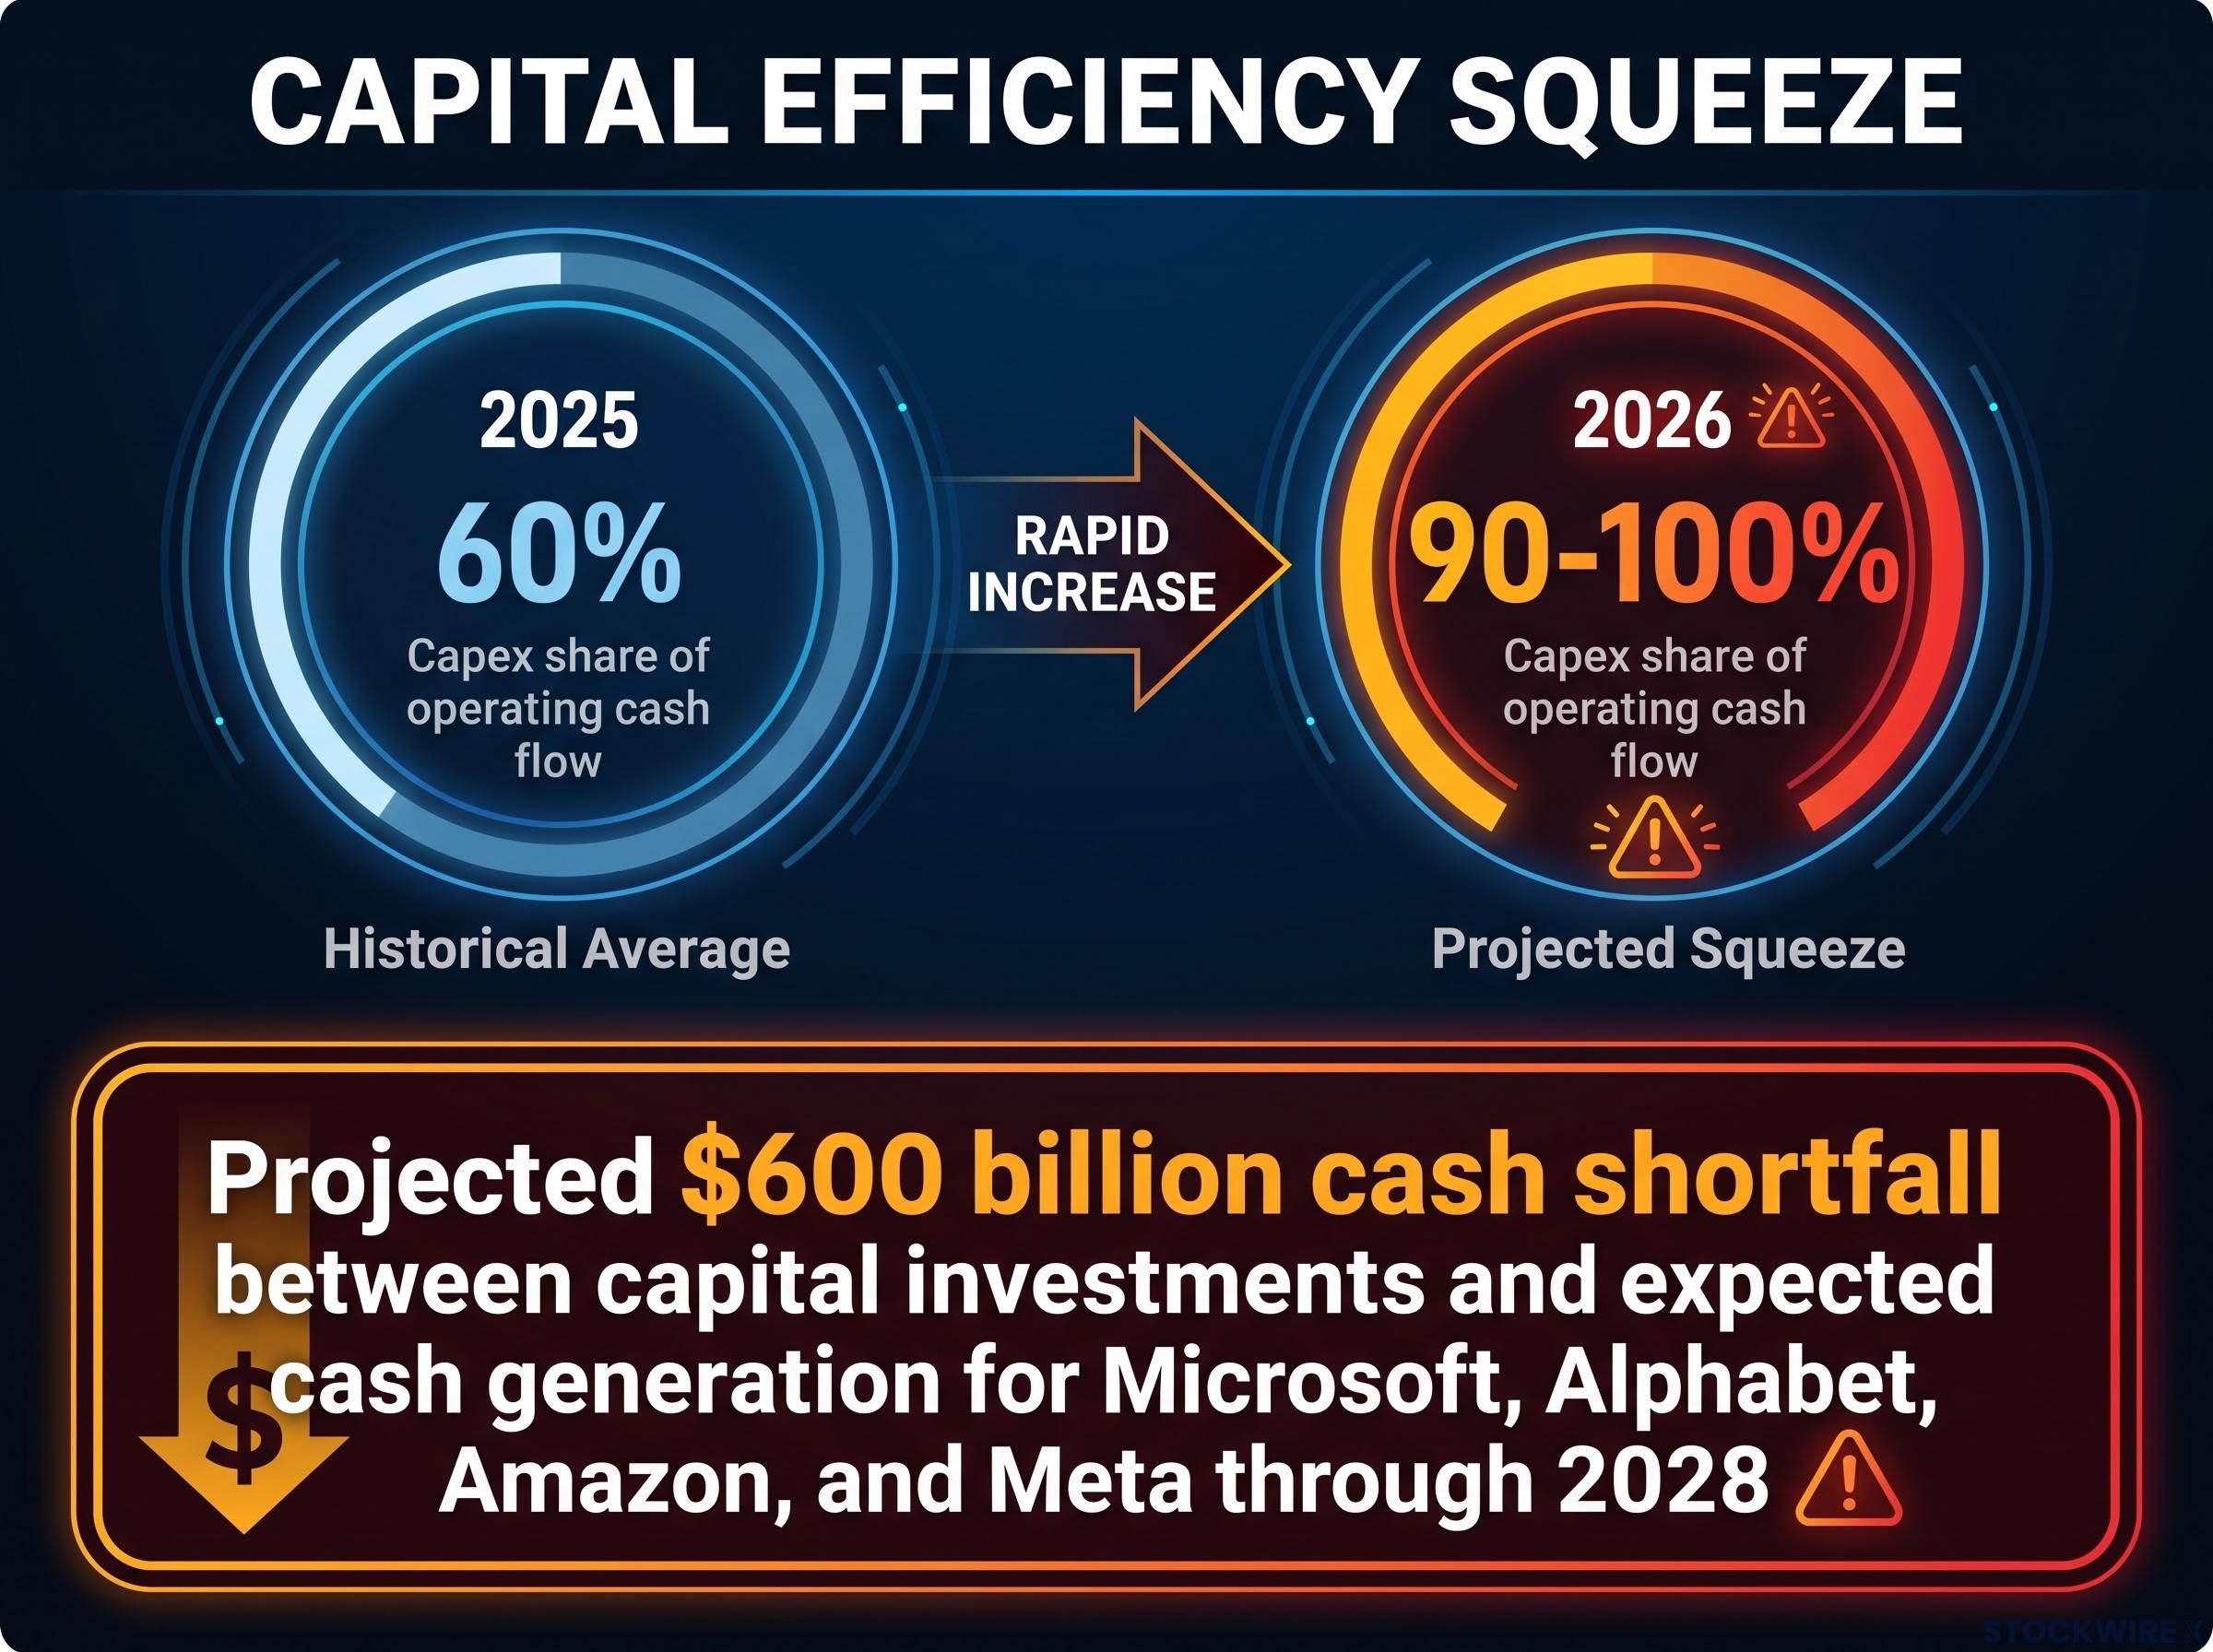
That gap means you are holding equities in companies that will have to borrow more, defer shareholder returns, or deliver AI monetisation at a pace no technology cycle in history has managed. None of that risk is currently visible in the multiples.
How the depreciation wall works and when it lands
Depreciation and amortisation, or D&A, is the accounting charge that spreads the cost of long-lived equipment across the years it is used. Infrastructure bought in 2025 and 2026 depreciates over a multi-year hardware cycle. That means peak D&A pressure arrives in the years following peak investment regardless of what revenue does.
Here is why the mechanism, not the metaphor, matters. Those future charges compress reported earnings whether or not monetisation succeeds. You do not need an AI bust to get downward earnings pressure. You just need the calendar to advance.
If monetisation underperforms or overcapacity emerges, the D&A pressure compounds against a revenue shortfall rather than a revenue upswing. Bloomberg Economics analysis suggests AI has accounted for more than 100% of nominal U.S. GDP growth in recent periods, and BofA Global Research projects hyperscaler capex rising from roughly $795 billion in 2026 to about $1.08 trillion in 2027. The scale of what is being depreciated is the scale of the eventual earnings drag.
Credit markets are already pricing what equities are not
If equities are watching the party, credit markets are watching the exits. The distress is visible to anyone looking at the right instruments and invisible to anyone watching only the index level.
The clearest current signal sits in triple-C rated bonds, the lowest tier of speculative-grade debt. The spread between triple-C yields and the federal funds rate has widened beyond 500 basis points, rising steadily since April 2026, with Moody’s flagging accumulating distress well beyond the small-business segment.
Triple-C spreads above 500 basis points show where risk is being priced, while roughly $8 trillion parked in money market funds shows where risk-off capital has already fled.
That triple-C level tells you the professional credit market is pricing a materially higher probability of default across a meaningful slice of corporate America than the S&P 500’s multiple implies. Historically, that kind of divergence resolves in one direction.
Small business bankruptcies are up approximately 64% year-over-year, the early-cycle expression of credit stress that has historically preceded broader corporate distress by two to four quarters.
The structural tension is a liquidity problem. Distressed companies need to refinance at lower rates to survive, but money market funds hold about $8 trillion yielding above 5%, creating a preference for safe cash that directly competes with demand for risk assets.
| Credit indicator | Current level | Significance |
|---|---|---|
| Triple-C bond spreads | Above 500 bps over fed funds | Rising default probability in weak borrowers |
| Small business bankruptcies | Up ~64% YoY | Early-cycle stress signal |
| Money market fund holdings | ~$8 trillion, yielding above 5% | Liquidity preference competing with risk assets |
| SoftBank junk bond yield | Above 10%, oversubscribed | Abnormal conditions, strong yield hunger |
Credit deterioration tends to follow a sequence:
- Spread widening leads, as pricing adjusts before defaults occur.
- Small business bankruptcies follow, hitting the most exposed borrowers first.
- Distressed debt exchanges delay but do not resolve restructuring, offering temporary relief.
- Formal bankruptcy eventually completes the cycle.
Amazon priced a $54 billion bond offering around 10 March 2026, front-running a large wave of corporate issuance. When the strongest names rush to lock in capital early, it tells you they expect conditions to tighten, not ease.
AI-related debt issuance in 2026 is estimated by Goldman Sachs at close to $500 billion for the year alone, and by July the Big Five hyperscalers had already surpassed twice their full-year 2025 bond total, a supply dynamic that is mechanically pushing Meta and Amazon spreads to levels below their official ratings.
How job displacement fear becomes an economic headwind in its own right
Suppose every valuation and credit concern above resolved cleanly. There would still be a second, independent drag on growth, and it runs through a different mechanism entirely: the consumer.
The public fear is grounded in evidence, not anxiety. Three registers of data make the point:
- Survey data: Pew Research surveys across developed nations found a majority of respondents more concerned about AI eliminating jobs than creating them.
- Empirical labour data: Bloomberg Economics analysis found unemployment rates tend to rise in sectors with greater exposure to AI disruption.
- Institutional long-run framing: The OECD and IMF argue AI will likely drive a net reallocation of tasks across occupations rather than wholesale job destruction.
Pew Research found a majority of people in developed nations are more worried about AI destroying jobs than creating them, the most accessible entry point into why sentiment has soured.
Macro consequences for GDP and consumption
The University of Michigan consumer sentiment index sits near record lows, driven by inflation concerns combined with job displacement fear. Treat that as a macroeconomic consequence, not just a polling result.
Consumer spending is a major share of U.S. GDP. When sentiment stays suppressed, spending softens, which means the AI investment boom is generating its own consumption drag. If you are pricing only the infrastructure upside, you are missing the demand-side risk that operates regardless of how the capex cycle resolves.
The earnings penalty from AI displacement compounds the sentiment problem: Goldman Sachs research tracking over 20,000 workers found that technology-displaced workers face a 3% larger real earnings loss at re-employment and a 10-percentage-point earnings growth gap that does not close for a full decade, providing a structural anchor for why the Michigan sentiment decline is unlikely to reverse quickly.
This is what makes the sentiment channel distinct. It is not correlated with the credit and valuation risks in a way that resolves them together. It is a parallel pressure that compounds even under a clean soft-landing scenario for credit.
The OECD and IMF long-run view is real: net task reallocation rather than mass job destruction. But for investors with a 2-3 year horizon, the transitional period is the relevant risk window, and transitions are where the pain concentrates.
What it would take to reverse the sentiment headwind
Economists identify two conditions for a genuine recovery in confidence: visible creation of new job categories from AI at real scale, or direct income transfers to households. Neither is currently in motion at the scale needed to move the Michigan index materially.
That absence is the important part. It makes the sentiment headwind structural rather than cyclical for the near-term investment horizon, which is precisely the horizon most readers are positioning around.
Where the cycle goes from here, and what to watch
Pull the four threads together. Capex velocity has rolled over, the depreciation wall is scheduled to land in the years ahead, credit markets are already pricing distress, and consumer sentiment is dragging on demand. As of September 2026, the AI cycle is past peak acceleration and entering a capital efficiency test, where monetisation must begin justifying the balance-sheet positions already taken.
There is no single day when this thesis resolves. But there are three observable variables that will move first if the cycle turns disorderly rather than productive.
- Hyperscaler free cash flow conversion: the first real monetisation signal.
- Triple-C spread direction: the credit early-warning indicator.
- University of Michigan sentiment trend: the real-economy transmission signal.
| Variable to watch | What it measures | Deteriorating signal |
|---|---|---|
| Hyperscaler FCF conversion | Whether AI spend is turning into cash | Cash flow falls further behind capex |
| Triple-C bond spreads | Credit stress in weak borrowers | Spreads widen beyond current levels |
| Michigan sentiment index | Household confidence and spending | Index falls further toward record lows |
BofA projects hyperscaler capex climbing to roughly $1.08 trillion in 2027, the year the depreciation wall from 2025-2026 spending begins compressing reported earnings.
Tracking these signals is more useful than waiting for an index repricing. The $600 billion cash gap through 2028 is the window within which monetisation must materialise, and higher borrowing costs are already forcing stricter internal ROI thresholds, evidence that capital discipline is tightening on its own.
Investors with 12-24 month horizons that are sensitive to the depreciation wall may have reason to trim technology exposure now. Those with 5-year-plus horizons who can absorb a transitional efficiency trough, if monetisation ultimately delivers, have a more defensible case for holding.
Market leadership rotation from US technology toward international developed markets offers one structural response to the depreciation-wall and cash-flow risks outlined here: valuation spreads between the S&P 500 IT sector and MSCI EAFE are near multi-decade extremes, and historical concentration episodes including the TMT bubble each saw the dominant cohort underperform the broad global market by 3-5 percentage points annually over the subsequent decade.
This article is for informational purposes only and should not be considered financial advice. Investors should conduct their own research and consult with financial professionals before making investment decisions. Past performance does not guarantee future results. Financial projections are subject to market conditions and various risk factors, and forward-looking scenarios are speculative and subject to change based on market developments.