
Four of the world’s most-traded currency pairs are doing something unusual at the same time. On the daily and weekly charts, the yen, the euro, the pound, and the yuan are all compressing, coiling inside patterns that professional analysts read as pressure building toward a decision. When one pair squeezes, that is a chart story. When four squeeze together, it is worth decoding.
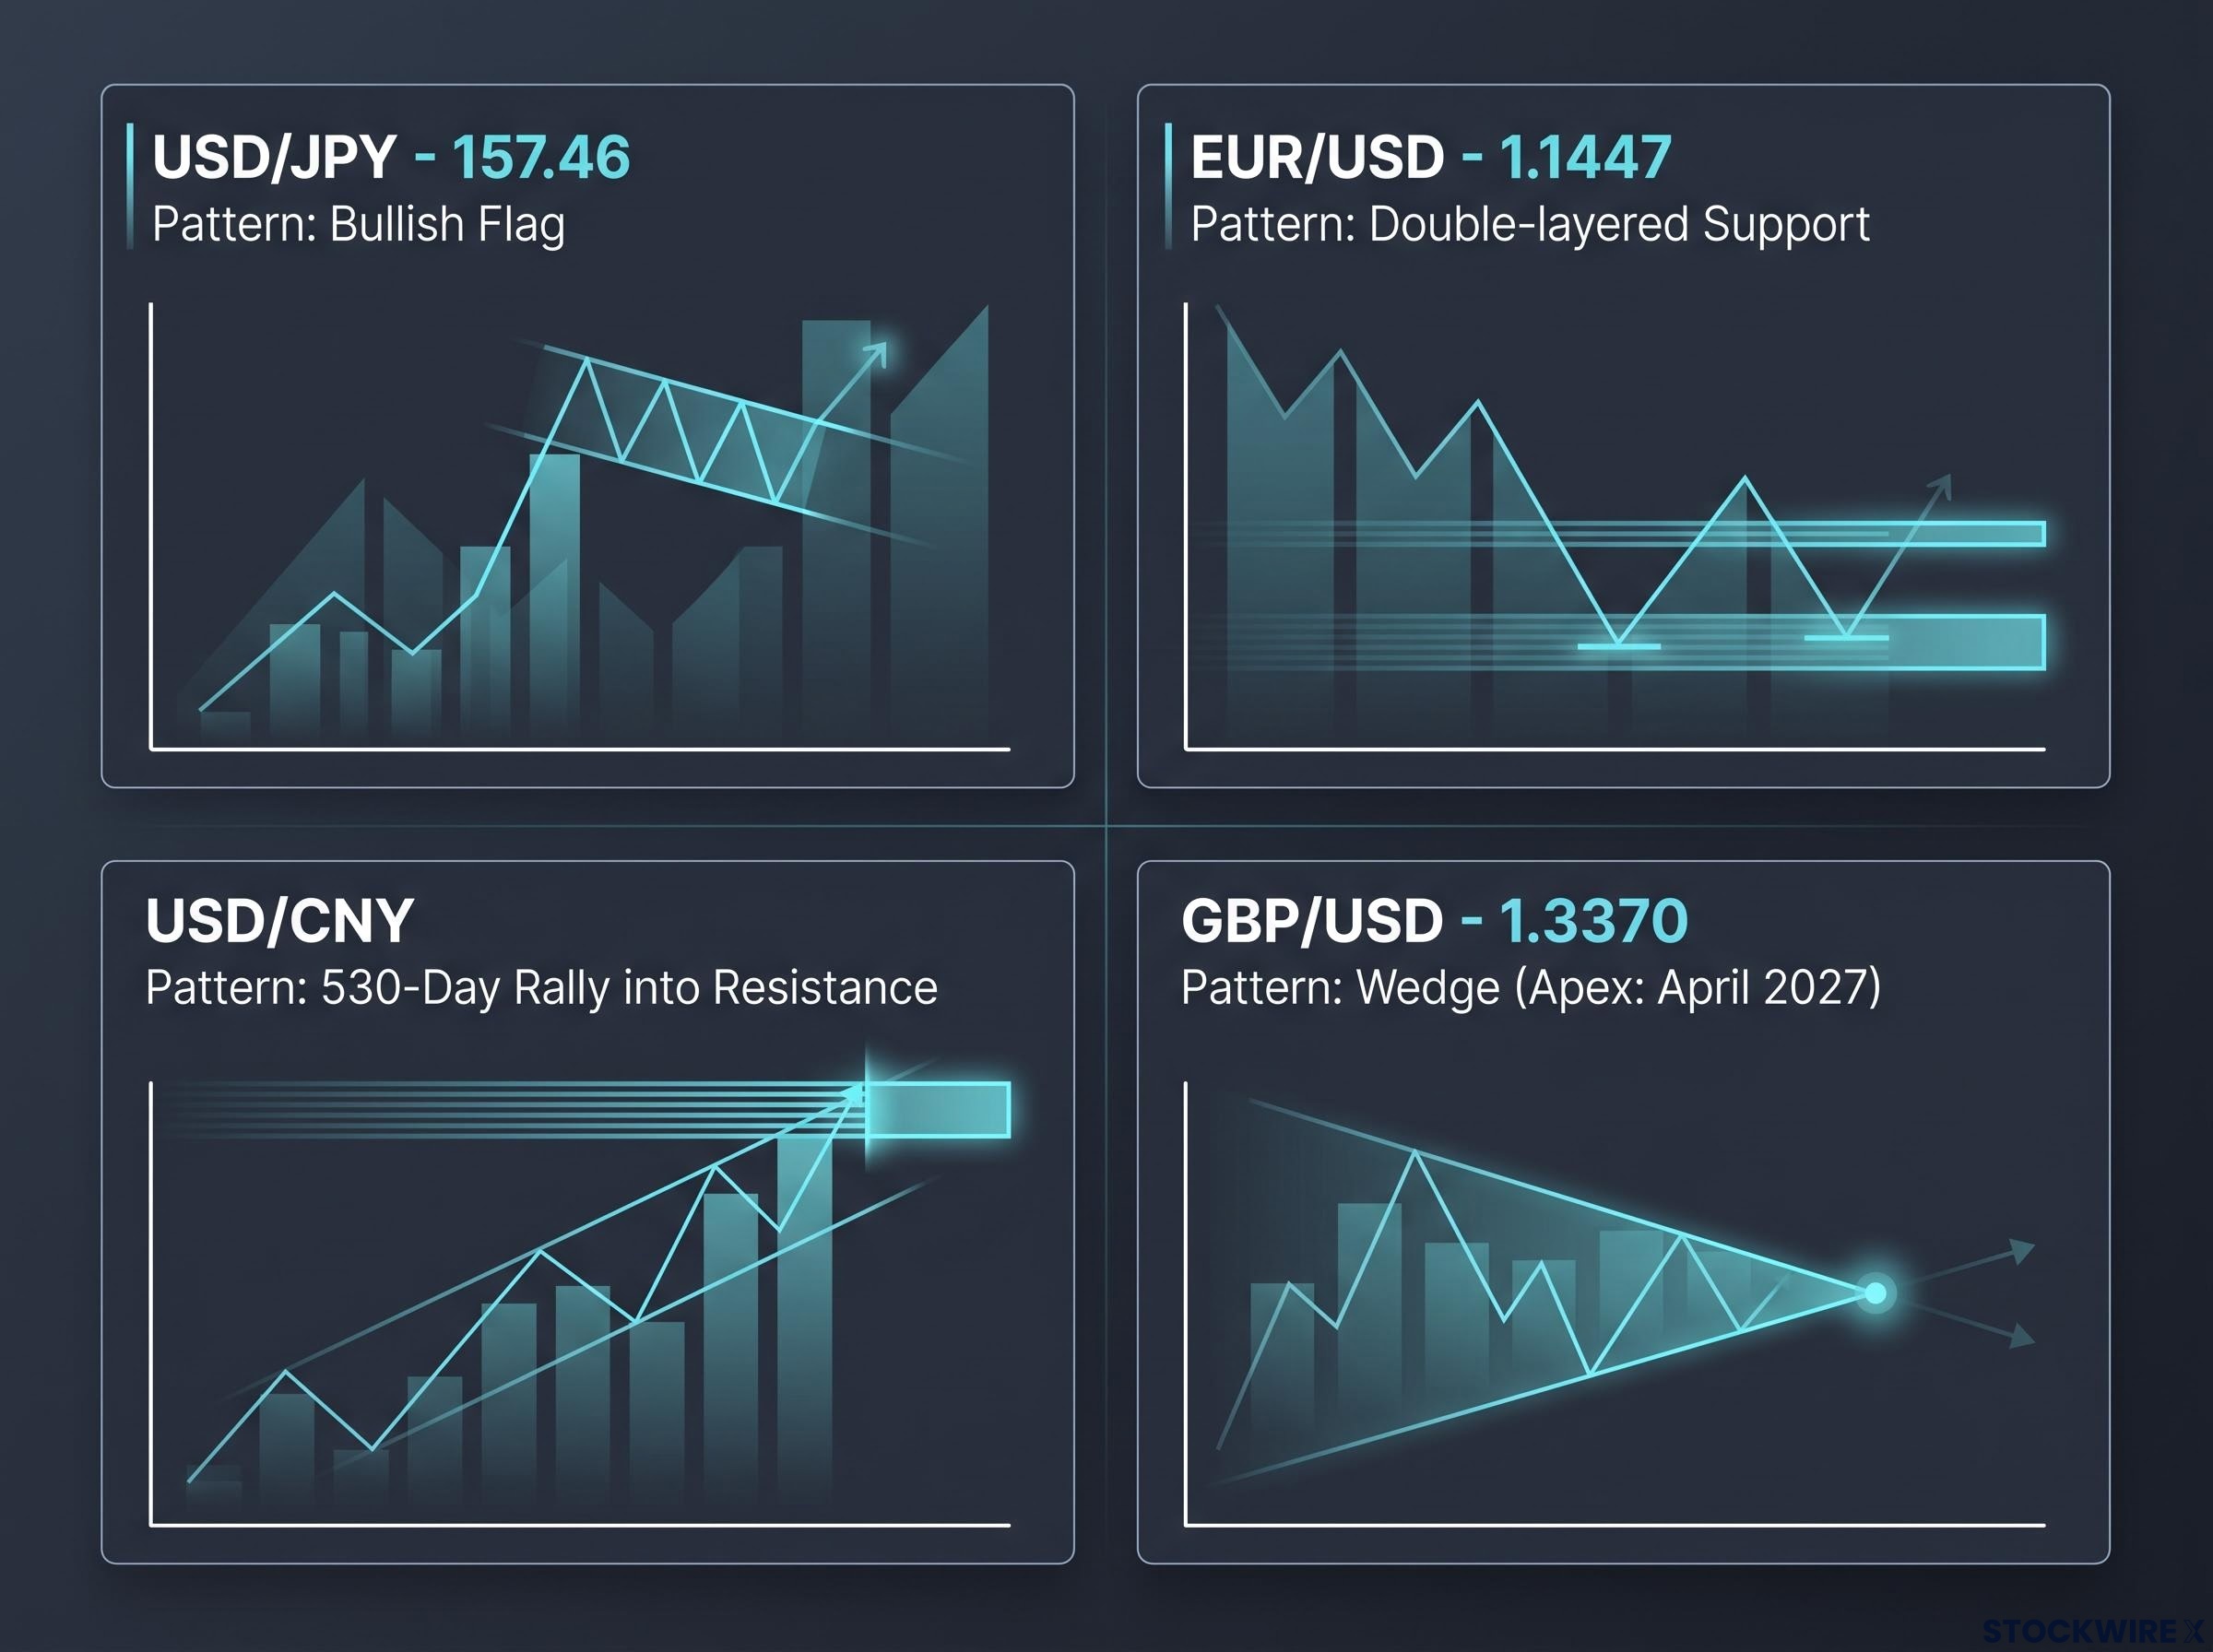
Analysts who watch foreign exchange for a living tend not to treat this as coincidence. They read simultaneous compression as evidence of shared macro pressure bearing down on every dollar pair at once. The setups are live and specific. The yen sits near actively managed levels around 157.46, the euro hovers over a double-layered support zone near 1.1447, the pound coils inside converging trendlines, and the yuan approaches a resistance barrier that has held for more than a decade.
This piece walks you through the exact pattern forming in each pair, why analysts believe these formations tend to resolve the way they do, and what the appearance of compression across four majors at once may be telling you about the broader dollar cycle. You will leave able to read these charts the way professionals do: as probabilities, not predictions.
Why multiple major currency pairs are compressing at the same time
When multiple dollar pairs form triangles, flags, and converging trendlines simultaneously, the cause usually sits above the charts, not inside them. Think of it as a waiting room. As markets approach a Federal Reserve policy inflection point, traders hold back, unwilling to commit until they get clearer direction on US yields and the growth gap between America, Europe, Japan, and China. That hesitation shows up on the charts as compression across the board.
There are three forces creating that shared holding pattern right now:
- The US dollar cycle. With the Fed perceived to be near its terminal rate, volatility subsides and dollar pairs coil while traders wait for the next definitive signal on the direction of US yields.
- Synchronised policy normalisation. The European Central Bank (ECB), Bank of England (BOE), and Bank of Japan (BOJ) are all edging toward normalisation while the Fed sits closer to the end of its cycle. Those cross-currents produce range-trading in EUR/USD and GBP/USD at the same time USD/JPY oscillates around perceived intervention levels.
- China’s managed-currency anchoring. The People’s Bank of China (PBoC) uses daily fixings and counter-cyclical tools to hold USD/CNY within policy bands, giving that pair a distinct flavour of compression that free-floating majors do not share.
Interest rate differentials between the ECB and the Fed are the dominant fundamental driver behind EUR/USD’s multi-month direction, which is why a single inflation print that misses consensus can move the pair more decisively than a fully priced-in rate decision.
That last point matters. USD/CNY is not compressing because traders are waiting; it is compressing because policy is holding it in place. Treating its pattern identically to the yen’s or the euro’s would be a mistake.
Here is what makes this moment genuinely uncertain: analysts read the same simultaneous compression two opposite ways.
Two competing interpretations of multi-pair compression
The late-cycle dollar peak thesis: Compression across four pairs is a topping signal. Converging support in EUR/USD and GBP/USD, plus capped upside in USD/JPY near intervention levels, are read as precursors to a broad dollar decline once the Fed definitively pivots.
The consolidation-before-continuation thesis: Compression is a mid-trend pause in a structurally resilient dollar environment. On this view, the breakout extends the prevailing dollar trend, and the patterns fail if macro conditions do not meaningfully change.
The takeaway for you is this. What looks like a chart story in each individual pair is really a macro story wearing technical clothing. Once you see that, a breakout in one pair becomes something you can check against the others. If the dollar is genuinely peaking, you should expect the yen, euro, and yuan patterns to corroborate each other. If they contradict, the signal in any single pair is weaker than it looks.
When big ASX news breaks, our subscribers know first
The core patterns forming across yen, euro, yuan, and pound right now
Each pair is telling its own version of the same story. Taken one at a time, the specifics reveal a market being pushed from several directions at once. The technical assessments below are drawn from analyst Nick Valdez of Verified Investing.
Asia-Pacific pairs
The yen, trading near 157.46, is forming a bullish flag on the daily chart. A bullish flag is a sharp rally (the flagpole) followed by a controlled, sideways drift (the flag), read as a pause before the move resumes higher for the dollar against the yen. Validity depends on two things: the flagpole should rise at an angle between 45 and 90 degrees, and the pullback should not retrace more than 50% of the flagpole. The current formation sits at the lower end of the angle range, near 45 degrees, and the retracement has approached or breached the 50% line. That does not kill the signal, but it does lower the conviction behind it, all while Japan maintains an active intervention posture.
The yuan is a different picture. It has been in a sustained upward move for roughly 530 days and is now approaching major resistance built from two layers: a pivot high from January 2023 and a descending trendline on the weekly chart running back to January 2014, roughly 12 years old and previously retested in February 2022. Valdez views the more probable near-term outcome as a pullback to the breakout origin before any further move higher, rather than an uninterrupted push through a barrier that has held for over a decade.
European pairs
The euro, near 1.1447, is sitting on a double-layered support zone. A former resistance level has flipped to support, and a converging trendline meets it at the same area. The read here is limited further downside, with some sideways action expected before an upward resolution becomes the more probable path.
The pound, near 1.3370, is compressing inside a rising support trendline and a mildly declining resistance trendline. The two converge toward an estimated apex around April 2027, giving roughly two years of runway, though a breakout is expected well before that. Crucially, the direction of that breakout has not been determined.
| Currency Pair | Current Level | Pattern Type | Key Parameters | Near-Term Directional Bias |
|---|---|---|---|---|
| USD/JPY | 157.46 | Bullish flag (daily) | Flagpole near 45 degrees; retracement at or past 50% threshold | Probable upward move, conviction reduced |
| EUR/USD | 1.1447 | Double-layered support | Flipped resistance plus converging trendline | Sideways, then upward resolution more probable |
| USD/CNY | At multi-decade resistance | Resistance test after 530-day rally | Jan 2023 pivot high plus 12-year descending trendline | Pullback to breakout origin more likely |
| GBP/USD | 1.3370 | Converging trendlines (wedge) | Apex projected around April 2027 | Large move imminent, direction undetermined |
The contrast is the point. The yen’s flag carries reduced conviction because its retracement is too deep, while the pound’s wedge carries no directional conviction at all. That tells you pattern quality, not just pattern presence, decides how much weight any single setup deserves.
What these patterns actually tell you, and what they cannot
A clean setup on the chart is a starting hypothesis, not a guarantee. The value in knowing these patterns is matched by knowing exactly where they break. FX charts fail in four recognisable ways:
- Event-risk overrides. A central-bank decision, a surprise data print, or a sudden intervention can invalidate a clean setup overnight, breaking a flag or triangle in the wrong direction.
- False breakouts and liquidity traps. Trendline and range breaks often pierce a level, trigger stops, and revert straight back into the prior range, especially in thin holiday or off-hours liquidity.
- Structural flows. Reserve-manager reallocation, corporate hedging, or sovereign intervention can create one-sided order books that cause patterns to fail entirely.
- Timeframe mismatch. A bullish flag on a 4-hour chart can directly contradict a bearish structure on the weekly. Reading one timeframe without the broader context produces misleading signals.
The yen offers a live illustration of the first failure mode. In late July and early August 2026, a well-formed flag was no defence against a coordinated policy move.
The intervention that overrode the chart
In late July and early August 2026, Japan and the United States conducted a rare joint yen-buying operation, Washington’s first yen-support action alongside Tokyo in more than a decade. Reuters reported Japan may have spent around US$36.58 billion, while the US Treasury sold euros to buy yen through the New York Fed. The yen rallied more than 1% to roughly 155.20 per dollar, from levels near a 40-year low around 164.
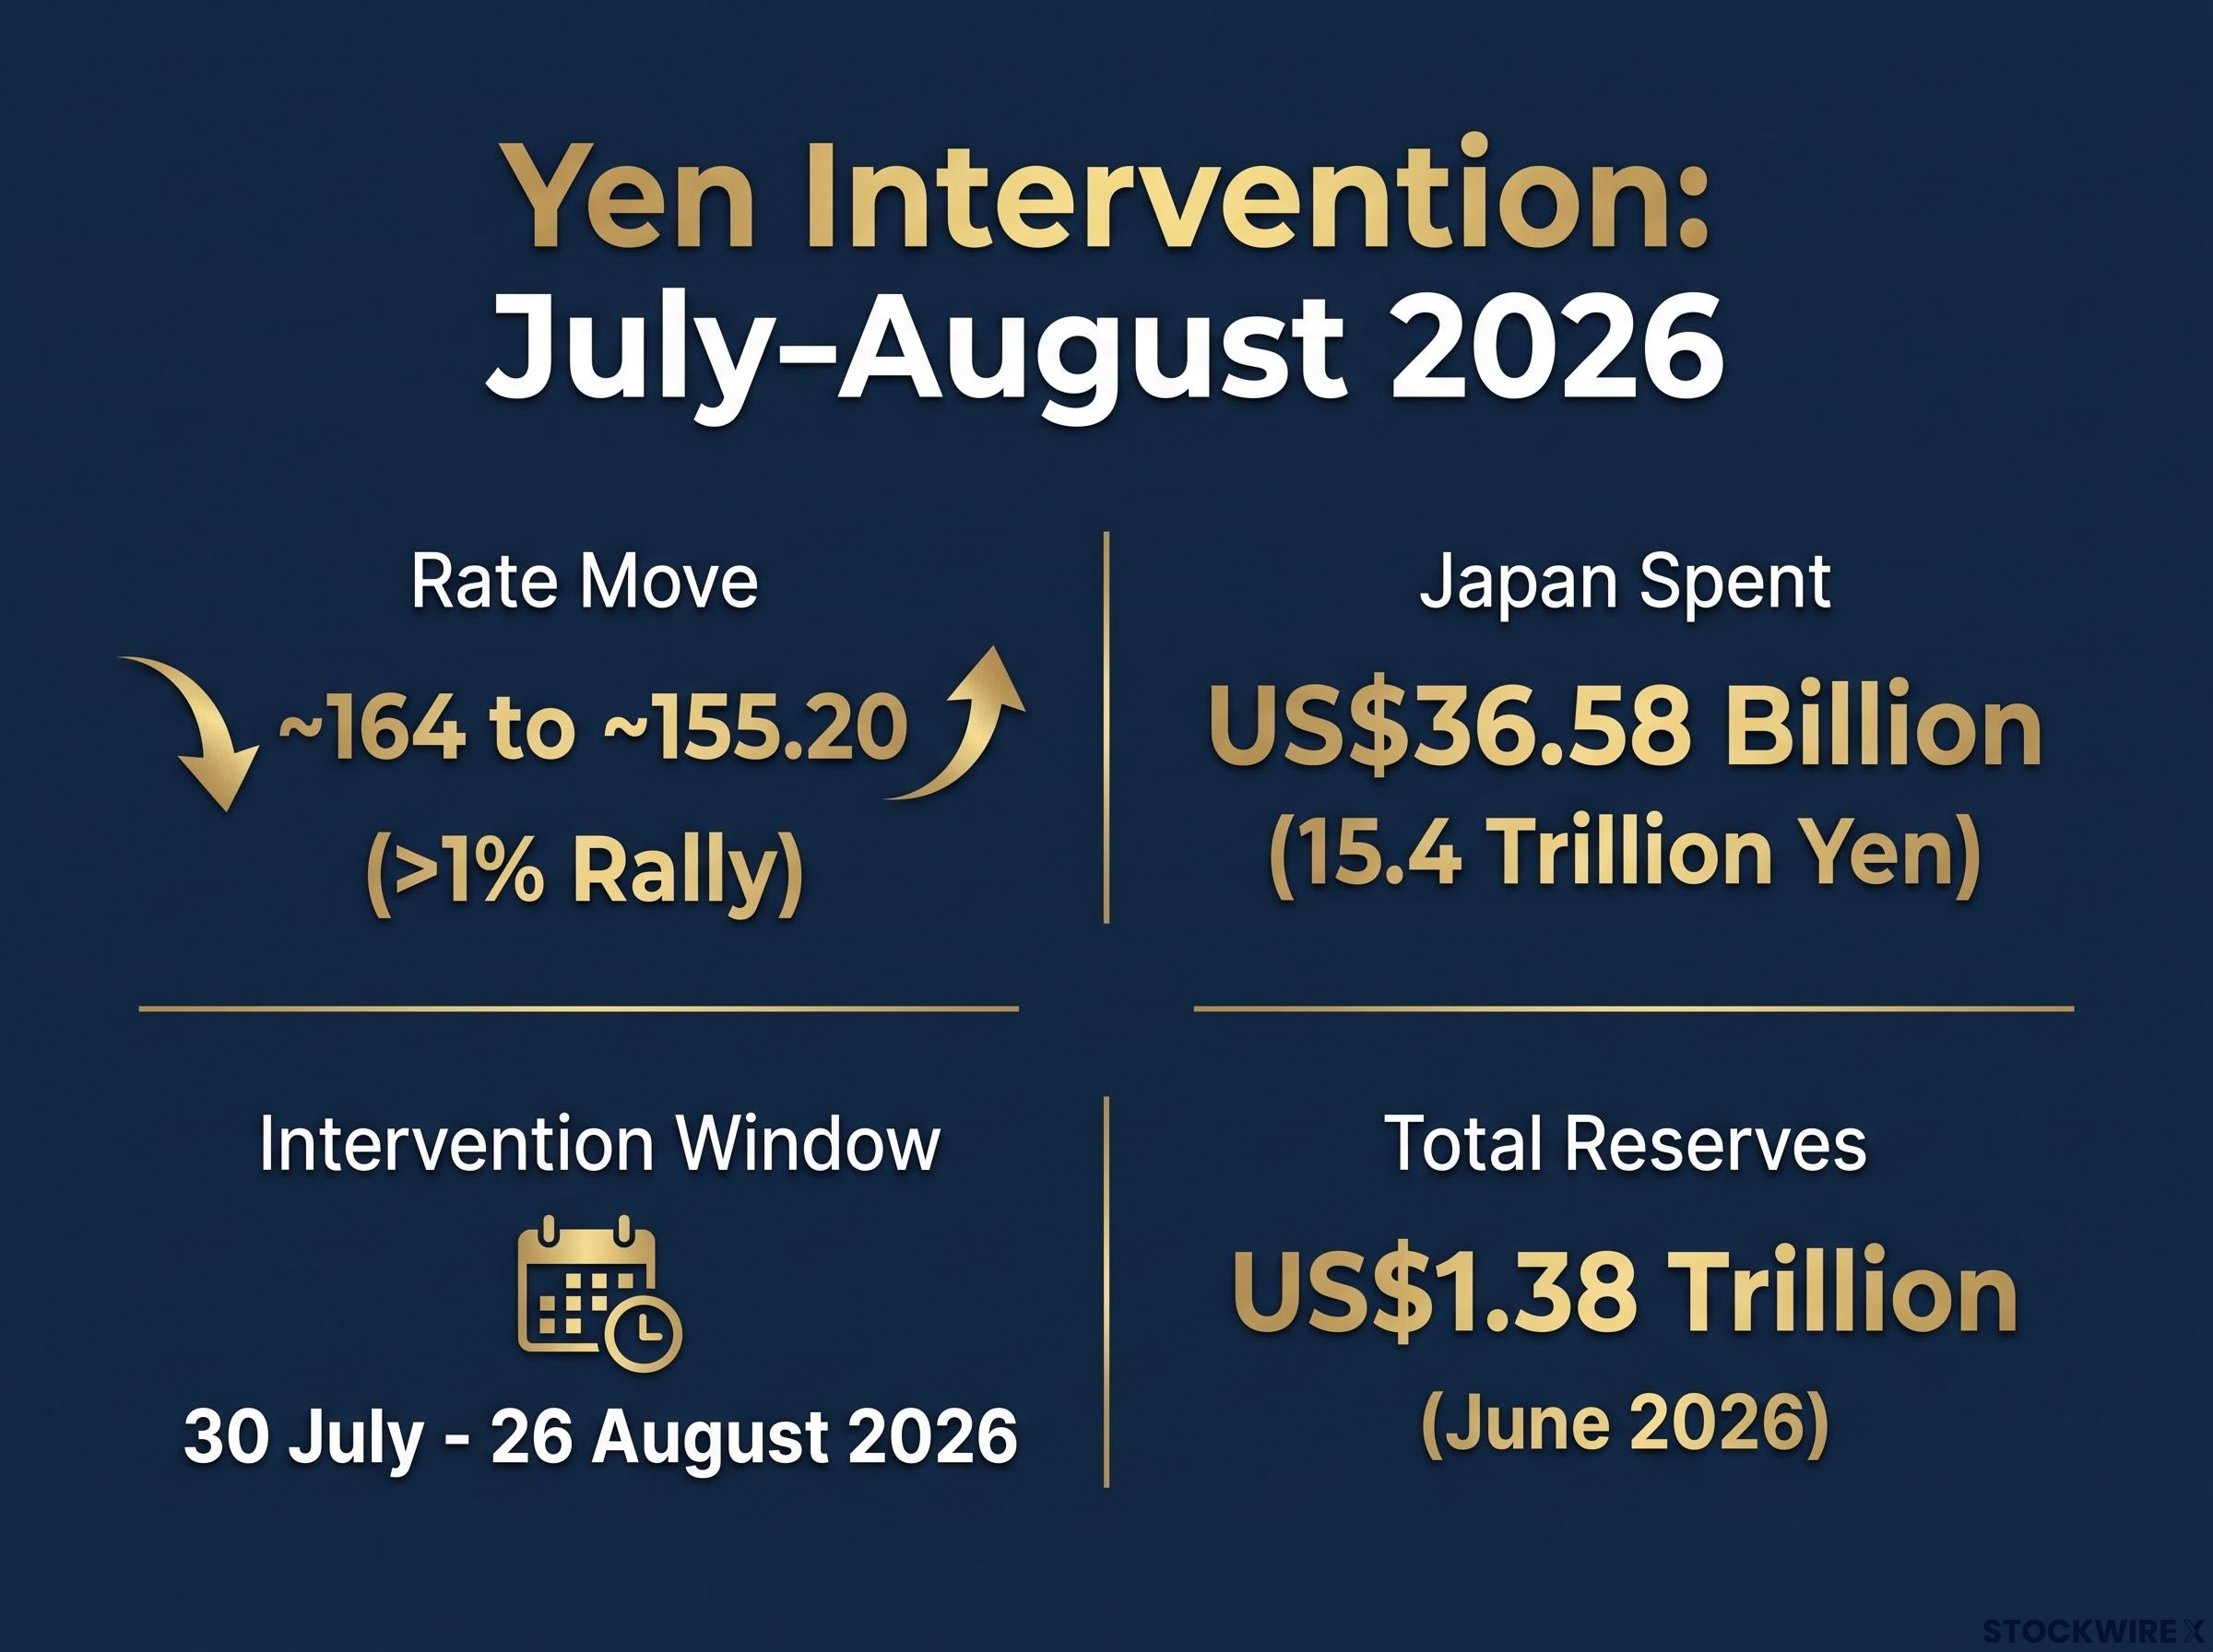
That single operation moved the market more than any chart pattern predicted, yet it did not reverse the primary trend. The yen stayed well below its prior 40-year low, which tells you intervention can shift the short term without breaking the direction. The scale confirms the point: Japan holds around US$1.38 trillion in total foreign-exchange reserves (Reuters, June 2026), and its 15.4 trillion yen in operations between 30 July and 26 August 2026 was described as the largest single-month intervention on record.
The coordinated yen intervention of August 2026 was structurally designed to avoid dollar or Treasury sales, because unilateral Japanese action would have flooded the US bond market with supply and pushed yields higher at a moment when Washington’s fiscal position was already under pressure.
Here is what this means for you. Even a technically valid pattern can be overridden by one policy decision, which means any directional bet built on a chart alone carries a risk that never appears on the chart. This is why institutional research treats patterns as probabilistic tools requiring corroboration from macro fundamentals, positioning data, and risk-management rules, never as standalone predictive devices. Knowing where patterns fail is what separates professional-grade analysis from pattern-matching.
The mechanics behind the patterns: a plain-language guide
You have seen the signals. Now for why each one tends to produce the outcome analysts expect. Understanding the mechanics, not just the shape, is what lets you judge whether a setup is high-conviction or borderline.
- Bullish flags: momentum pausing, not reversing. A sharp rally forms the flagpole, then price drifts sideways in a controlled, parallel channel. That drift reads as profit-taking rather than genuine selling pressure, which is why the pattern points to continuation. The yen’s flag fits this shape, with its flagpole near the lower end of the valid 45-90 degree range.
- Support-resistance flips: when sellers become buyers. When a price level that once acted as a ceiling breaks to the upside, the traders who sold at that level now have an incentive to buy on any return to it. The level’s function flips from resistance to support. That is exactly the setup under EUR/USD at 1.1447, where a former resistance line has become the floor.
- Wedge compression: energy building toward resolution. When a rising support line and a falling resistance line converge, each swing high and swing low is smaller than the last. The narrowing range reflects unresolved directional pressure with nowhere to go, and near the apex one side must give. GBP/USD is compressing exactly this way toward its projected April 2027 apex.
- Retracement thresholds: how deep is too deep. The 50% rule for bullish flags exists because a pullback deeper than half the flagpole stops looking like a pause and starts looking like a reversal. Once price gives back more than half its gain, the odds that the original bullish impulse resumes drop. This is precisely why the yen’s flag carries reduced conviction: its retracement has approached or breached that line.
One more mechanic explains why the yuan’s resistance deserves respect. Its 12-year descending trendline from January 2014 has now been touched three times: the original formation, the February 2022 retest, and the current approach. A trendline confirmed by multiple touches carries more analytical weight than one drawn from a single point, because more traders recognise it and act around it.
The practical payoff is that these concepts travel. Once you understand why a flag continues or a flip holds, you can apply the logic to any pair or timeframe you follow, rather than waiting for an analyst to name the pattern for you.
Professionals treat forex technical analysis as a conditional framework rather than a prediction tool, building scenario branches around SMAs, trendlines, and RSI readings that only become actionable when price confirms a defined trigger.
What coordinated chart patterns across four pairs may signal about the dollar
Read together, the four setups form a probabilistic verdict on the dollar, conditional on which macro scenario wins out. The yen’s flag points to dollar softening against the yen. The euro’s support confluence suggests limited further downside and an upward resolution, softening the dollar there too. The yuan is more likely to pull back before extending higher, a temporary dollar stabilisation before renewed yuan strength. The pound simply signals a large move coming, direction unknown.
| Currency Pair | Pattern Signal | Directional Bias | Key Watch Variable |
|---|---|---|---|
| USD/JPY | Bullish flag, reduced conviction | Dollar softer vs yen | Whether flag holds the 50% retracement; intervention risk |
| EUR/USD | Double support confluence | Dollar softer vs euro | Genuine bounce vs failed flip at 1.1447 |
| USD/CNY | Resistance test after 530-day rally | Temporary dollar stability, then yuan strength | Reaction at Jan 2023 pivot and 12-year trendline |
| GBP/USD | Wedge compression | Undetermined, large move imminent | Breakout direction from converging trendlines |
Now map that onto the two theses. If the late-cycle dollar peak view is right, the yen’s flag, the euro’s support, and the yuan’s resistance test all become corroborating evidence of a turning dollar. If the consolidation-before-continuation view is right, the same patterns are mid-trend pauses that resolve in the dollar’s favour.
To tell which is playing out, watch three things: the Federal Reserve’s next policy signal, whether USD/JPY’s flag holds the 50% retracement from here, and whether EUR/USD’s double support produces a real bounce or a failed flip. For the yen specifically, treat intervention as the live risk. Japan’s US$1.38 trillion in reserves and prior operations of 15.4 trillion yen in a single month mean the floor near extreme levels is actively managed.
The signals across four pairs do not tell you which way the dollar breaks. They tell you the dollar is at an inflection point where the next macro catalyst will be amplified by technical pressure that has accumulated across every major pair at once.
Reading charts without losing sight of what charts cannot see
The transferable insight is straightforward. Chart patterns in FX are probabilistic structures, not predictions, and their reliability depends on the macro regime around them. The compression across four pairs is not four separate stories; it is one shared question about the dollar cycle showing up on four charts.
That points to three orientations worth adopting:
- Treat pattern signals as conditional on macro corroboration. A flag or a flip is a hypothesis until the fundamentals and positioning data agree with it.
- Watch for multi-pair confirmation. A single setup is weaker than four pairs pointing the same way. Let the pairs check each other.
- Treat intervention as a distinct, off-chart risk. For managed pairs like USD/JPY and USD/CNY, policy can override a valid pattern overnight. Japan’s US$1.38 trillion reserve position makes that a quantifiable force, not a theoretical caveat.
Japan’s capacity to repeat large-scale operations is constrained by IMF episode limits tied to its free-floating classification, a credibility asset affecting sovereign borrowing costs that places a structural ceiling on how aggressively the Ministry of Finance can deploy reserves before drawing institutional scrutiny.
These patterns will resolve within a determinable window; the pound’s April 2027 trendline apex sets the outer boundary, though most will break far sooner. The resolution will matter precisely because it is happening across pairs at once rather than in isolation. For real decisions, the chart is where your analysis starts, not where it ends. These four setups are most useful as a framework for spotting when a macro event is about to force a resolution, not as standalone trade signals.
This article is for informational purposes only and should not be considered financial advice. Investors should conduct their own research and consult with financial professionals before making investment decisions. Past performance does not guarantee future results. Financial projections and technical assessments are subject to market conditions and various risk factors, and these statements are speculative and subject to change based on market developments.