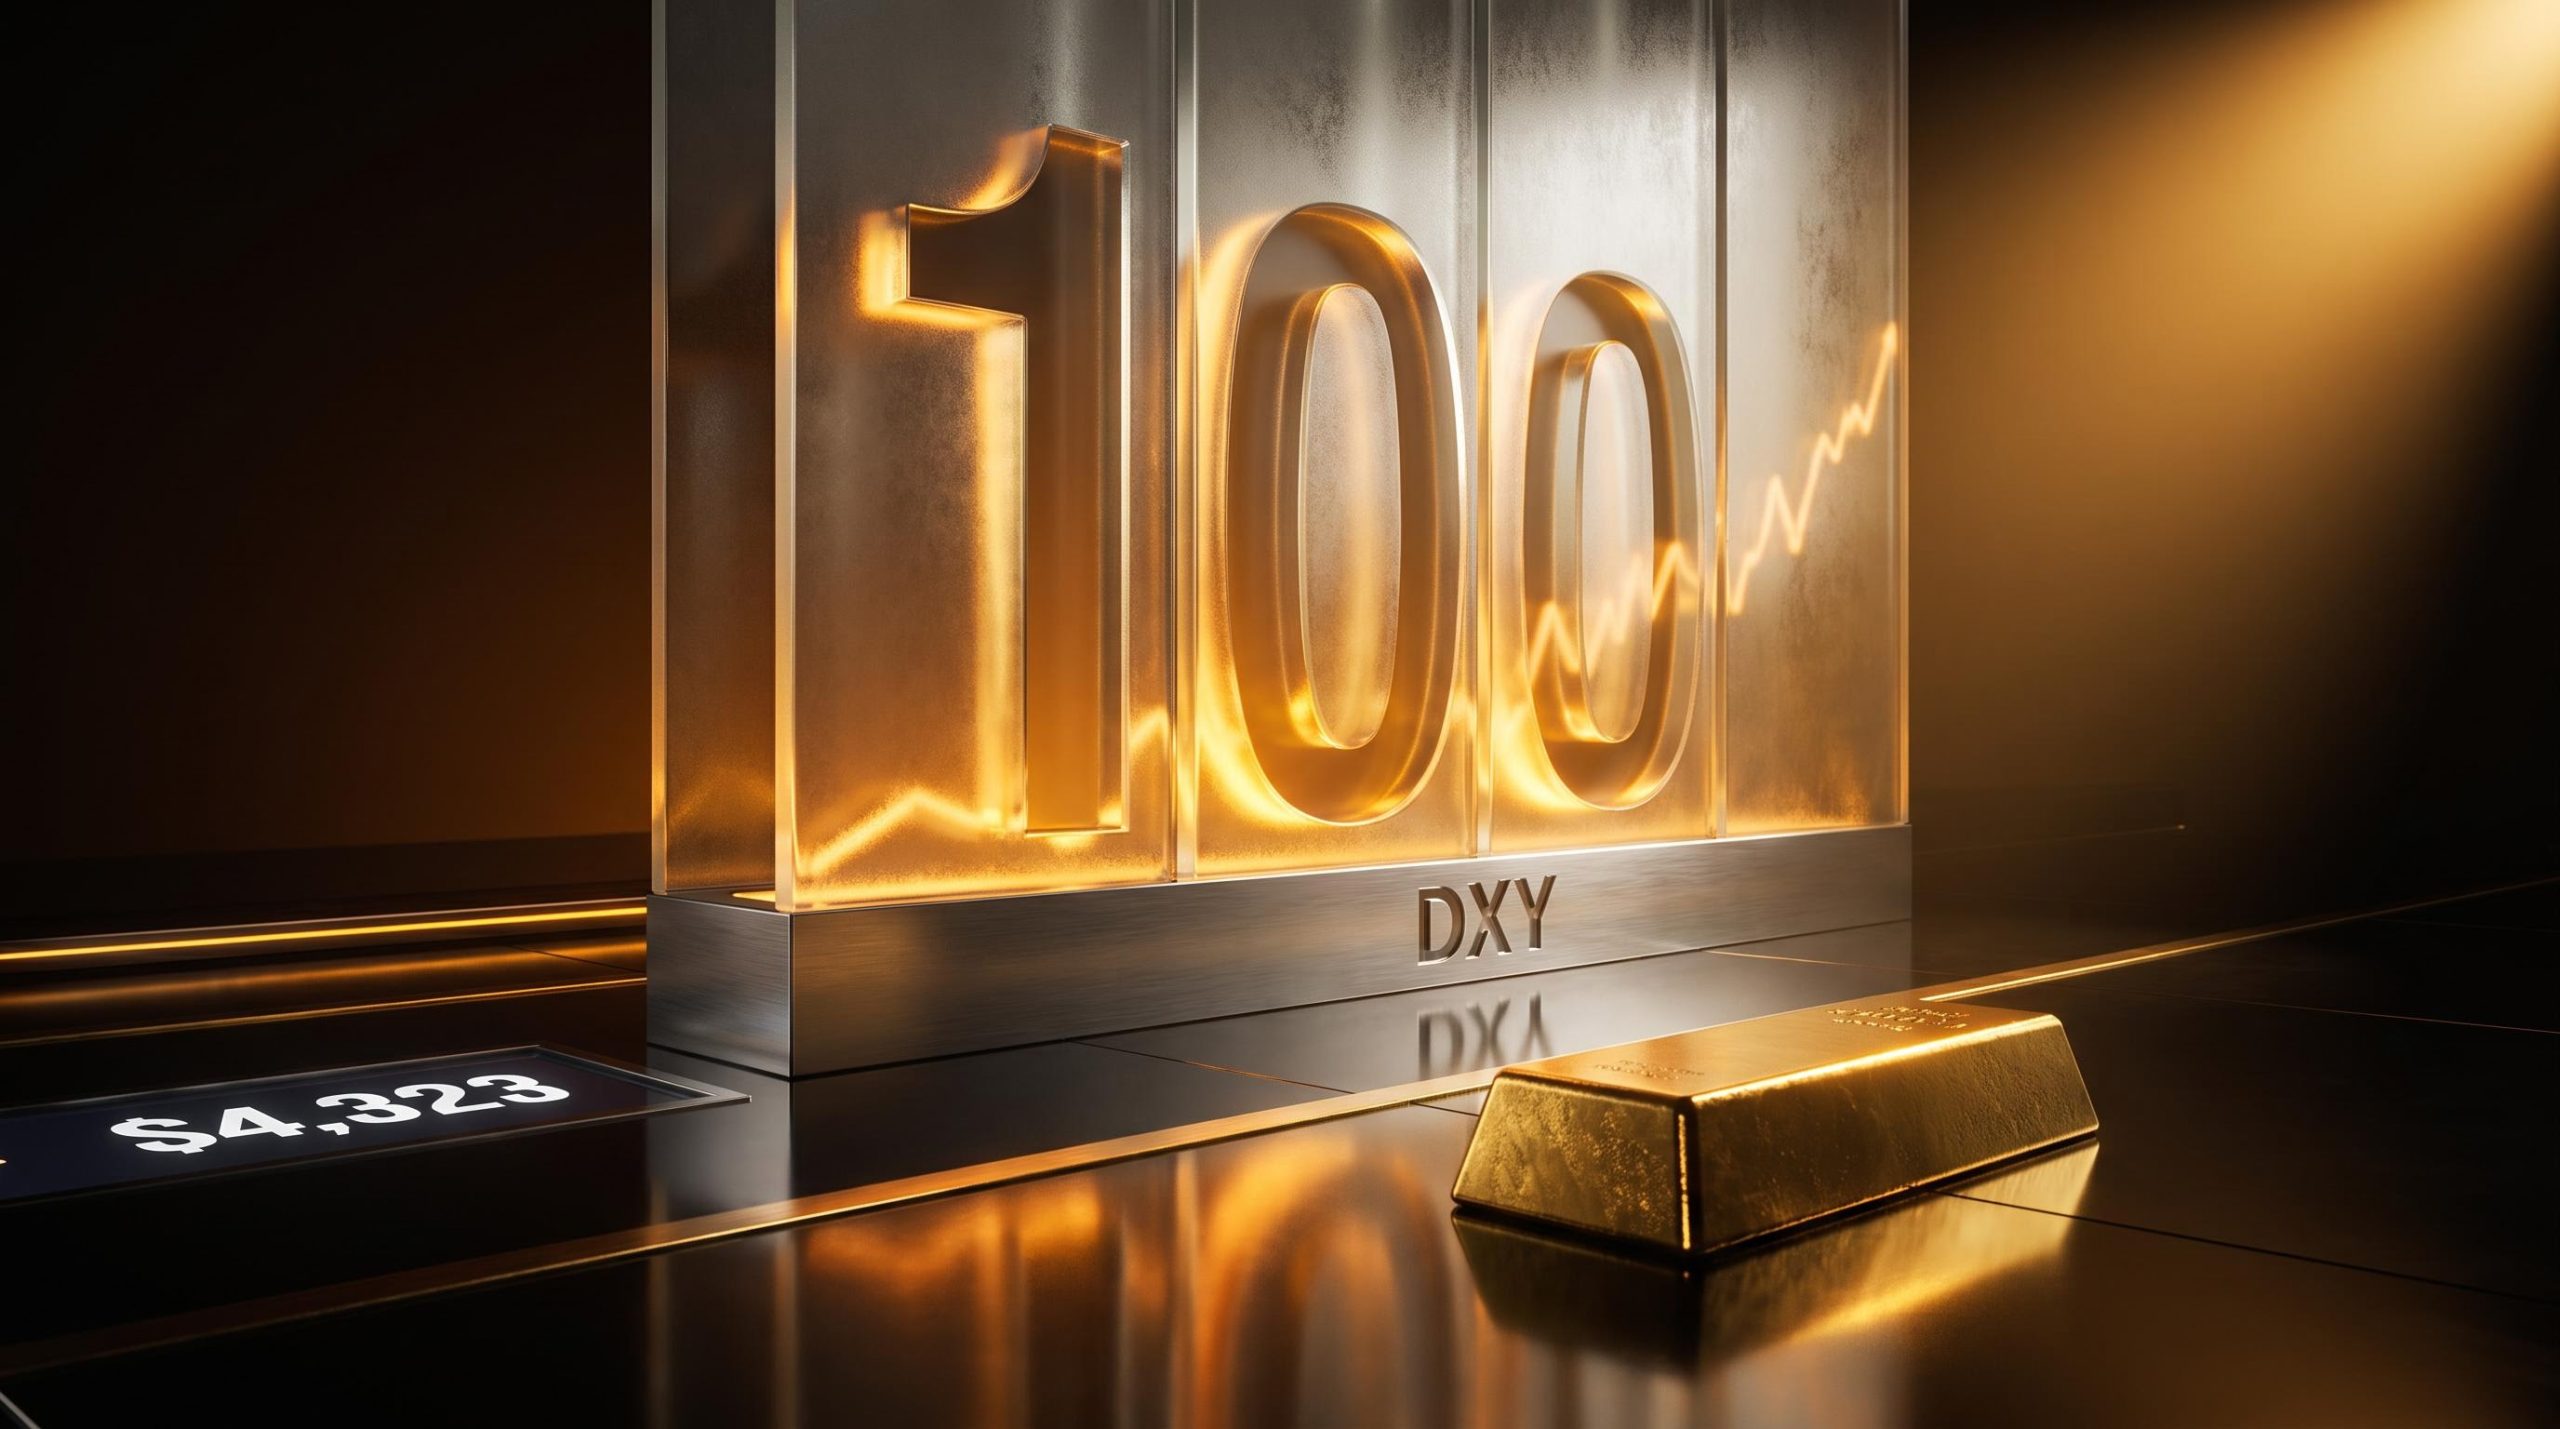
The US Dollar Index sits at 100, right at a wall it has failed to break since January 2025. And on 16 September, the Federal Reserve gave that wall a hard shove from behind.
Those two facts pull in opposite directions for anyone holding Bitcoin, gold, or oil. A dollar sitting at a two-year resistance level is the setup a reversal watcher waits for, the moment where the greenback might roll over and hand alternative assets a tailwind. A Fed that has just delivered a hawkish surprise is the opposite: policy momentum pointing to more dollar strength, not less.
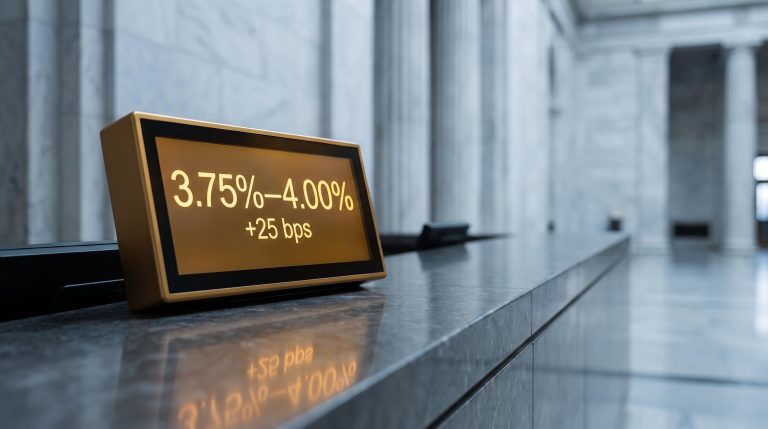
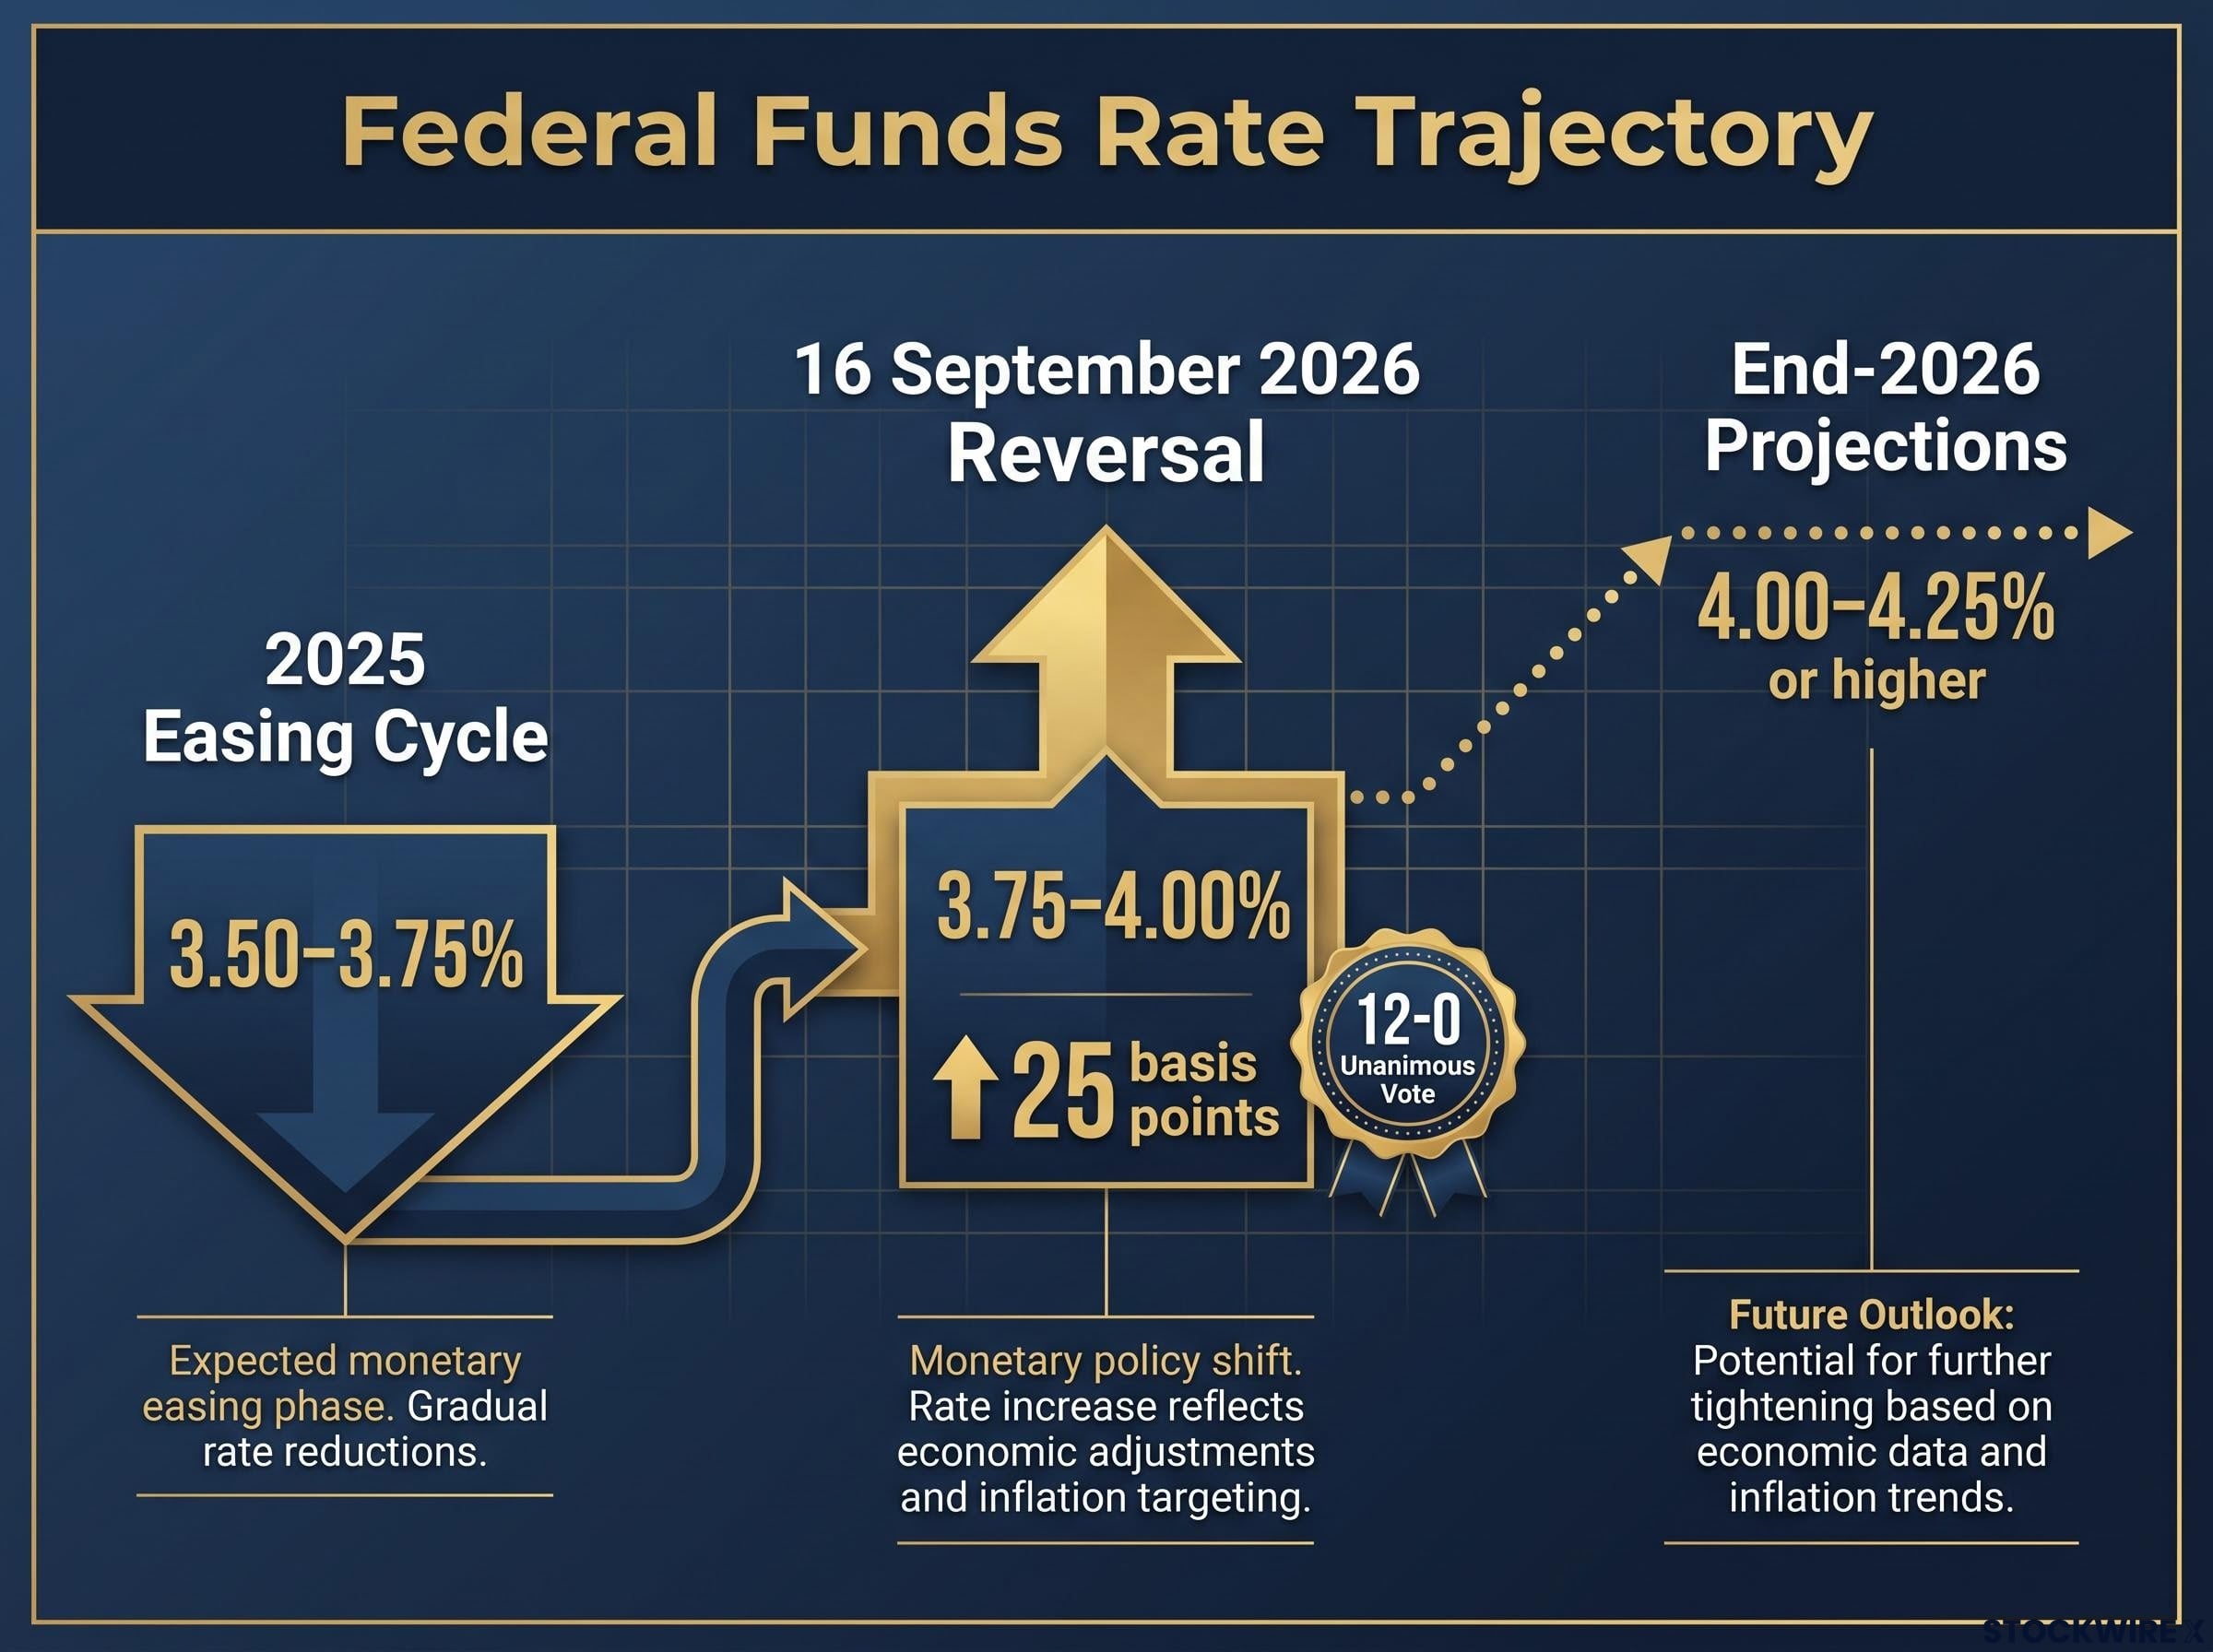
On 16 September 2026, the Federal Open Market Committee voted 12-0 to raise the federal funds rate by 25 basis points to 3.75-4.00%, reversing the easing cycle of 2025. Chair Kevin Warsh has signalled readiness for more hikes, pushing the DXY above 100 and into a resistance zone dating to January 2025. For US investors holding gold, Bitcoin, or crude, this is the crossroads.
Here is a working lens for thinking through what a dollar reversal, or continued strength, actually means for each of those assets, including where the tidy inverse-correlation story quietly falls apart.
What the September rate hike tells you about where the dollar goes next
Start with what makes this hike different from a routine policy tweak. The Fed spent 2025 cutting, delivering three rate reductions that brought the federal funds rate down to 3.50-3.75%. The September move does not extend a trend. It breaks one.
That distinction matters more than the 25 basis points themselves. A reversal signals the Fed believes the inflation problem it thought it had tamed has returned, and reversals of direction tend to have more durability than incremental moves along an established path.
The September reversal is not operating through a single lever: all three Fed policy tools are tightening simultaneously, with the federal funds rate climbing, the balance sheet still shrinking through quantitative tightening, and forward guidance anchoring rate expectations well above the 2025 easing baseline.
The vote was unanimous. All twelve FOMC members backed the increase, taking the target range to 3.75-4.00% effective 17 September 2026. The Fed’s Implementation Note confirmed the follow-through: the interest rate on reserve balances rose to 3.90% and the primary credit rate to 4.00%, both effective the same day.
The official statement framed the move as supporting a “timelier return” to the 2% inflation goal.
The Committee “decided to raise the target range for the federal funds rate by 1/4 percentage point to 3-3/4 to 4 percent.” FOMC statement, 16 September 2026
A single hike, even a unanimous one, does not by itself move the dollar for months. What sustains a currency trend is the market’s read on where rates are heading next.
From one hike to a sustained regime
Markets price forward guidance separately from the rate move in front of them, and this is where Warsh’s tone does the heavy lifting. Following his hawkish signal, markets began pricing several further quarter-point hikes through 2027, with end-2026 projections landing around 4.00-4.25% or higher depending on incoming data.
The rate differential mechanism turns that guidance into dollar strength. As US yields climb relative to other major economies, dollar-denominated assets become more attractive to hold, which sustains demand for the currency and keeps the DXY pinned above 100.
Three structural inflation drivers, highlighted by Reuters, give the “higher for longer” case a supply-side foundation rather than leaving it as rhetoric:
- US import tariffs feeding through to consumer prices
- An energy shock linked to conflict involving Iran
- Robust capital spending in artificial intelligence
The unanimity and the forward guidance together tell you that dollar strength here is not a one-day spike but a policy signal with duration. That means the resistance level the DXY is approaching is being tested from a position of macro momentum, which changes how you should weigh the odds of a break versus a rejection.
When big ASX news breaks, our subscribers know first
The DXY at 100: why this resistance level is not just a number
The DXY measures the dollar’s strength against a basket of major foreign currencies, so when it trades near 100, it is telling you something concrete about the dollar’s purchasing power relative to the euro, yen, pound, and the rest of that basket. Technicians and macro investors watch round-number levels like this because they tend to attract buying and selling clusters, which is exactly what turns them into resistance.
This particular level carries weight because of its history. TradingView reported the index at 100.221 on 18 September 2026, and through the following sessions it hovered in the 100.4-100.6 range on 22-23 September 2026.
That range sits directly beneath resistance that originated in January 2025, giving the level close to two years of technical significance.
| DXY reading | Date | What it signals |
|---|---|---|
| 100.221 | 18 September 2026 | Spot level, approaching the resistance zone from below |
| 100.4-100.6 | 22-23 September 2026 | Pressing directly into the two-year resistance band |
| Resistance origin | January 2025 | Roughly two years of failed breakouts give the level weight |
The setup breaks into two scenarios, and knowing which one is unfolding matters for every alternative asset you hold. If the DXY breaks above this resistance with conviction, dollar strength keeps compressing commodity and crypto valuations. If it fails here and reverses, a dollar-driven tailwind for Bitcoin, gold, silver, and oil becomes plausible.
A decline in the DXY from this resistance level is likely to drive price appreciation across Bitcoin, gold, silver, and oil. Nick Valdez, Verified Investing
For a US investor holding gold or Bitcoin right now, the DXY level is not background noise. It is the specific technical trigger that could decide whether those positions catch a macro tailwind or keep fighting a headwind over the coming weeks. Rather than tracking dozens of macro variables, you can treat the dollar’s behaviour at this resistance zone as a leading indicator for your alternative positions.
How dollar direction actually flows through to Bitcoin, gold, and oil
The core mechanism is simple enough to state in a sentence. When the dollar weakens, more dollar units are needed to buy the same quantity of any dollar-priced asset, which creates a direct valuation tailwind for gold, Bitcoin, silver, and oil. When the dollar strengthens, that same maths compresses their dollar value.
That is the clean version. The problem is that “weak dollar, buy gold and Bitcoin” treats four very different assets as one, and each responds to the dollar through a different filter.
The real-yield factor that most dollar-watching investors miss
Gold is the clearest example of why the tidy story misleads. Its dominant driver is not the nominal dollar level but real yields, which is the return an investor earns on Treasuries after stripping out inflation expectations.
Gold tends to rise when real yields fall, even if the dollar is strong, and tends to fall when real yields rise, even if the dollar weakens. The current environment makes this ambiguity live: rising nominal yields from the Fed’s hikes sit alongside persistent inflation, and the direction of gold depends on which of the two is moving faster.
The relationship between real yields and gold is the clearest example of why headline rate moves mislead: gold finished the 2022-2023 Fed hiking cycle higher than where it started because surging inflation kept real yields negative throughout, a dynamic that makes the current nominal hike-to-gold read far less straightforward than it first appears.
That is why an investor watching only the dollar can get gold wrong in both directions. Gold futures settled near $4,323-$4,357 per ounce in mid-to-late September, and where they go next hinges as much on real yields as on the DXY.
Bitcoin follows a different logic entirely. Crypto-specific forces frequently override macro dollar direction, and Bitcoin has decoupled from the dollar repeatedly, rallying in strong-dollar periods and falling in weak-dollar ones. Three factors tend to dominate:
- Regulation and policy shifts specific to digital assets
- Leverage cycles that amplify moves in both directions
- Speculative positioning and broader liquidity conditions
Valdez notes that Bitcoin is emerging from a bear market cycle, which he argues makes a dollar-driven increase more probable if dollar weakness materialises. Spot Bitcoin traded around $86,200-$86,600 on 21-23 September 2026, though that figure comes from aggregated data feeds and should be treated with more caution than the gold reference.
Oil has its own overrides. Supply and demand imbalances plus geopolitical shocks can swamp dollar direction, and the current Iran-linked energy shock is a textbook case of exactly that, driving WTI crude into the $90-$96 range with a settlement near $95.78 on 21 September 2026, independent of what the dollar is doing.
| Asset | Primary dollar sensitivity | Dominant competing driver |
|---|---|---|
| Bitcoin | Real but unreliable | Regulation, leverage, speculative flows |
| Gold | Indirect | Real yields (nominal yields minus inflation) |
| Oil | Weak | Supply-demand and geopolitical shocks |
| Silver | Moderate | Industrial demand and real yields |
The asset-by-asset picture tells you that “buy gold and Bitcoin if the dollar falls” is a starting point, not a strategy. Whether each position actually rewards you depends on whether real yields, leverage cycles, or supply shocks happen to be pulling in the same direction as the dollar, or the opposite one.
When does the inverse correlation break, and what historical patterns show
History is full of moments when the dollar and dollar-priced assets moved together instead of apart, and those episodes are useful less as predictions than as tools for asking sharper questions about now.
Take the dollar rally from mid-2014 into early 2016. It coincided with steep declines across commodities, including oil and industrial metals, which shows how tighter dollar liquidity and higher US yields can compress dollar-priced assets even when the underlying demand for them is still present.
What followed complicates the simple story further. The eventual recovery in commodities and gold did not arrive because the dollar reversed sharply. It arrived because global growth expectations shifted, which underscores that the macro regime, meaning growth, inflation, and risk sentiment together, usually dominates over dollar direction on its own.
Bitcoin makes the point even more bluntly. It has rallied during dollar strength and during dollar weakness across multiple cycles, depending on speculative positioning and liquidity rather than the currency’s direction. That is why the bear-market-cycle context Valdez cites matters more for Bitcoin’s path than the dollar correlation on its own.
Bitcoin as a debasement hedge has a compelling theoretical foundation in its fixed 21-million supply cap, but the empirical record complicates the thesis: the asset lost roughly 77% of its value during the highest US inflation in four decades in 2022, while peer-reviewed cross-country studies published in 2026 found no consistent correlation between Bitcoin returns and CPI across advanced economies.
The current setup is precisely the kind of moment where old correlations wobble. The Fed is actively redefining the macro regime through its hawkish reversal, so the relationships that held during the 2025 easing cycle may not carry over cleanly.
The more useful question is what would drive any dollar reversal, because the catalyst shapes the outcome:
- A Fed pivot back to easing, which would tend to support gold and Bitcoin as liquidity loosens.
- US growth deterioration, which could lift gold as a haven while pressuring oil on weaker demand.
- A global risk-sentiment shift, which produces mixed and asset-specific outcomes rather than a uniform lift.
The macro regime and sector-specific drivers typically matter more than the dollar’s direction alone. Research framework synthesis
For a US investor weighing whether to add Bitcoin or gold on a dollar-reversal thesis, the historical record says the answer depends less on the dollar’s direction and more on what is behind any move. Policy easing, growth weakness, and a risk shift each produce materially different results for the same asset.
What three macro variables to watch before repositioning around a dollar move
You do not need to predict the dollar to position around it intelligently. You need to watch the right signals in the right order over the coming weeks.
Three stand out as the most actionable for a US investor tracking this resistance zone:
- Incoming US inflation data. A hot CPI or PCE print confirms Warsh’s hawkish case and supports the dollar; a soft one undermines it and opens the door to a reversal.
- The DXY’s behaviour at the January 2025 resistance level. A confirmed break above 100.4-100.6 signals continued strength, while a clean rejection points to the reversal scenario.
- Real yield direction in the Treasury market. This is the most direct driver of gold’s near-term path, and it can move independently of the nominal dollar.
The Warsh factor sharpens the first signal in particular. Because he has stated an explicit willingness to hike further if inflation demands it, and has emphasised the Fed’s independence, any surprise in inflation data becomes a direct dollar catalyst rather than a mere shift in rate expectations. End-2026 projections of 4.00-4.25% or higher are contingent on exactly that data.
Inflation data composition matters as much as the headline number in this environment: the August 2026 core CPI beat was driven by a 5.9% airline fares spike tied to fuel costs, not tariff pass-through, which produced a very different signal for Fed rate expectations than a broad-based goods inflation print would have.
The Iran energy shock as a two-channel variable
Oil deserves separate treatment because its current level is not a dollar story. WTI crude in the $90-$96 range is being driven by a supply-side shock tied to conflict involving Iran, not by any softness in the dollar.
That shock runs through two channels at once, and treating them separately is a mistake. It lifts crude directly, and it feeds into inflation data, which then feeds into Fed rate expectations and back into the dollar.
Watching these variables in sequence, inflation data first, then the DXY at resistance, then real yields, gives you a more reliable basis for repositioning than waiting for the dollar to move and reacting after the fact.
Reading the dollar setup without getting ahead of it
The tension at the centre of this setup does not resolve neatly, and that is the point. The DXY sits at a historically significant resistance level while the macro backdrop, Fed hawkishness, persistent inflation, and Warsh’s forward guidance, supports continued strength. Both a breakout and a reversal are technically plausible, so certainty should be sized accordingly.
The reversal thesis has genuine merit: a two-year resistance level, historical precedent for dollar rollovers, and the potential for safe-haven rotation. But merit is not confirmation, and repositioning gold near $4,323-$4,357, Bitcoin near $86,200-$86,600, or crude in the $90-$96 range on an unconfirmed thesis is getting ahead of the evidence.
The direction of any dollar move matters less than the catalyst behind it. Identify the catalyst before adjusting exposure.
For a US investor reading this in late September 2026, the takeaway is not to act on the resistance level alone. Treat the DXY’s resolution of this zone, alongside incoming inflation data, as the signal that determines whether Bitcoin, gold, and oil catch a tailwind or keep facing pressure.
This article is for informational purposes only and should not be considered financial advice. Investors should conduct their own research and consult with financial professionals before making investment decisions. Past performance does not guarantee future results. Financial projections are subject to market conditions and various risk factors, and forward-looking statements are speculative and subject to change based on market developments.