A fund that millions of Americans hold as a safe income investment is now worth less than half its peak value, even after counting every dividend payment it ever made.
That fund is the iShares 20+ Year Treasury Bond ETF, better known as TLT. According to analyst Tim Knight, whose total-return analysis factors in all historical distributions, the fund has spent roughly seven years in a bear market and currently trades at slightly more than half its all-time high.
This did not happen quietly or overnight. It unfolded in plain sight, over years, driven by a mechanical relationship between interest rates and bond prices that most retail investors never learned. And that force has not gone away. As of 21-22 September 2026, 30-year Treasury yields sit near 5.3% and 10-year yields near 4.9%, levels not seen since before the 2008 financial crisis.
Understanding the interest rate risk in bond ETFs is not abstract theory. For anyone holding fixed income, it may already be reshaping their account balance. Here is what the last seven years in the bond market actually teach you about the money you have in fixed income.
Why bond ETFs lost so much value when interest rates rose
You were probably told bonds are the safe part of a portfolio. The steady, boring, defensive holding that protects you when stocks fall. For decades, that assumption held well enough that most investors never questioned it.
The problem is that the assumption skips over how bonds are actually priced. There is a fixed, inverse relationship between the value of a bond and the level of interest rates. When rates go up, existing bonds become worth less. When rates go down, existing bonds become worth more.
The logic is simple once you see it. A bond you bought paying 2% looks unattractive the moment new bonds are issued paying 5%. Nobody wants your low-paying bond at full price, so its market value falls until the yield it offers matches what is available elsewhere.
That relationship is not a market quirk or a temporary glitch. It is arithmetic, and it applies every single day.
Now look at what happened to rates. Long-term Treasury yields sat around 1-2% during 2020-2021, according to Federal Reserve H.15 and FRED data. Today they are near 5%. That is a move of roughly three percentage points.
Here is the current snapshot against the peak era, side by side:
2020-2021 (TLT’s peak):
- 10-year Treasury yield: approximately 1-2%
- 30-year Treasury yield: approximately 1-2%
September 2026:
- 10-year Treasury yield: approximately 4.93-4.96%
- 30-year Treasury yield: approximately 5.27-5.30%
When rates roughly tripled, the price damage to long-dated bonds was not bad luck. It was the direct, predictable output of the inverse relationship acting on bonds with a very long life. TLT holds Treasuries maturing in 20 years or more, which is exactly why it took the full force of the move.
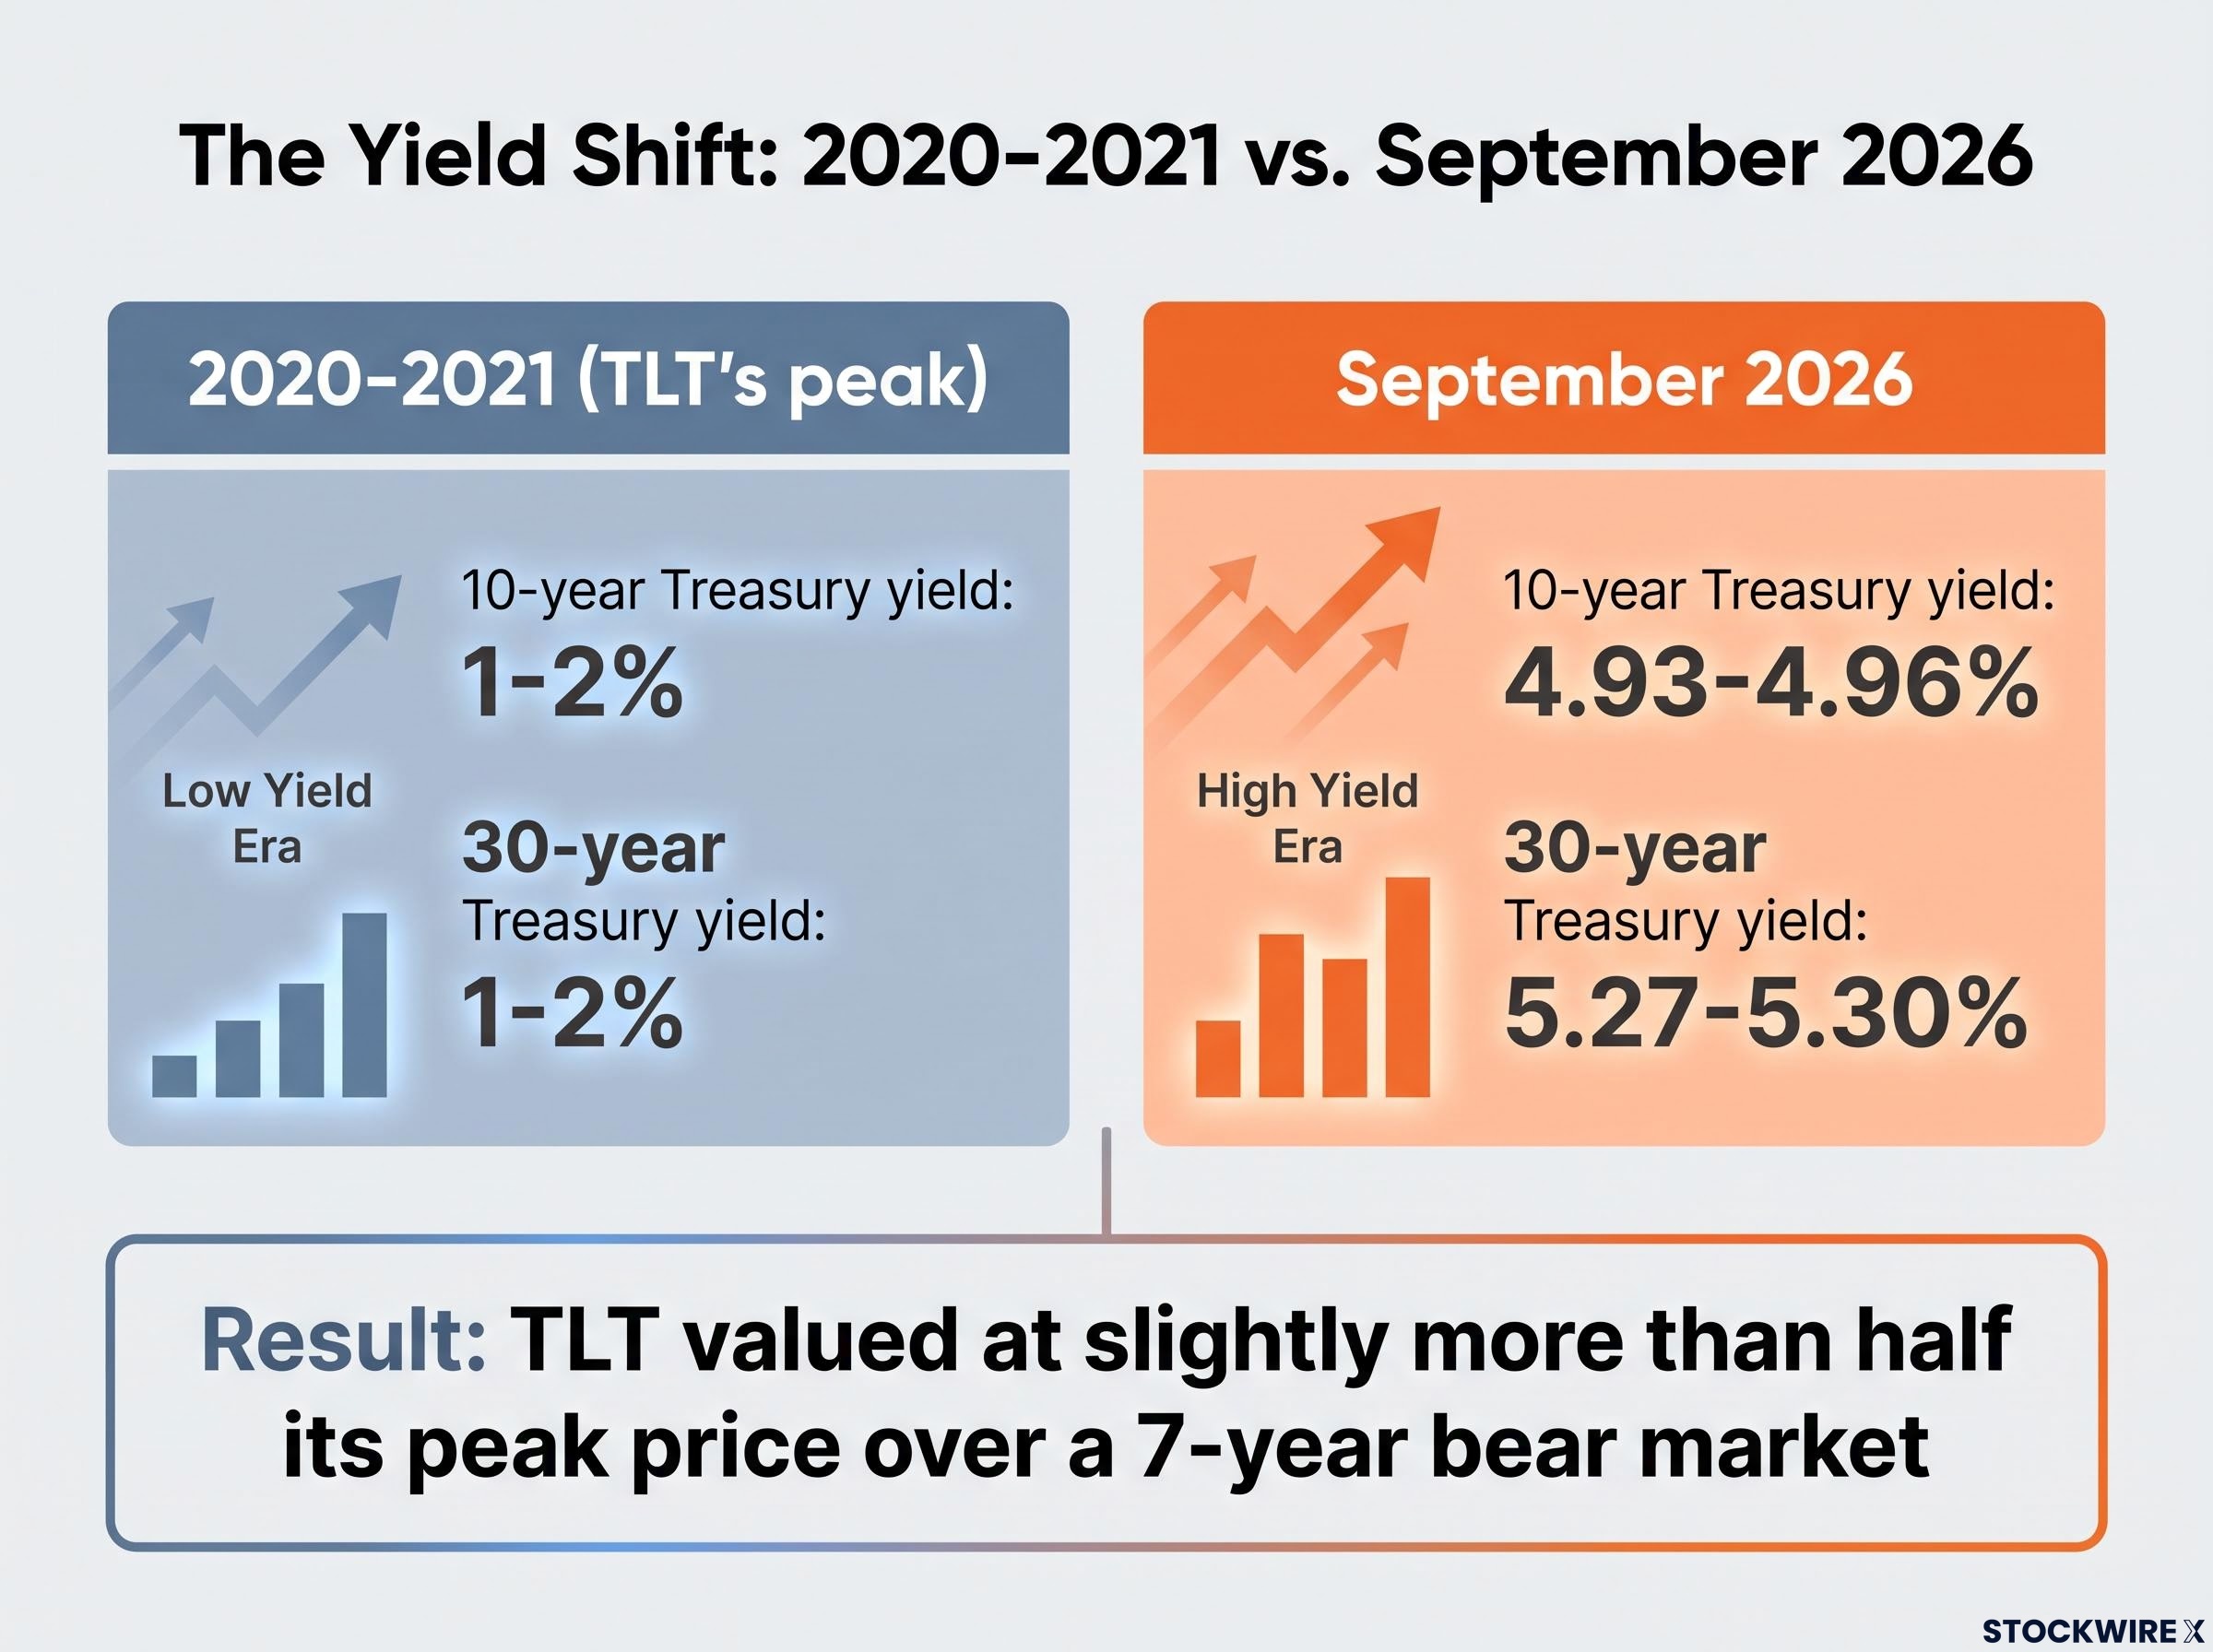
The clearest illustration on record Even after seven years of dividend payments are added back in, TLT is currently valued at slightly more than half its peak price. That is the total-return figure, not just the price chart. The income did not save holders from the rate move.
That three-percentage-point rise is not just a headline number. It is the mathematical cause of some of the largest peacetime losses in the U.S. Treasury market, and if you still hold long-duration bond ETFs, you remain exposed to that same mechanism should yields climb further. Skip this understanding and you will treat these losses as temporary noise, when they are actually the structural output of a rate environment that has fundamentally changed.
When big ASX news breaks, our subscribers know first
Duration and convexity: the two mechanics that turn rate moves into large losses
Pull up TLT and you see a fund that has lost close to half its value. For something marketed as a conservative Treasury holding, that is a shocking number. The reason the loss ran so much larger than most holders expected comes down to two mechanics working in sequence.
The first is duration. Duration measures how sensitive a bond or bond fund’s price is to a change in interest rates, expressed in years. It is the single most important number in fixed income, and most retail investors never look it up.
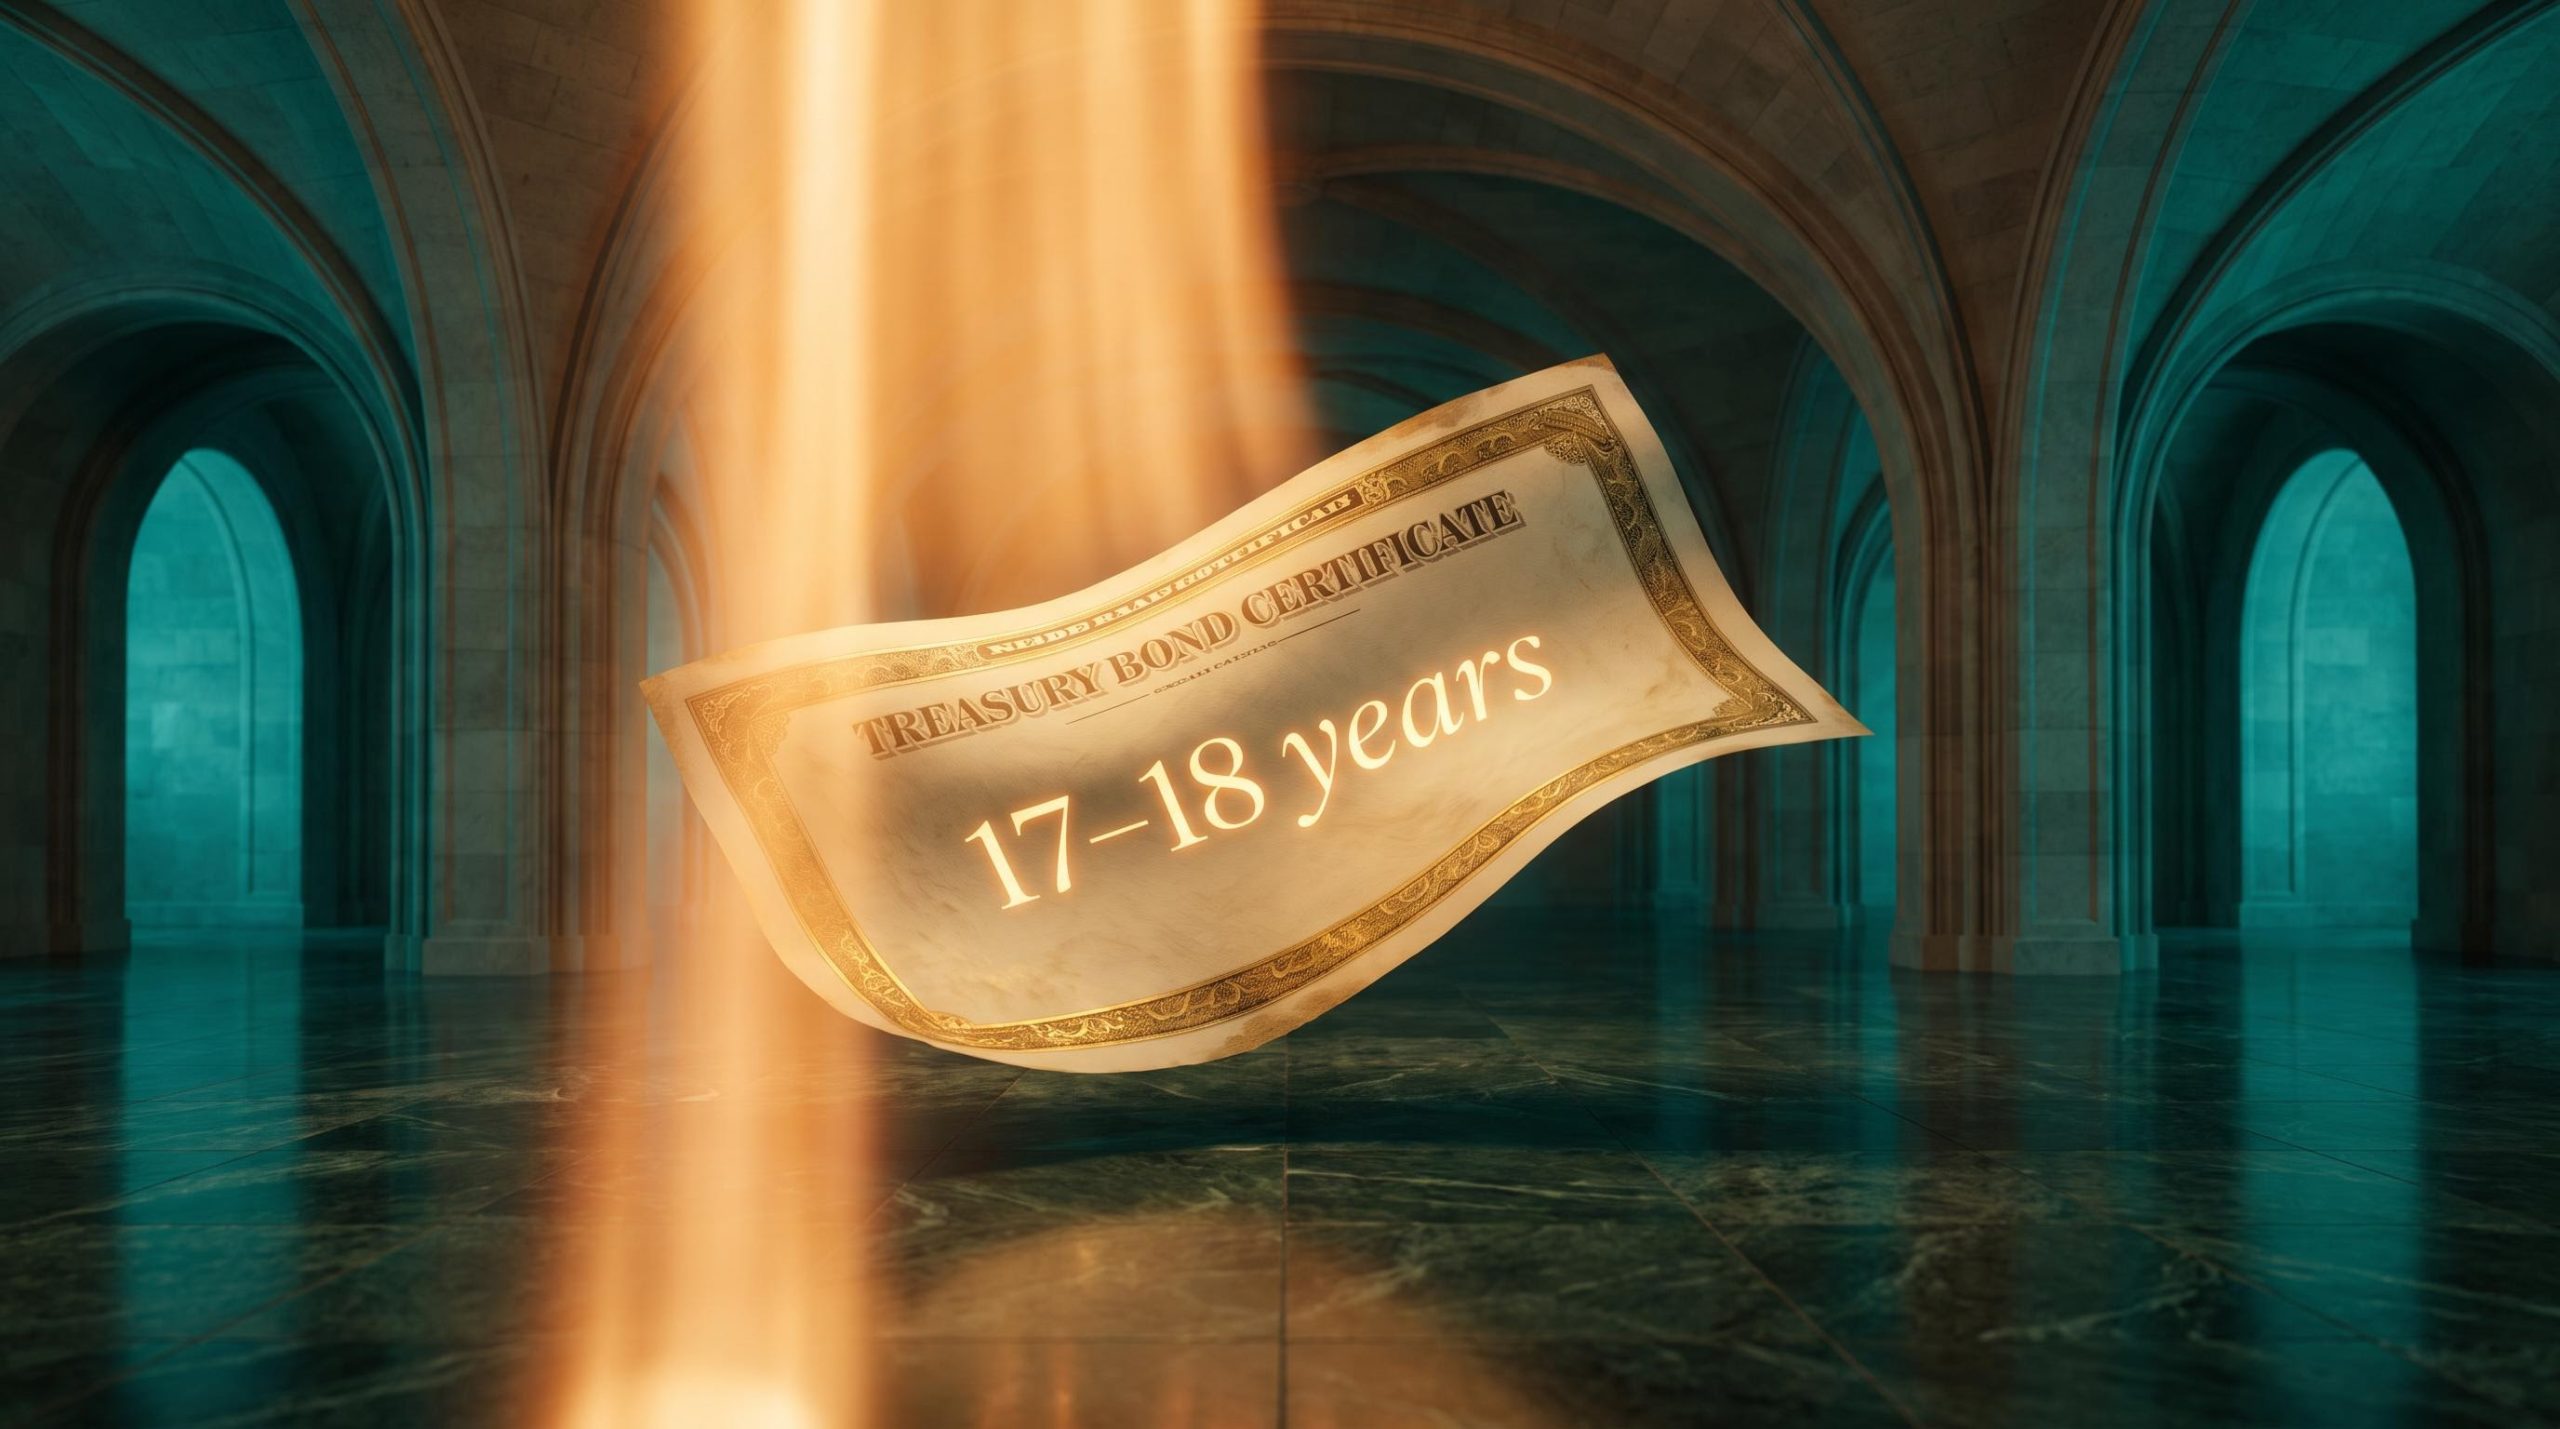
TLT’s index duration sits at approximately 17-18 years, according to BlackRock iShares data. In plain terms, that means a one-percentage-point rise in yields produces roughly a 17-18% fall in the fund’s price. A one-point drop in yields does the reverse.
Apply that to what actually happened. Yields rose roughly three percentage points from their 2021 lows. The duration math alone implies losses well above 50%, which lines up closely with the real-world total-return decline TLT has recorded.
Not every bond fund carries this exposure. IEF, the iShares 7-10 Year Treasury Bond ETF, tracks Treasuries maturing in seven to ten years and therefore carries a far lower duration. Short-term Treasury ETFs sit lower still. Duration is what separates a mild rate wobble from a portfolio-denting drawdown.
| ETF | Approx. duration | Price sensitivity per 1% yield move | Recent price |
|---|---|---|---|
| TLT (20+ year Treasuries) | ~17-18 years | ~17-18% price change | ~$81.80 |
| IEF (7-10 year Treasuries) | Intermediate (well below TLT) | Materially lower than TLT | ~$91.15 |
| Short-term Treasury ETF | ~1-3 years | Very low | Varies by fund |
Prices reflect readings of 21-22 September 2026 from YCharts and PortfoliosLab.
What convexity adds to the picture
Duration gives you a straight-line estimate, but the real relationship bends. That bend is convexity, the second-order effect that means duration itself changes as yields move.
Because of convexity, losses do not scale in a neat, linear way. When rates rise from very low starting points, as they did from 2021 onward, the damage compounds faster than a simple duration multiplication predicts.
For long-maturity Treasuries this convexity is positive, which sounds like a benefit but cuts both ways. It accelerates gains when rates fall and accelerates losses when rates rise from low levels, according to fixed-income education from PIMCO and BlackRock.
There is a behavioural sting too. ETFs mark to market every day, so you watch the full convexity-driven swing in the share price in real time, which piles on the psychological pressure to sell at the worst possible moment.
The practical takeaway is a number. If you hold TLT today, you hold an instrument that stands to lose roughly another 17-18% for each additional one-percentage-point rise in long-term yields. You should know that figure before you decide to hold, add, or trim.
What actually keeps long-term yields elevated, and why the debate matters for your bond holdings
So where do rates go from here? The honest answer is that serious people disagree, and the disagreement is worth mapping because it tells you exactly which variables to watch.
One camp argues yields stay higher for longer, driven by structural forces. Persistent federal deficits increase the supply of Treasuries the market must absorb. The Federal Reserve’s quantitative tightening, its programme of shrinking its balance sheet, has removed a large, price-insensitive buyer. Term premia, the extra compensation investors demand for inflation and policy uncertainty, have risen. And sticky inflation expectations keep a floor under long-term rates.
The other camp expects eventual normalisation. History shows sharp rate spikes tend to reverse once tightening cycles end. If growth slows meaningfully and the Fed cuts policy rates, long-duration bonds could rally hard, which is why some strategists at firms like PIMCO and Vanguard frame today’s yields as an attractive entry point for patient investors.
The two cases, side by side
Higher for longer:
- Persistent fiscal deficits and rising Treasury supply
- Quantitative tightening removing a major buyer
- Elevated term premia
- Sticky inflation expectations
Eventual normalisation:
- Sharp rate spikes historically revert once tightening ends
- A growth slowdown would pull long-term yields down
- Fed rate cuts would benefit long-duration bonds significantly
The recent trend has favoured the first camp. According to yield-curve commentary from 10 September 2026, the 30-year yield climbed from 4.86% around December 2025 to roughly 5.25% by September, while the 10-year rose from 4.19% to near 4.80% over the same nine months.
A milestone worth noting The Georgetown Financial Policy Institute observed in May 2025 that the 30-year Treasury yield surpassed 5% for the first time since 2007, levels not seen since before the last financial crisis.
Both camps agree on the risks. Yields can overshoot higher before any reversal. Fiscal and policy uncertainty keeps rates volatile regardless of the inflation path. And there is behavioural risk: investors who capitulate after large mark-to-market losses crystallise the drawdown rather than positioning for any recovery.
The variables both camps are watching
Rather than trying to forecast rates, treat these as your early-warning system:
- Federal Reserve balance-sheet policy, specifically the pace of quantitative tightening or any pivot back toward buying
- Treasury auction demand, including bid-to-cover ratios that show how eager buyers are
- Monthly CPI prints, the direct read on whether inflation is cooling or sticking
- Congressional budget projections, which shape the deficit and therefore future Treasury supply
Here is the part that matters most for you. Whether yields ultimately rise or fall, your bond ETF holdings already sit in a high-sensitivity environment. The direction debate is secondary to a decision only you can make: how much duration exposure belongs in your specific portfolio given your time horizon and risk tolerance. You do not need to call rates correctly to size that exposure intelligently.
Six practical moves for managing interest rate risk in your fixed-income portfolio
Knowing the mechanics is only useful if it changes what you do. Each of the following strategies alters something concrete about your portfolio’s rate sensitivity, and each carries an honest trade-off so you can self-select rather than be pushed toward one answer.
- Match duration to your horizon. This is the foundation. If you need the money within three to five years, a fund with 17-18 years of duration is a structural mismatch that no yield advantage can justify. A near-term cash need funded partly by TLT is exposed to a potential 17-18% loss for every additional one-point rate rise.
- Shift toward shorter-duration funds. Short-term Treasury ETFs, with durations of roughly one to three years, slash your rate sensitivity. The trade-off is less upside if yields fall and often lower income once the curve normalises.
- Build a bond ladder or use target-maturity ETFs. Laddering across maturities means each rung matures and gets reinvested at prevailing rates, reducing dependence on any single yield level. BlackRock and other providers now offer target-maturity bond ETFs that replicate a ladder for retail investors without the work of managing individual bonds. Ladders reduce timing risk but do not remove mark-to-market volatility.
- Add inflation-protected securities (TIPS). TIPS adjust their principal with CPI, partially insulating your real return if inflation is your main worry. The catch is they still carry real-rate duration risk, so they are not a complete escape from rate moves.
- Consider floating-rate instruments. Floating-rate notes and bank-loan funds have coupons that reset with short-term rates, making them far less rate-sensitive. The trade-off is typically higher credit risk, the chance the borrower struggles to repay.
- Use a barbell approach. Pairing short-duration holdings with a smaller slice of long-duration exposure balances income against risk, rather than betting everything on very long maturities. The cost is complexity: you need to understand how each segment behaves under different rate scenarios.
| Strategy | Primary mechanism | Key trade-off |
|---|---|---|
| Match duration to horizon | Aligns rate risk with when you need the money | May sacrifice yield on longer bonds |
| Shorter-duration funds | Cuts price sensitivity to rate moves | Less upside if yields fall; often lower income |
| Bond ladder / target-maturity ETFs | Spreads reinvestment across maturities | Does not remove mark-to-market volatility |
| TIPS | Adjusts principal for CPI inflation | Still carries real-rate duration risk |
| Floating-rate instruments | Coupons reset with short-term rates | Typically higher credit risk |
The single most important number you can know right now is the aggregate duration of your bond holdings, because it tells you exactly how much additional loss you face for each rise in yields. Most retail investors holding bond ETFs cannot state that number. Duration management is not a defensive move reserved for professionals; it is the basic act of matching your risk to the time horizon you actually have.
What seven years of bond losses actually tell you about where the risk sits now
The seven-year decline in TLT is not just a painful chapter to look back on. It is a completed lesson in duration risk that you can now apply going forward.
The same mechanics that produced those losses remain fully active. TLT trades near $81.80, roughly seven years into a bear market that has cut its total return to slightly more than half its peak, according to Tim Knight and YCharts. With the 30-year yield at approximately 5.27-5.30% as of September 2026 and TLT’s duration still sitting at 17-18 years, the sensitivity is completely live. Nothing about the instrument has become safer.
The core takeaway Long-duration bond ETFs are high-beta interest-rate instruments. Their duration is a conscious choice you are making, not a background condition you can ignore.
That reframes your position. Investors who sell after large mark-to-market losses crystallise the drawdown; investors who understand the duration math hold a genuine choice rather than a passive hope that rates will retrace. Ask yourself the one question that matters: does your fixed-income duration match your investment horizon? Seven years of documented price history in TLT is one of the clearest real-world demonstrations of interest rate risk ever recorded, and its final value to you is as a forward-looking framework you can act on.
This article is for informational purposes only and should not be considered financial advice. Investors should conduct their own research and consult with financial professionals before making investment decisions. Past performance does not guarantee future results, and financial projections are subject to market conditions and various risk factors.