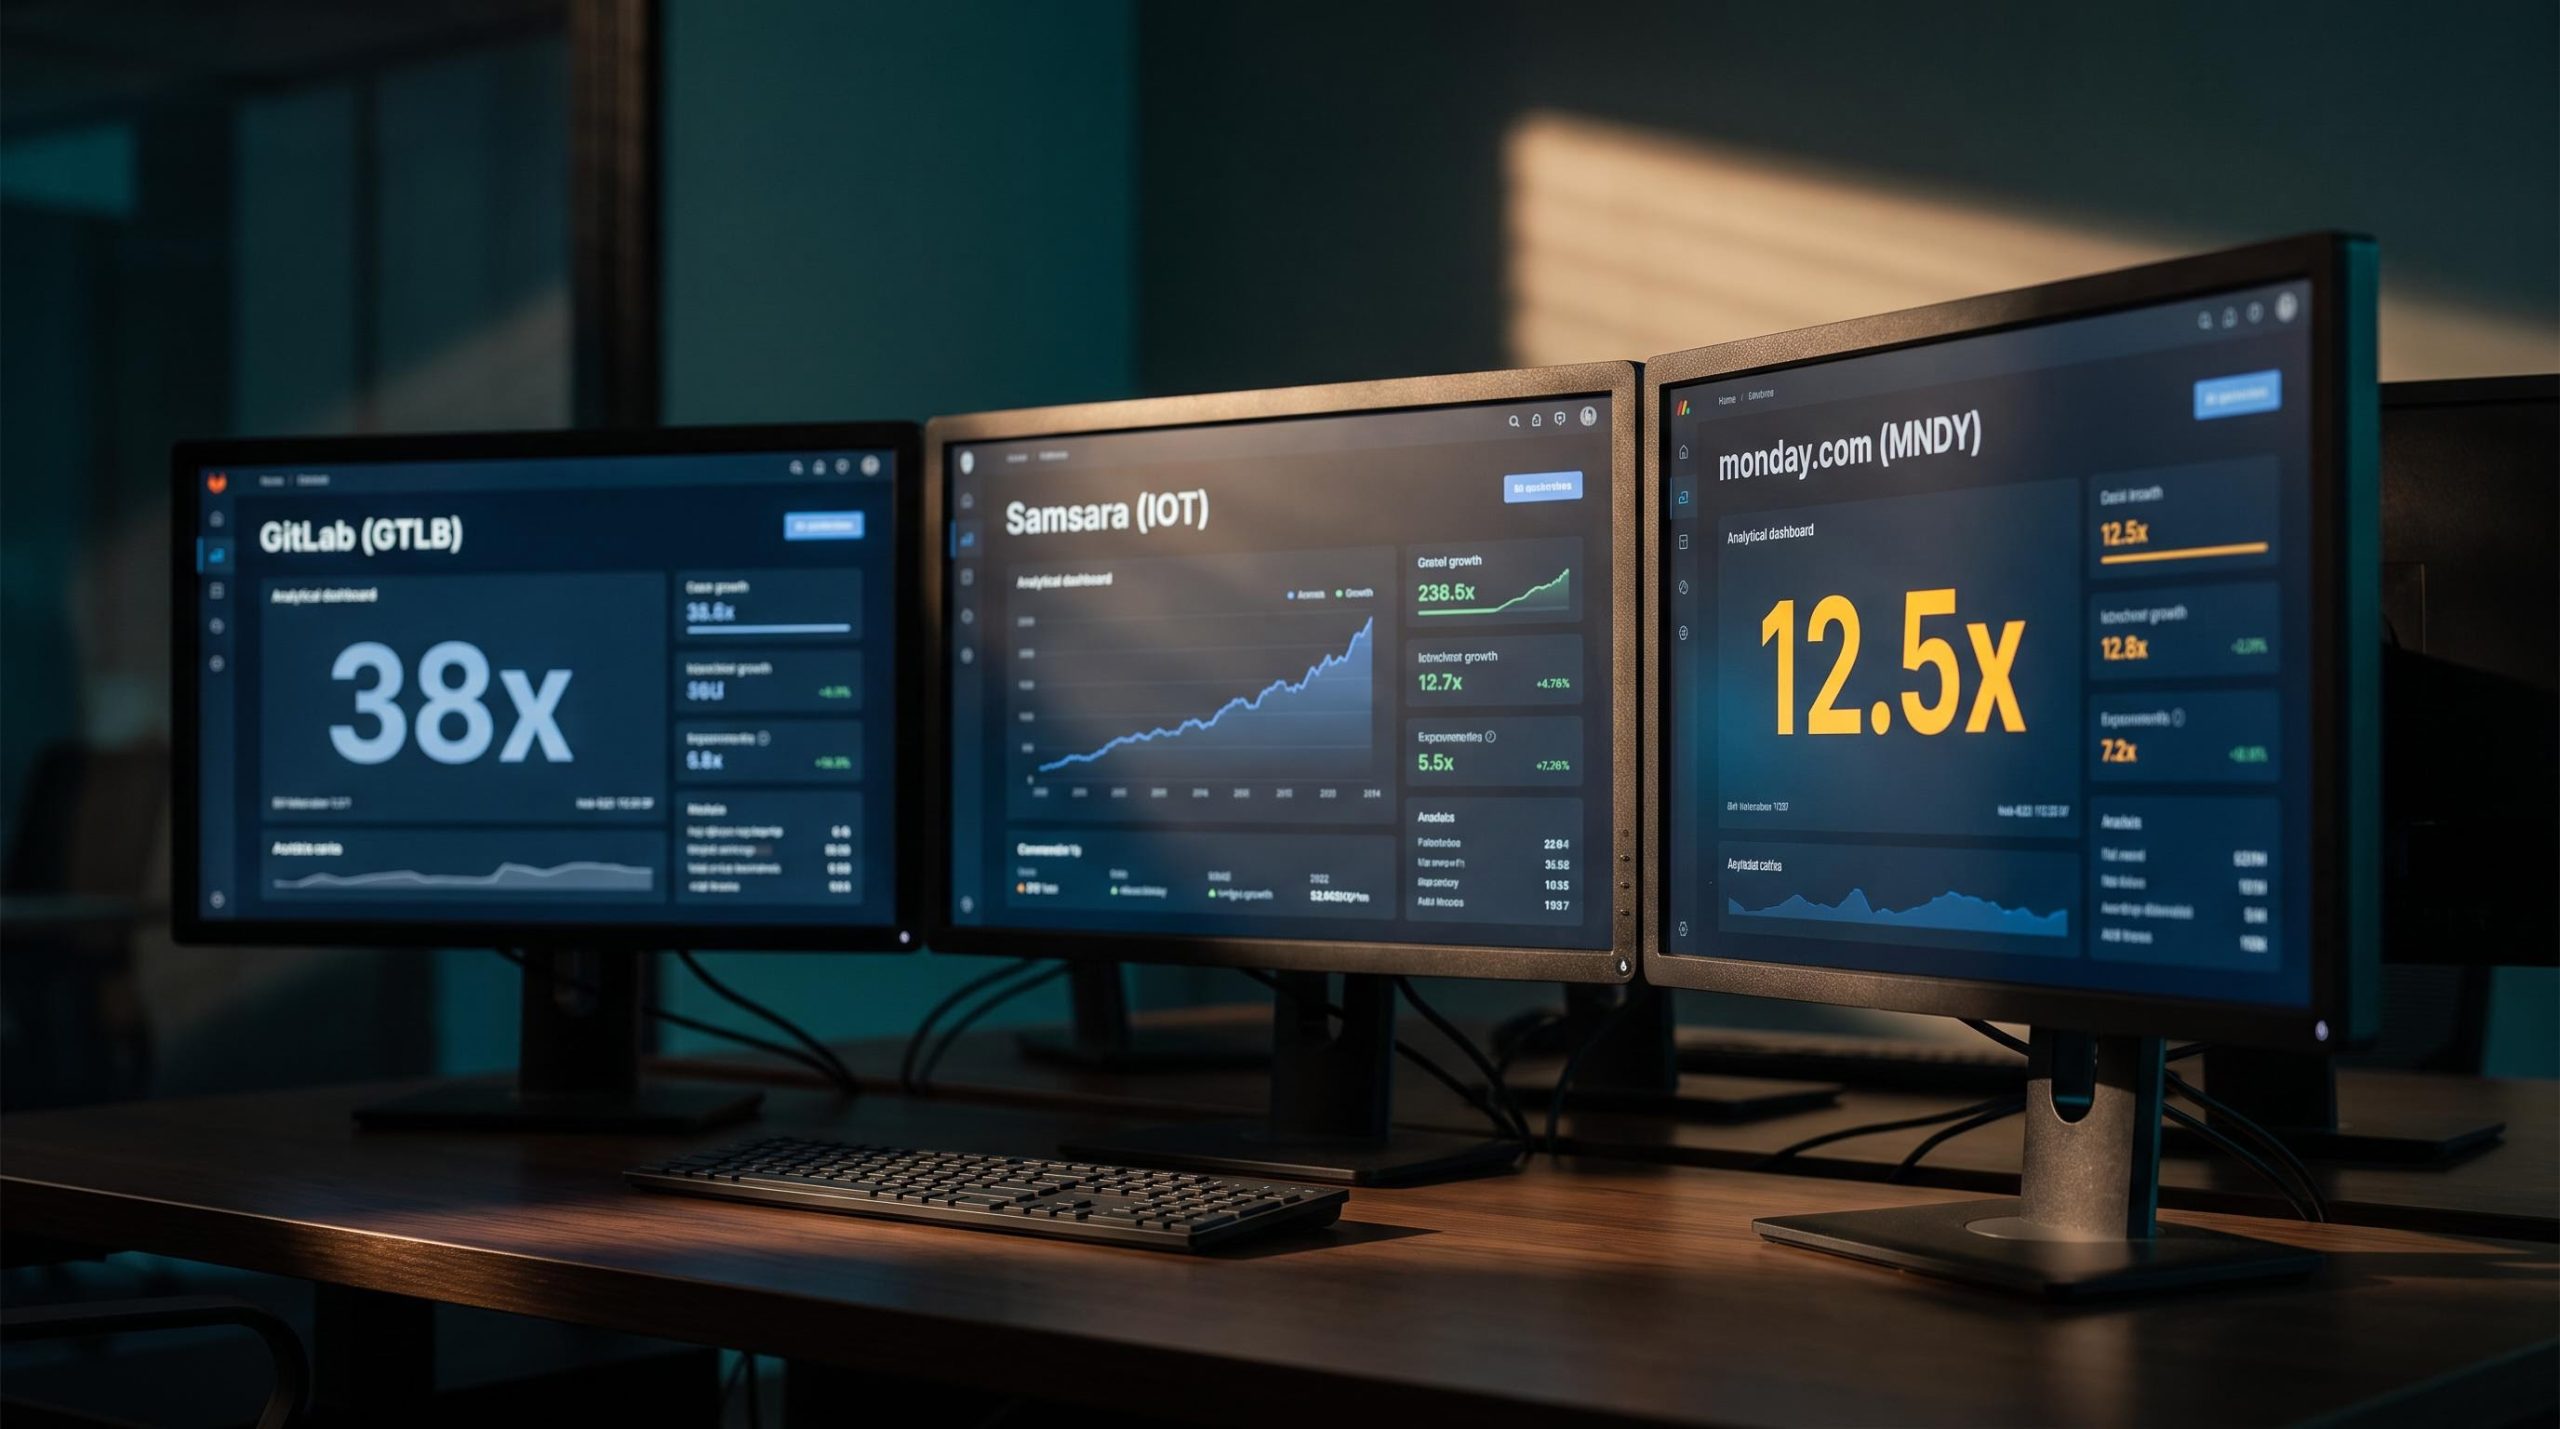
Three software companies. One valuation framework. Three completely different investment conclusions.
GitLab, Samsara, and monday.com each grow revenue somewhere in the 20-30% range every year. Each throws off meaningful free cash flow. Each trades at a multiple the broader market would never tolerate. From a distance, they look like three versions of the same story.
Run all three through an identical discounted cash flow model, and that story fractures. The valuation comparison across these software stocks stops being about who is growing fastest and starts being about where each one sits on the arc from growth-stage to cash-flow-mature.
The trouble with the usual shortcuts, price-to-sales, forward earnings multiples, is that they collapse the moment two companies sit at different profitability stages. A business with 89% gross margins and roughly $300 million of trailing free cash flow behaves nothing like one that only recently pushed operating income into positive territory, even if both wear the “growth software” badge.
Here is what the same model tells you about three very different risk-return profiles, and why the methodology matters as much as the output. This walks through one DCF framework applied to all three, using real financial inputs and scenario-based assumptions, so you can see not just what the numbers are but what has to be true for each investment case to hold.
Why free cash flow is the right lens for comparing growth software stocks
Start with the metric most investors reach for first, and watch it fail.
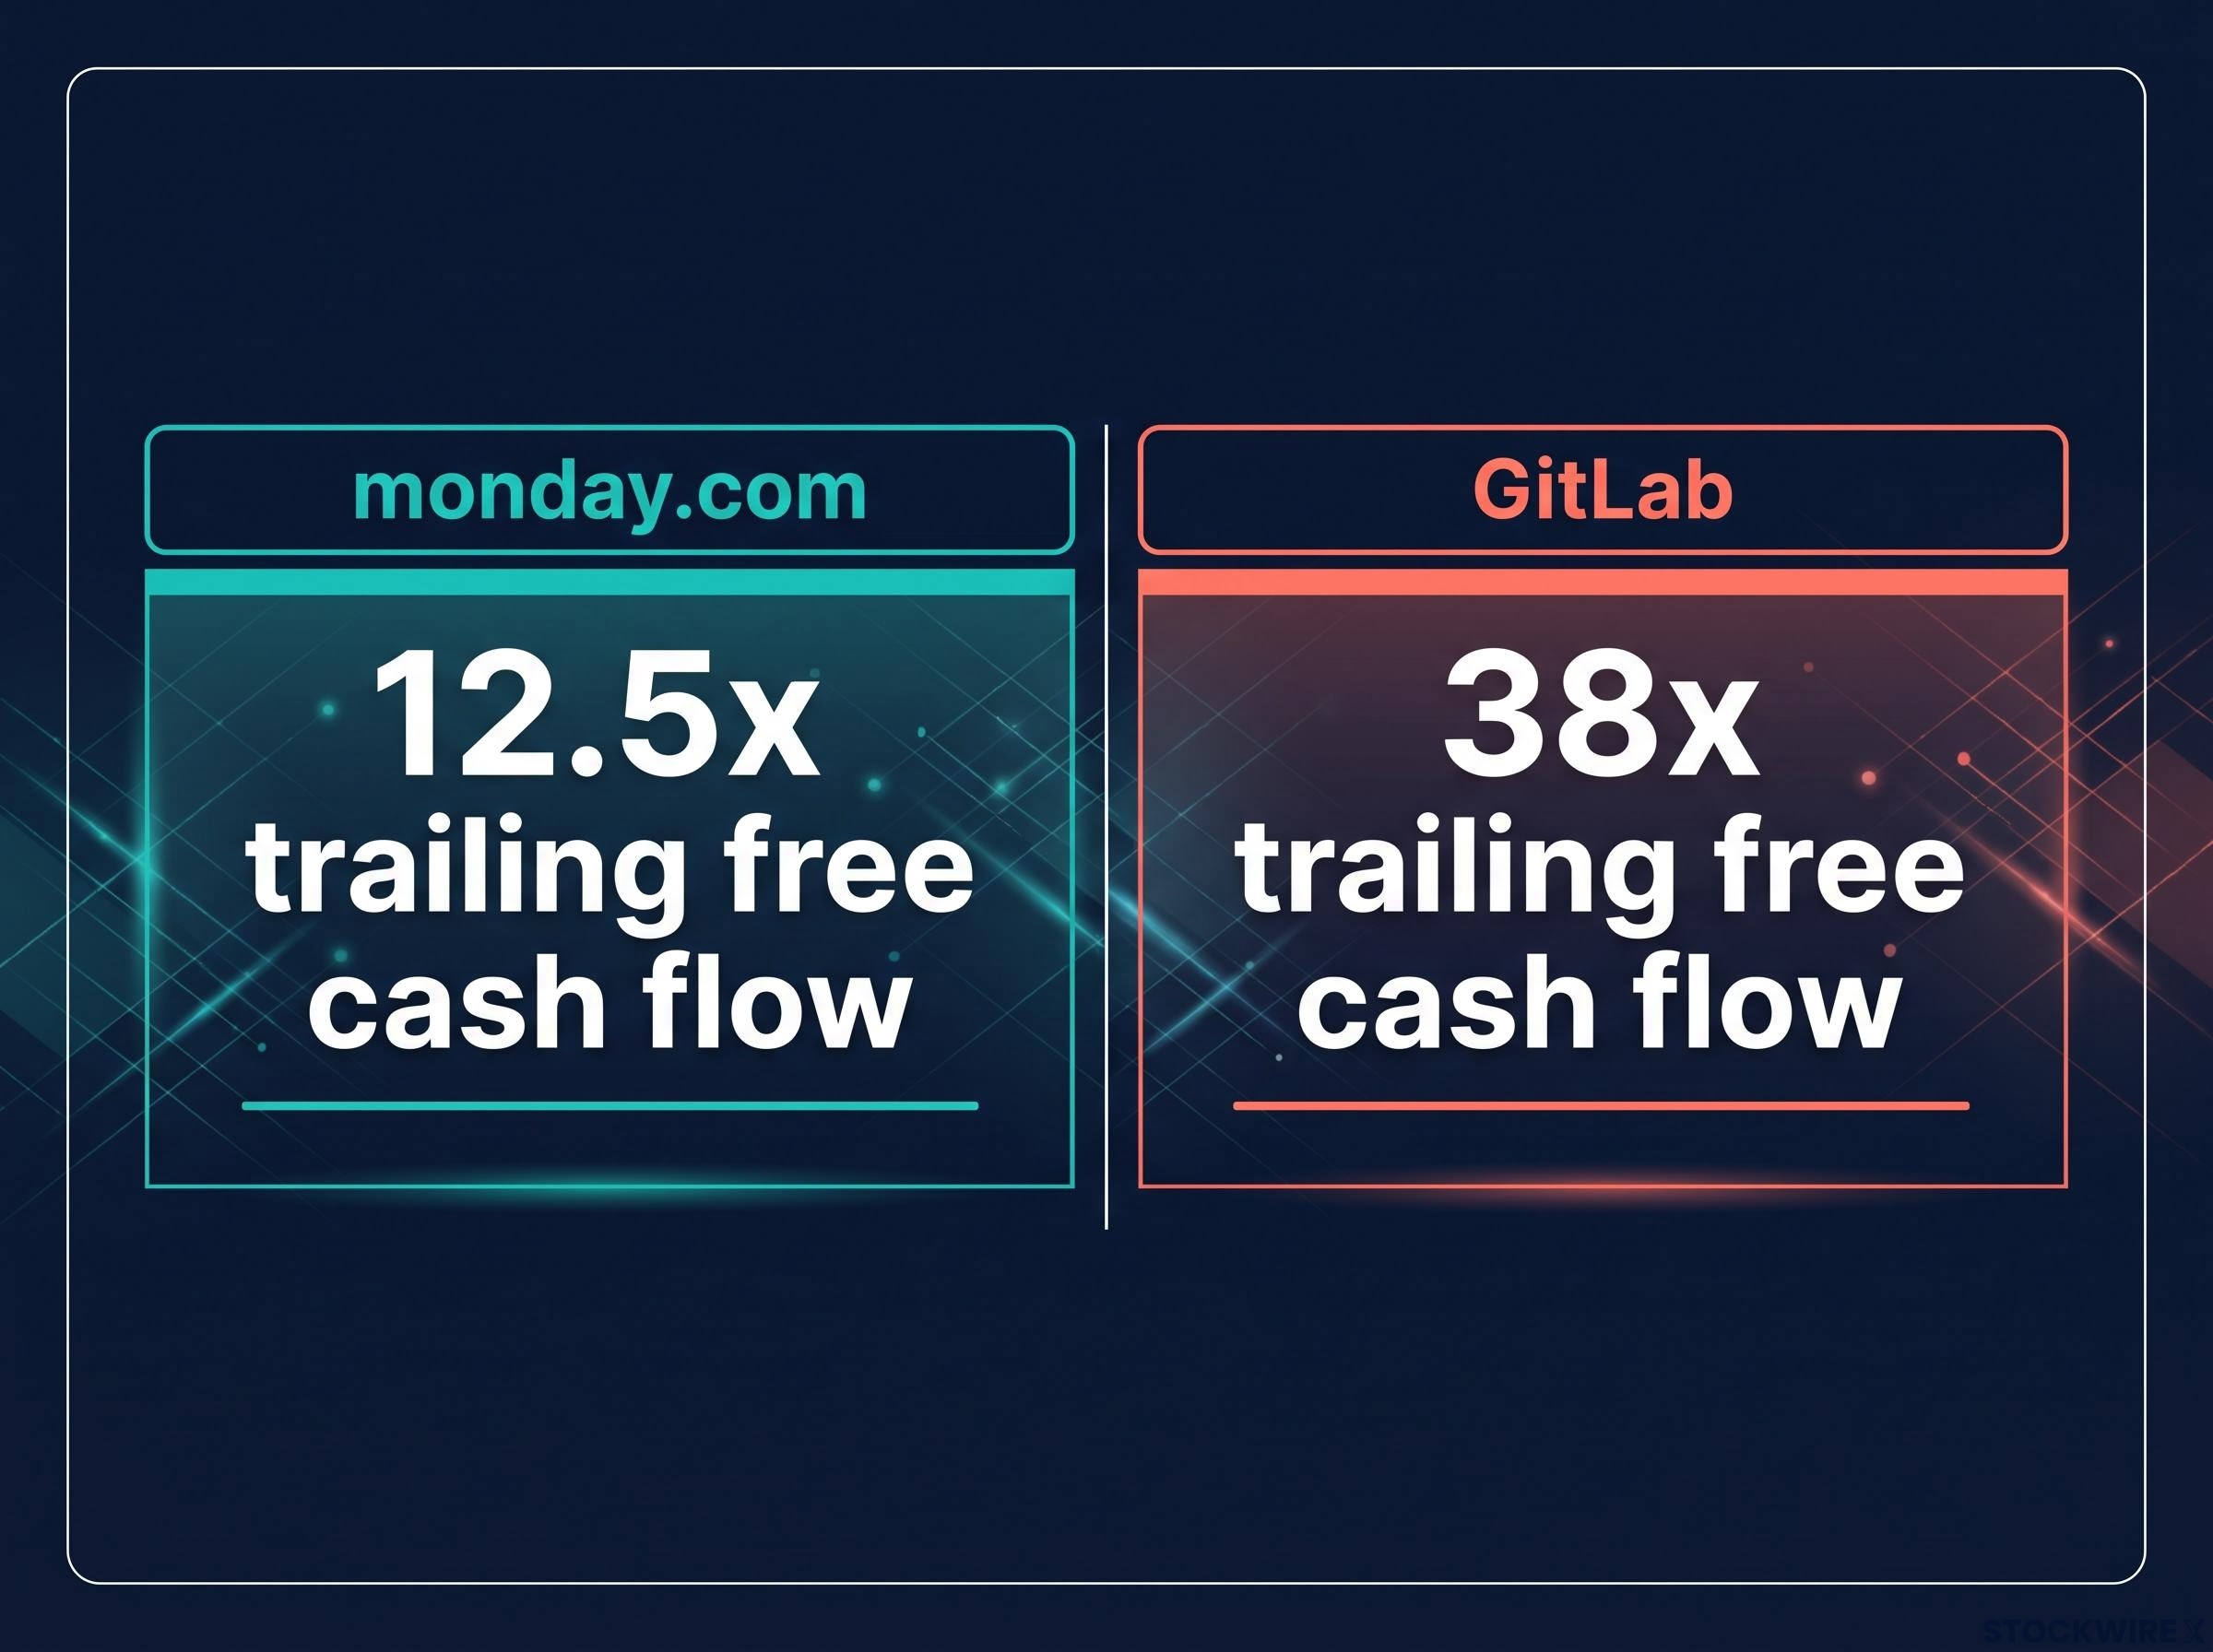
Price-to-sales looks tidy until you line these three up. monday.com trades at roughly 12.5 times trailing free cash flow. GitLab trades at around 38 times. If you leaned on a sales multiple, you would treat those two as roughly comparable growth names. On a cash-flow basis, they are priced in different universes, because they convert revenue into cash at very different rates and at very different stages of maturity.
That is the core problem. A price-to-sales ratio treats a dollar of GitLab revenue and a dollar of Samsara revenue as equivalent, when what actually matters is how much of that dollar survives the trip down to free cash flow. And that survival rate starts with gross margin.
GitLab and monday.com both clear 87% gross margins. Samsara sits at 76-78%, a structural gap that compounds across a 10-year projection.
That 11-point gap is not a rounding difference. Every dollar Samsara earns arrives with more cost of delivery baked in, which means it has less structural room before operating expenses eat into cash generation. To reach the same 25% free cash flow margin the model asks of it, Samsara has to run tighter operating discipline per dollar of revenue than either GitLab or monday.com. The gap widens the longer you project it forward.
Free cash flow, the cash a business generates after funding its operations and capital spending, is the metric that forces all of this into view. It captures gross margin, operating discipline, and reinvestment in a single number.
The distinction between free cash flow vs EPS matters precisely because EPS is an accrual figure that excludes stock-based compensation, depreciation, and revenue recognised before cash is collected, meaning two companies with identical earnings per share can sit at completely different points on the cash-generation curve.
The framework applied to all three companies rests on three inputs, each modelled across a low, middle, and high scenario over a 10-year horizon, against a 9.5% required annual return:
- Revenue growth rate: how fast the top line compounds, which sets the size of the cash-flow base being valued.
- FCF margin: the share of revenue that converts to free cash flow, which is where gross margin and operating leverage show up.
- Exit P/FCF multiple: what the market is assumed to pay for the business at the end of the projection, which captures maturity and durability.
Get comfortable with those three levers and you can run this same comparison on any growth software name, not just these three.
When big ASX news breaks, our subscribers know first
Reading the fundamentals: where each company actually stands today
Before any scenario is credible, you need to know which numbers are observed and which are assumed. These three companies occupy genuinely different points on the same curve.
GitLab offers the most precisely documented picture. Its platform combines software development and security into one environment, with federal agencies and defence organisations among its core customers thanks to secure on-premises deployment. For fiscal year 2026, ended 31 January 2026, GitLab reported $955.2 million in revenue, up 26% year over year, with $219.6 million in adjusted free cash flow (grown 83% on the prior year) and a 17% non-GAAP operating margin. Annual recurring revenue crossed $1 billion. A more recent trailing-twelve-month reading as of mid-2026 puts revenue nearer $1.06 billion at roughly 23% growth, the deceleration that becomes a theme later.
Samsara is the fastest grower and the least mature on profitability. Its software and hardware digitise physical operations, vehicle fleets, warehouses, industrial machinery, with high switching costs once a customer embeds fleet and compliance workflows into the platform. Revenue is growing around 30% year over year, non-GAAP operating margin reached 21%, and six-month free cash flow came in at $137.9 million, a 14% margin. Gross margin sits at 76-78%, and return on invested capital only recently turned positive after years in negative territory.
Samsara’s FCF margin moved from 15.3% to 12.7% in a single quarter, a reminder that companies at early profitability stages are more sensitive to investment decisions than their growth rates suggest.
The Rule of 40 captures a version of the same trade-off in a single score: Samsara’s 30% revenue growth and 14% FCF margin sum to 44, clearing the threshold, while GitLab’s decelerating growth and current margin structure make that buffer thinner with each passing quarter.
monday.com is the strongest cash-flow compounder of the three. Once a project management tool, it has grown into an enterprise-wide work operating system coordinating people and workflows across whole organisations. Gross margin runs at roughly 89%, trailing free cash flow is approximately $295-300 million at a 22% margin, and the stock trades at just 12.5 times that cash flow. That combination, top-tier margins, strong conversion, and a modest multiple, makes monday.com the most attractively priced of the three on a cash-flow basis today, regardless of which growth scenario proves right.
monday.com’s 20-F annual report, filed as a foreign private issuer under SEC requirements, provides the audited gross margin, free cash flow conversion, and share count data that underpin the valuation inputs used in the model here.
| Metric | GitLab (GTLB) | Samsara (IOT) | monday.com (MNDY) | Notes |
|---|---|---|---|---|
| Revenue | $955.2M (FY2026) | ~30% YoY growth | ~$365M quarterly run-rate | GitLab ~$1.06B mid-2026 TTM; IOT/MNDY TTM not labelled by named sources |
| Revenue growth (YoY) | 26% (FY26); 21% (Q2 FY27) | ~30% | ~22-24% | |
| Gross margin | 87% GAAP / 89% non-GAAP | ~76-78% | ~89% non-GAAP | |
| FCF (trailing) | $219.6M | $137.9M (6-month, 14% margin) | ~$295-300M (22% margin) | Samsara 6-month proxy; MNDY TTM from analytical tool |
| Non-GAAP operating margin | 17% | 21% | Not reported | |
| Market cap | ~$8.3B | ~$22-23B | Implied by P/FCF ~12.5x | |
| P/FCF (trailing) | ~38x | Not available | ~12.5x |
The capital return divide
The share count story separates these three as sharply as the margins do.
GitLab’s board authorised a $400 million share repurchase programme in March 2026, a direct offset to the dilution from stock-based compensation. monday.com is going further, actively shrinking its share count through buybacks. In a DCF context, that matters because per-share value depends not only on how much cash the business generates but on how many shares that cash is divided across.
Samsara has no identified capital return programme. That leaves ongoing dilution as a headwind working directly against per-share value, no matter how well the company grows at the aggregate level. Hold that thought; it reshapes the return estimates in the risk section.
What the DCF model says: scenario outputs and annualised return estimates
Now the framework meets the numbers. Each company runs through the same low, middle, and high scenarios, the same 9.5% required return, the same 10-year horizon.
| Company | Scenario | Revenue growth | FCF margin / exit P/FCF | Fair value per share |
|---|---|---|---|---|
| GitLab | Low | 8% | 18% / 14x | ~$23 |
| GitLab | Middle | 13% | 24% / 18x | ~$53 |
| GitLab | High | 18% | 30% / 22x | ~$112 |
| Samsara | Low | 12% | 17.5% / 16x | ~$17 |
| Samsara | Middle | 20% | 25% / 20x | ~$50 |
| Samsara | High | 27.5% | 32.5% / 24x | ~$133 |
| monday.com | Low | 10% | 18% / 16x | ~$145 |
| monday.com | Middle | 15% | 24% / 20x | ~$330 |
| monday.com | High | 20% | 30% / 24x | ~$700 |
The middle case is where the comparison earns its keep. GitLab’s mid-case fair value of roughly $53 per share implies an annualised return of about 10.5% at current prices. Samsara’s mid-case of roughly $50 implies about 13%. monday.com’s mid-case sits near $330 per share, resting on the least demanding assumption set of the three.
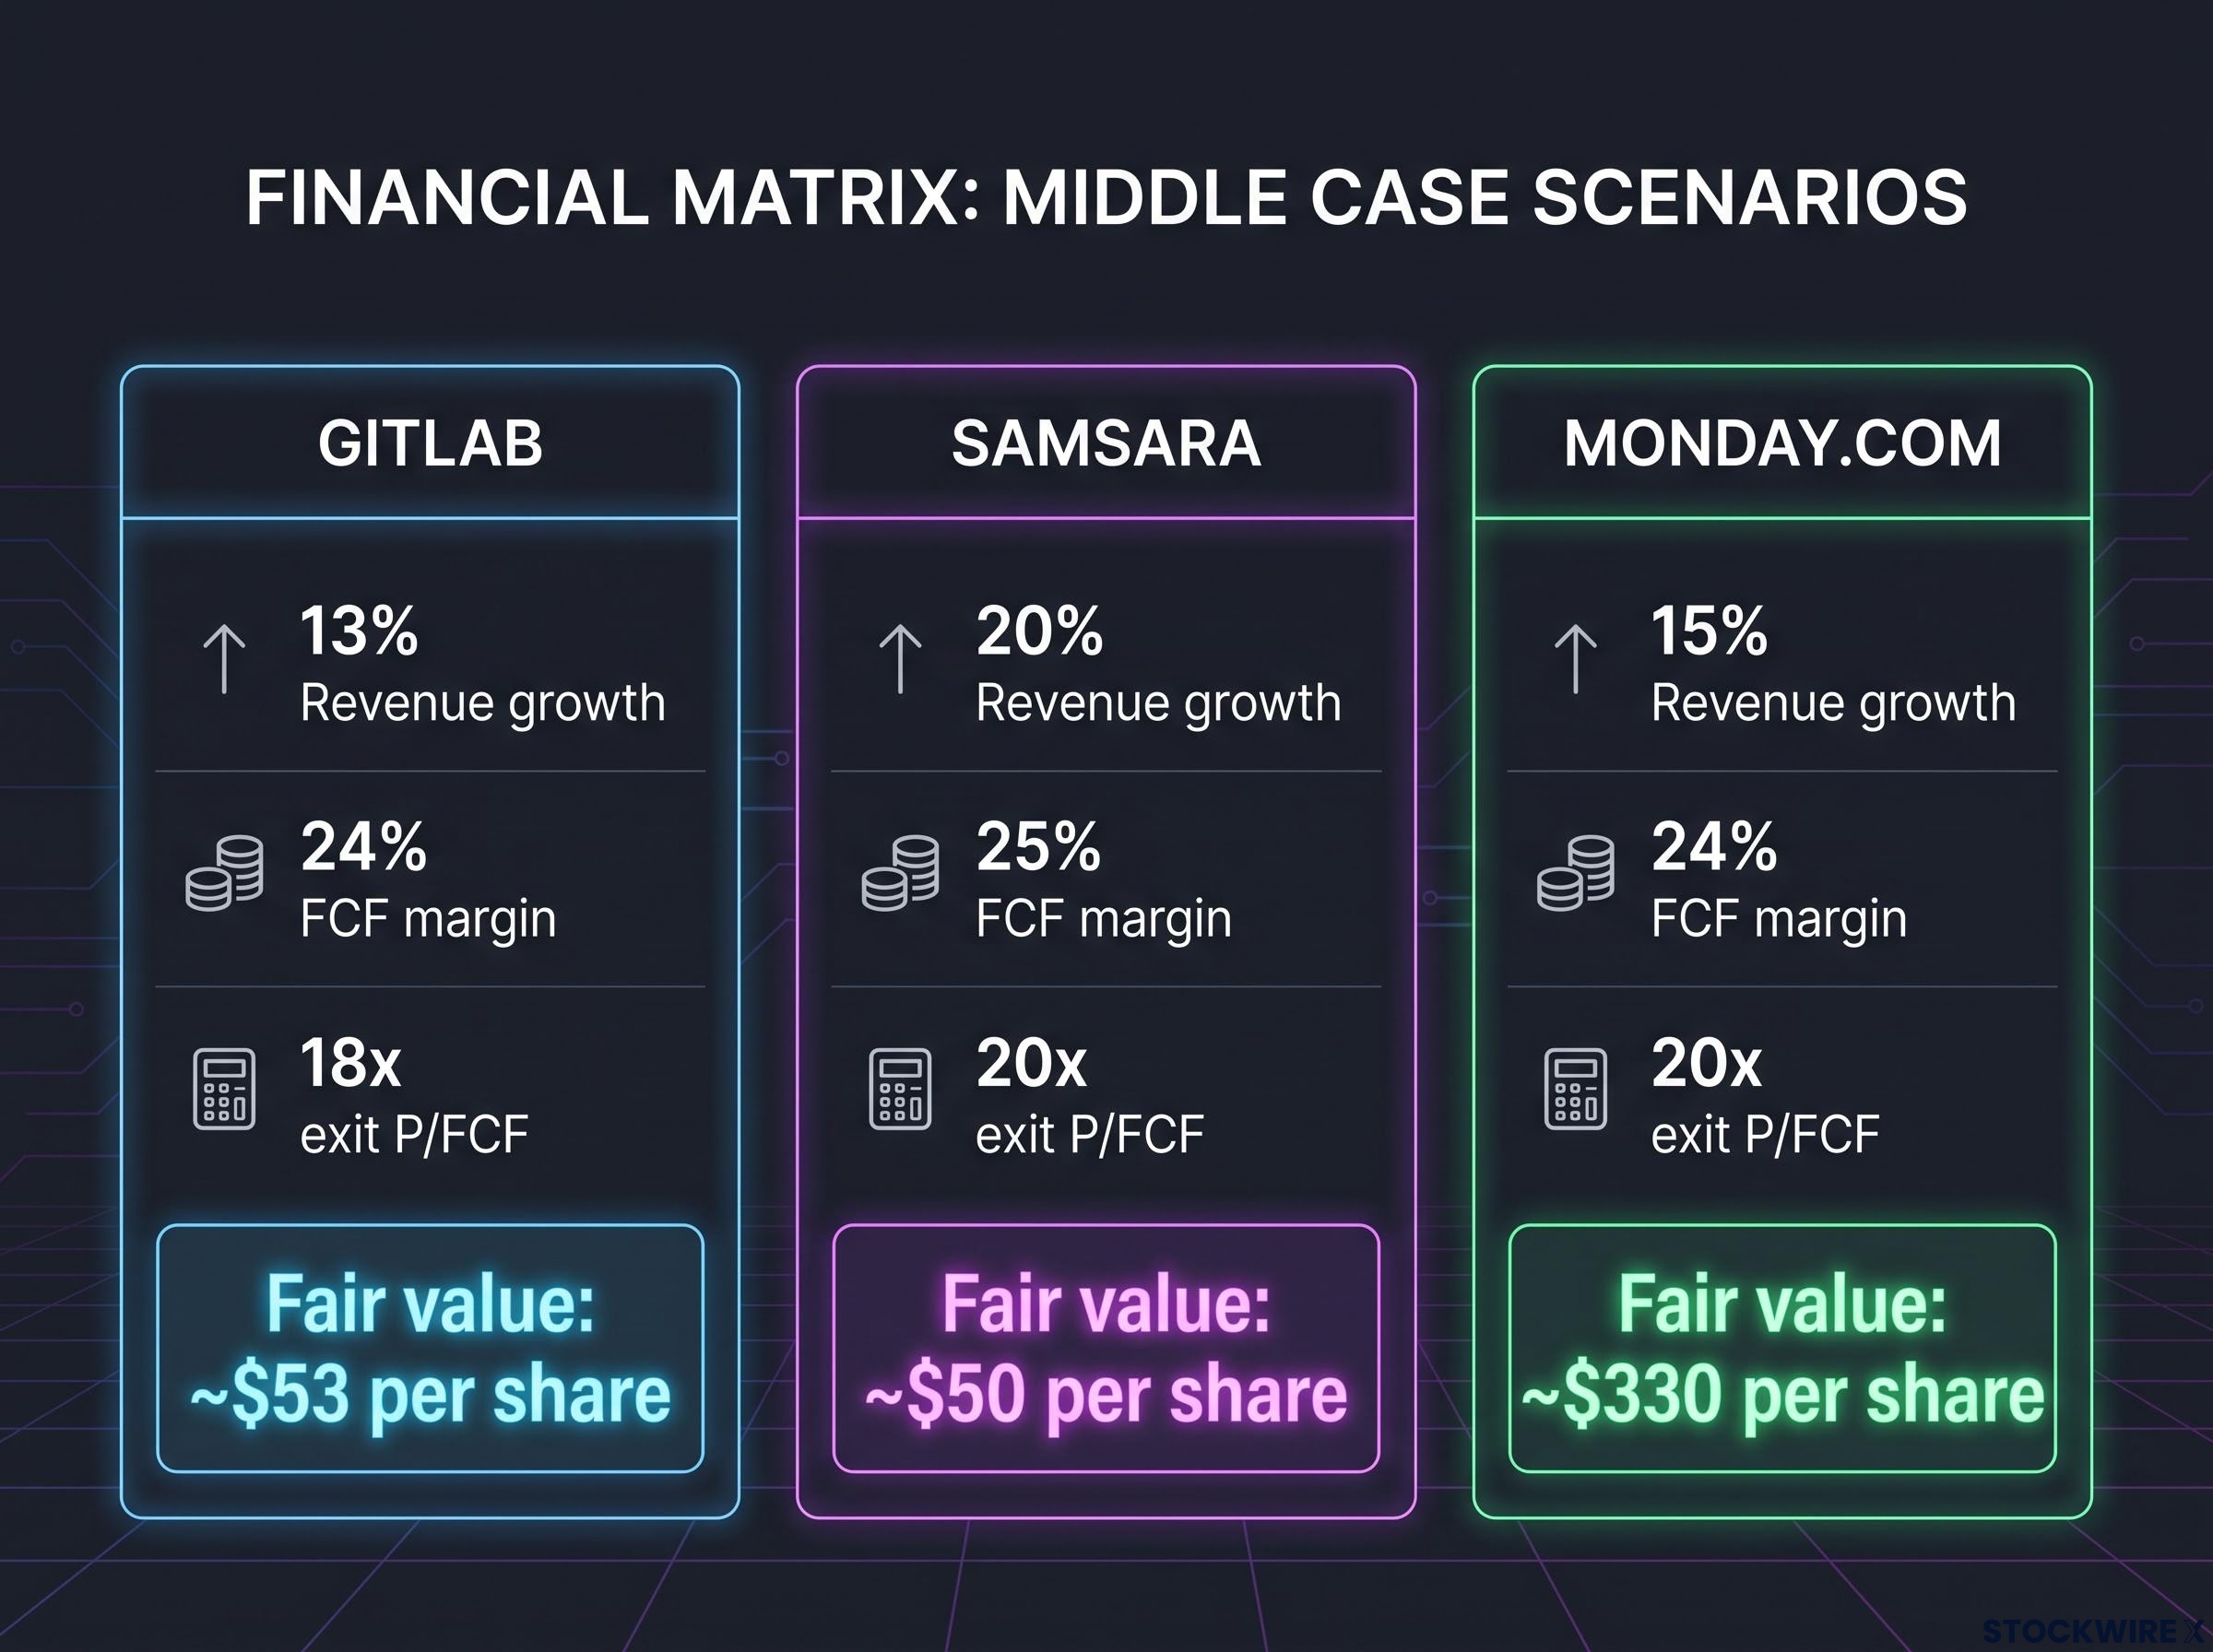
Three observations flow directly from the table:
- monday.com needs the least to reach its mid-case. Fifteen percent growth against a 12.5x starting multiple asks for far less heavy lifting than the other two require.
- Samsara has to work hardest. Its mid-case demands 20% revenue growth and a jump to a 25% FCF margin from a current 14%, a near-doubling of cash conversion.
- GitLab has the narrowest high-case headroom on a per-share basis relative to where the stock trades today.
Both the GitLab and Samsara middle-case return estimates are stated before accounting for share dilution, which reduces the per-share value of any DCF outcome.
Here is the number to anchor on. Mid-case returns of 10.5% for GitLab and 13% for Samsara clear the 9.5% hurdle, but only just. That thin margin means the market has already priced in a good chunk of the optimistic scenario. Any meaningful execution disappointment, and both cases slide toward market-rate returns or below before the story has properly gone wrong.
The risks that do not live inside the model
A DCF produces a range, not a verdict. The neatness of a fair value estimate can disguise how much sits outside the model entirely, and three factors in particular sit outside it here.
Dilution is the most direct. It is also the one each company most controls, which is why the capital return divide is a signal, not a footnote:
- GitLab: stock-based compensation lifts the share count, partially offset by the $400 million repurchase authorised in March 2026.
- Samsara: no identified offset. Ongoing dilution works straight against per-share value regardless of aggregate FCF growth.
- monday.com: actively reducing shares, meaning the same company-level cash flow spreads across fewer shares over time.
That is why monday.com’s buyback reads as more than a financial detail. It signals management prioritising per-share value alongside growth, precisely the variable the DCF cannot capture on its own.
Data quality is the second, uneven, risk. GitLab’s inputs come from a named FY2026 press release, a fully documented base. Samsara’s and monday.com’s trailing-twelve-month figures are either extrapolated from quarterly data or drawn from an analytical tool rather than named financial filings, which should temper confidence in their base-case inputs. No consensus estimate data from named aggregators such as Bloomberg or FactSet was available for any of the three during research.
Then there is moat durability, the variable most absent from the model:
- GitLab: faces Microsoft’s GitHub, a well-resourced direct competitor.
- Samsara: operates in a still-largely-unpenetrated market, but with no named analyst moat assessment available.
- monday.com: its evolution into an enterprise work operating system is the moat thesis, unconfirmed by institutional research.
No named analyst or institutional-desk assessment of long-term competitive moat was available for any of the three companies versus specific competitors, which means moat durability is assumption, not evidence, in these models.
Per-seat pricing risk sits directly inside the moat durability question for monday.com, whose work operating system thesis rests on seat expansion across enterprise organisations at precisely the moment AI-native competitors are benchmarking their own models on reducing seat counts by 80-90%.
The evaluation scorecards sharpen the picture. Samsara showed only three of eight positive markers, cash flow, net income, and revenue, with higher debt among the concerns. monday.com posted six of eight, its two negatives being a history of negative net income and related valuation metrics. And GitLab’s growth has already slipped from 26% in FY2026 to 21% in Q2 FY2027, which quietly compresses the credible range for its revenue growth assumptions.
Which case is most achievable, and what each investor needs to believe
The point of running one model across three businesses is not to crown a winner. It is to see that each stock is a different hypothesis requiring a different set of beliefs.
monday.com presents the most attractive combination of current cash-flow yield, gross margin structure, and capital return discipline. Samsara offers the highest growth rate but demands the most execution on profitability. GitLab sits between them on growth and multiple while carrying the most direct competitive threat.
Here is what each middle case asks you to believe:
Each scenario in the DCF table encodes an implied growth rate that the market must believe is achievable: Samsara’s high case requires 27.5% compound annual revenue growth for a decade, a figure that sits far above the sector median and demands explicit justification before it earns weight in any investment thesis.
- monday.com: that the work operating system thesis keeps deepening at 15% growth while margins expand further, starting from a 12.5x trailing multiple where less has to go right to reach acceptable returns.
- GitLab: that growth stabilises in the mid-teens and the FCF margin expands to 24%, despite the deceleration from 26% to 21% and despite Microsoft’s GitHub competing directly. The high case effectively requires the growth trend to reverse.
- Samsara: that 20% revenue growth holds while the FCF margin roughly doubles from 14% to 25%, and that dilution stays contained without any identified buyback to offset it.
The gap between where each company stands today and where its middle case needs it to be in ten years is not a reason to walk away. It is the precise question you should be able to answer before committing capital.
Run this same process on any growth-stage software stock and you will get ranges just as wide. Narrowing them takes ongoing monitoring that no single snapshot can deliver.
This article is for informational purposes only and should not be considered financial advice. Investors should conduct their own research and consult with financial professionals before making investment decisions. Past performance does not guarantee future results, and the financial projections discussed here are scenario-based estimates subject to market conditions and various risk factors.