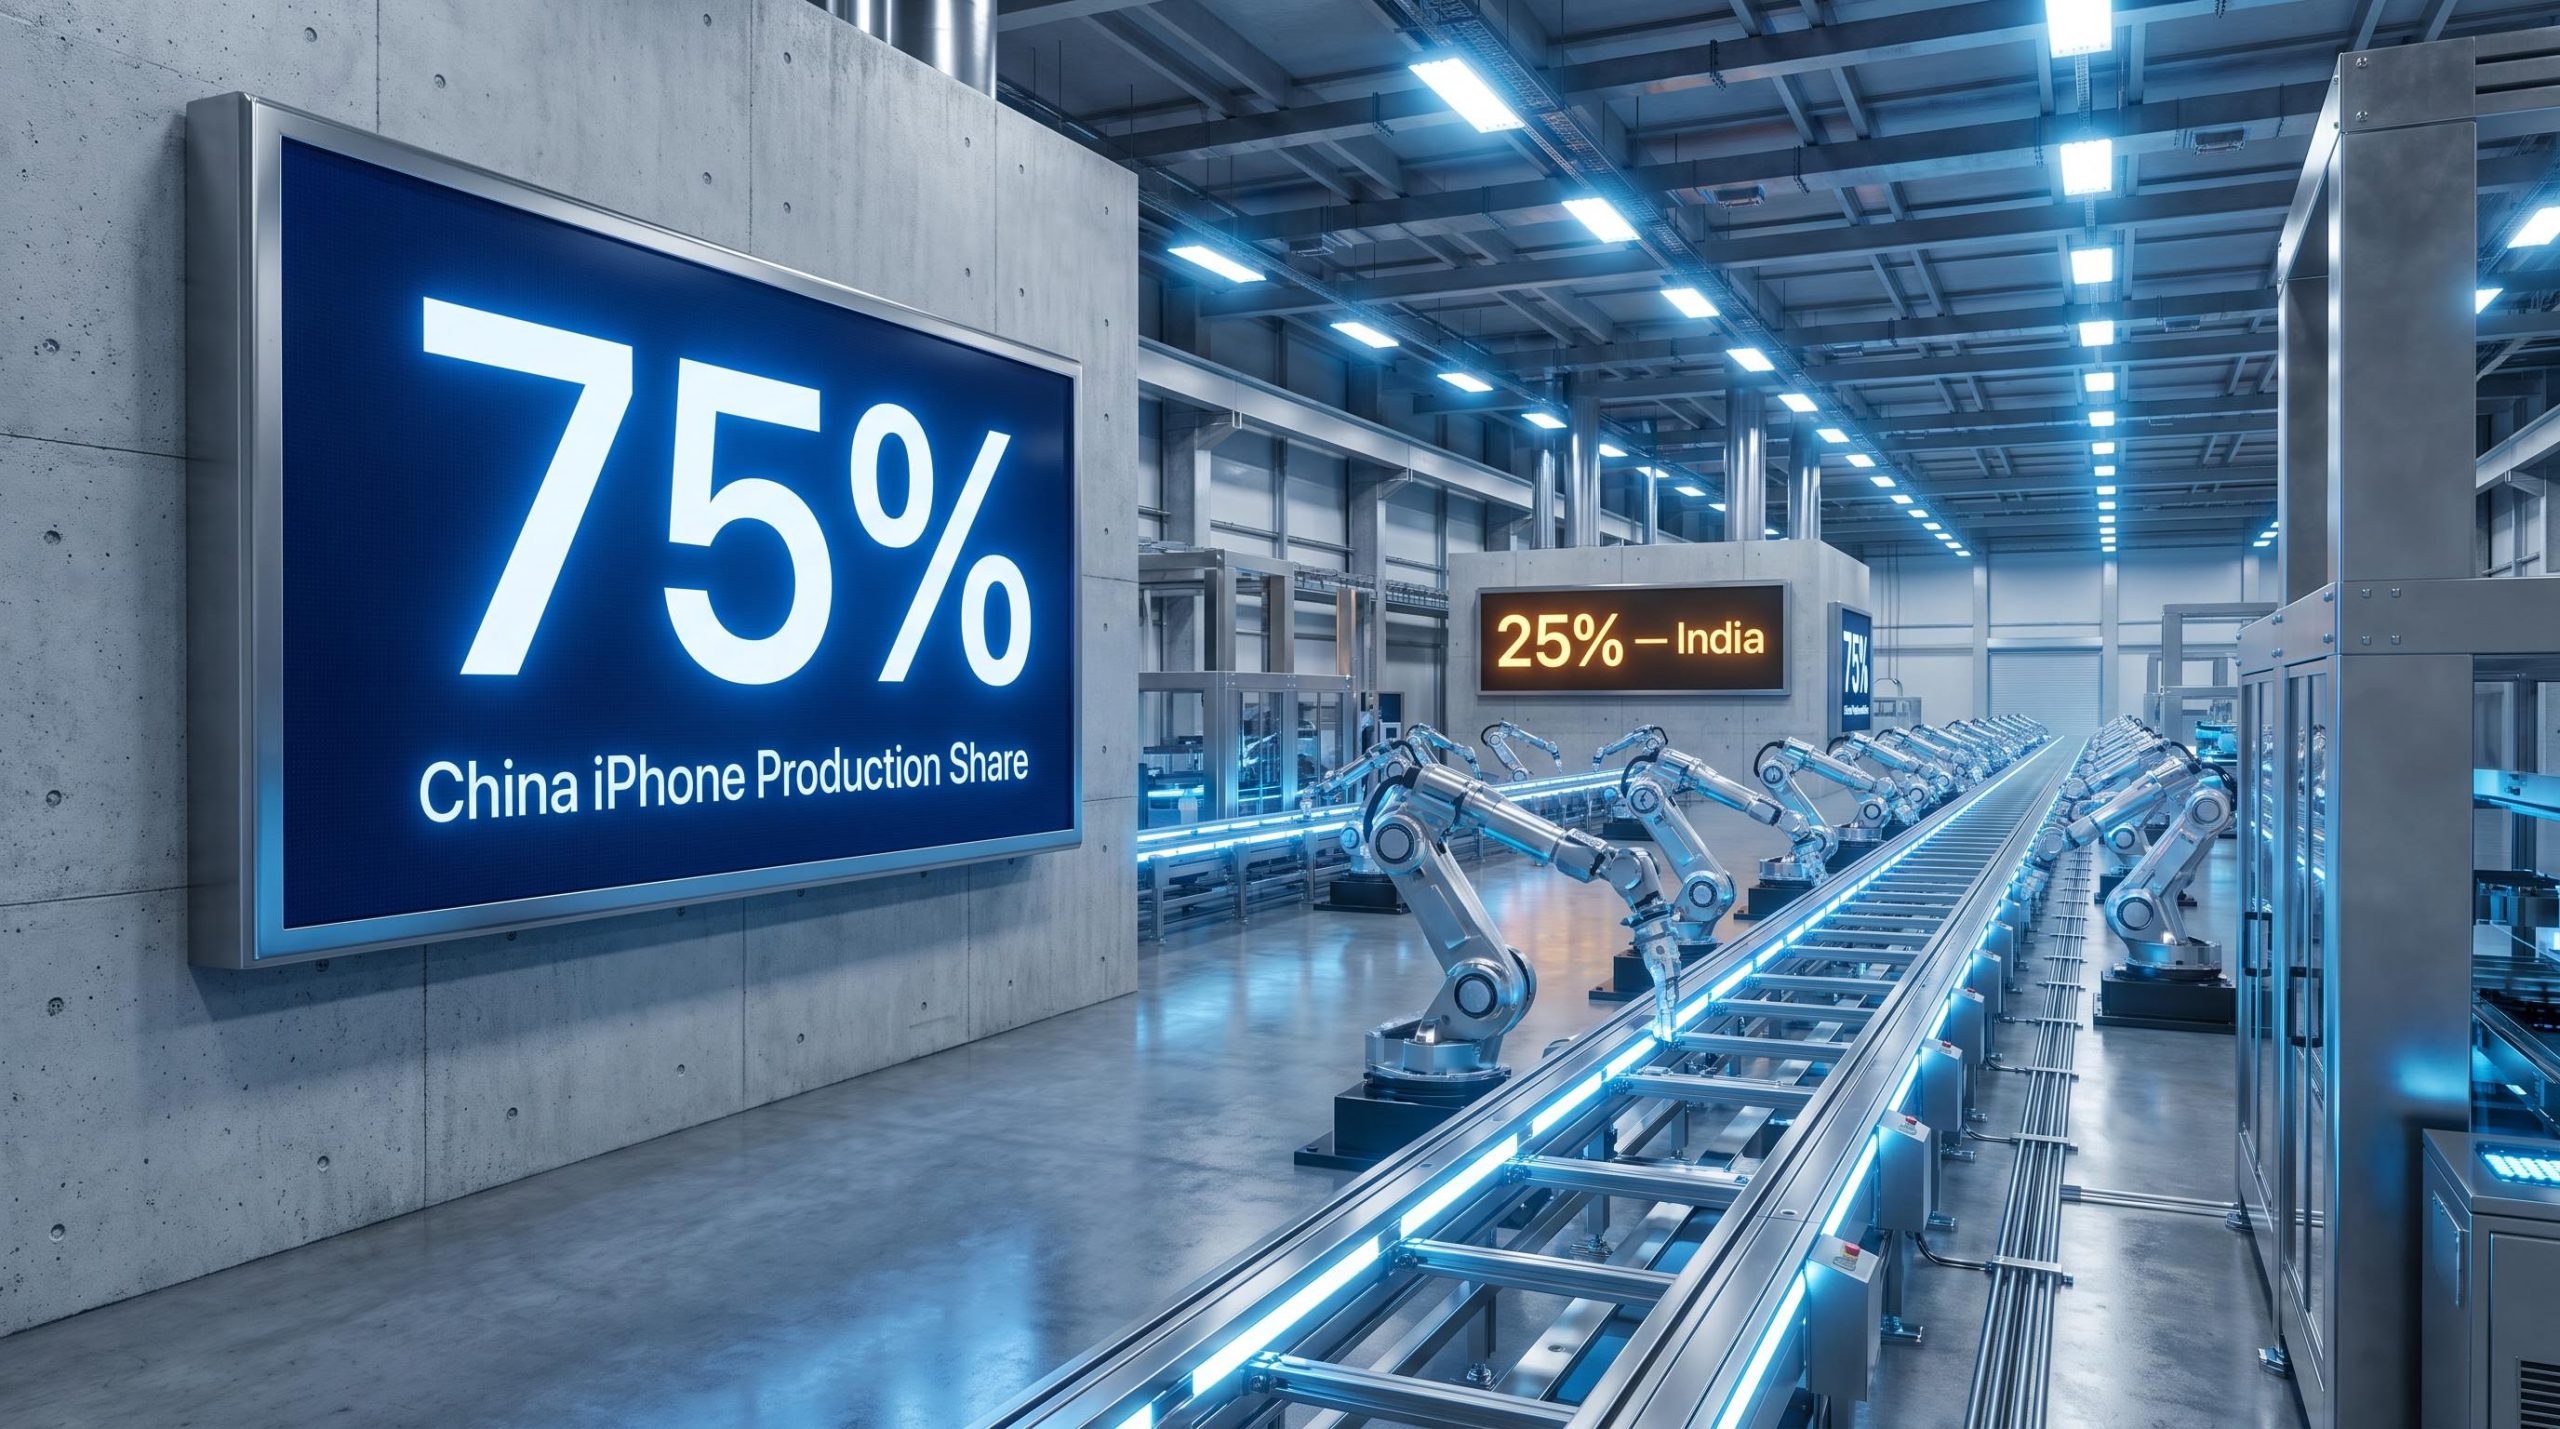
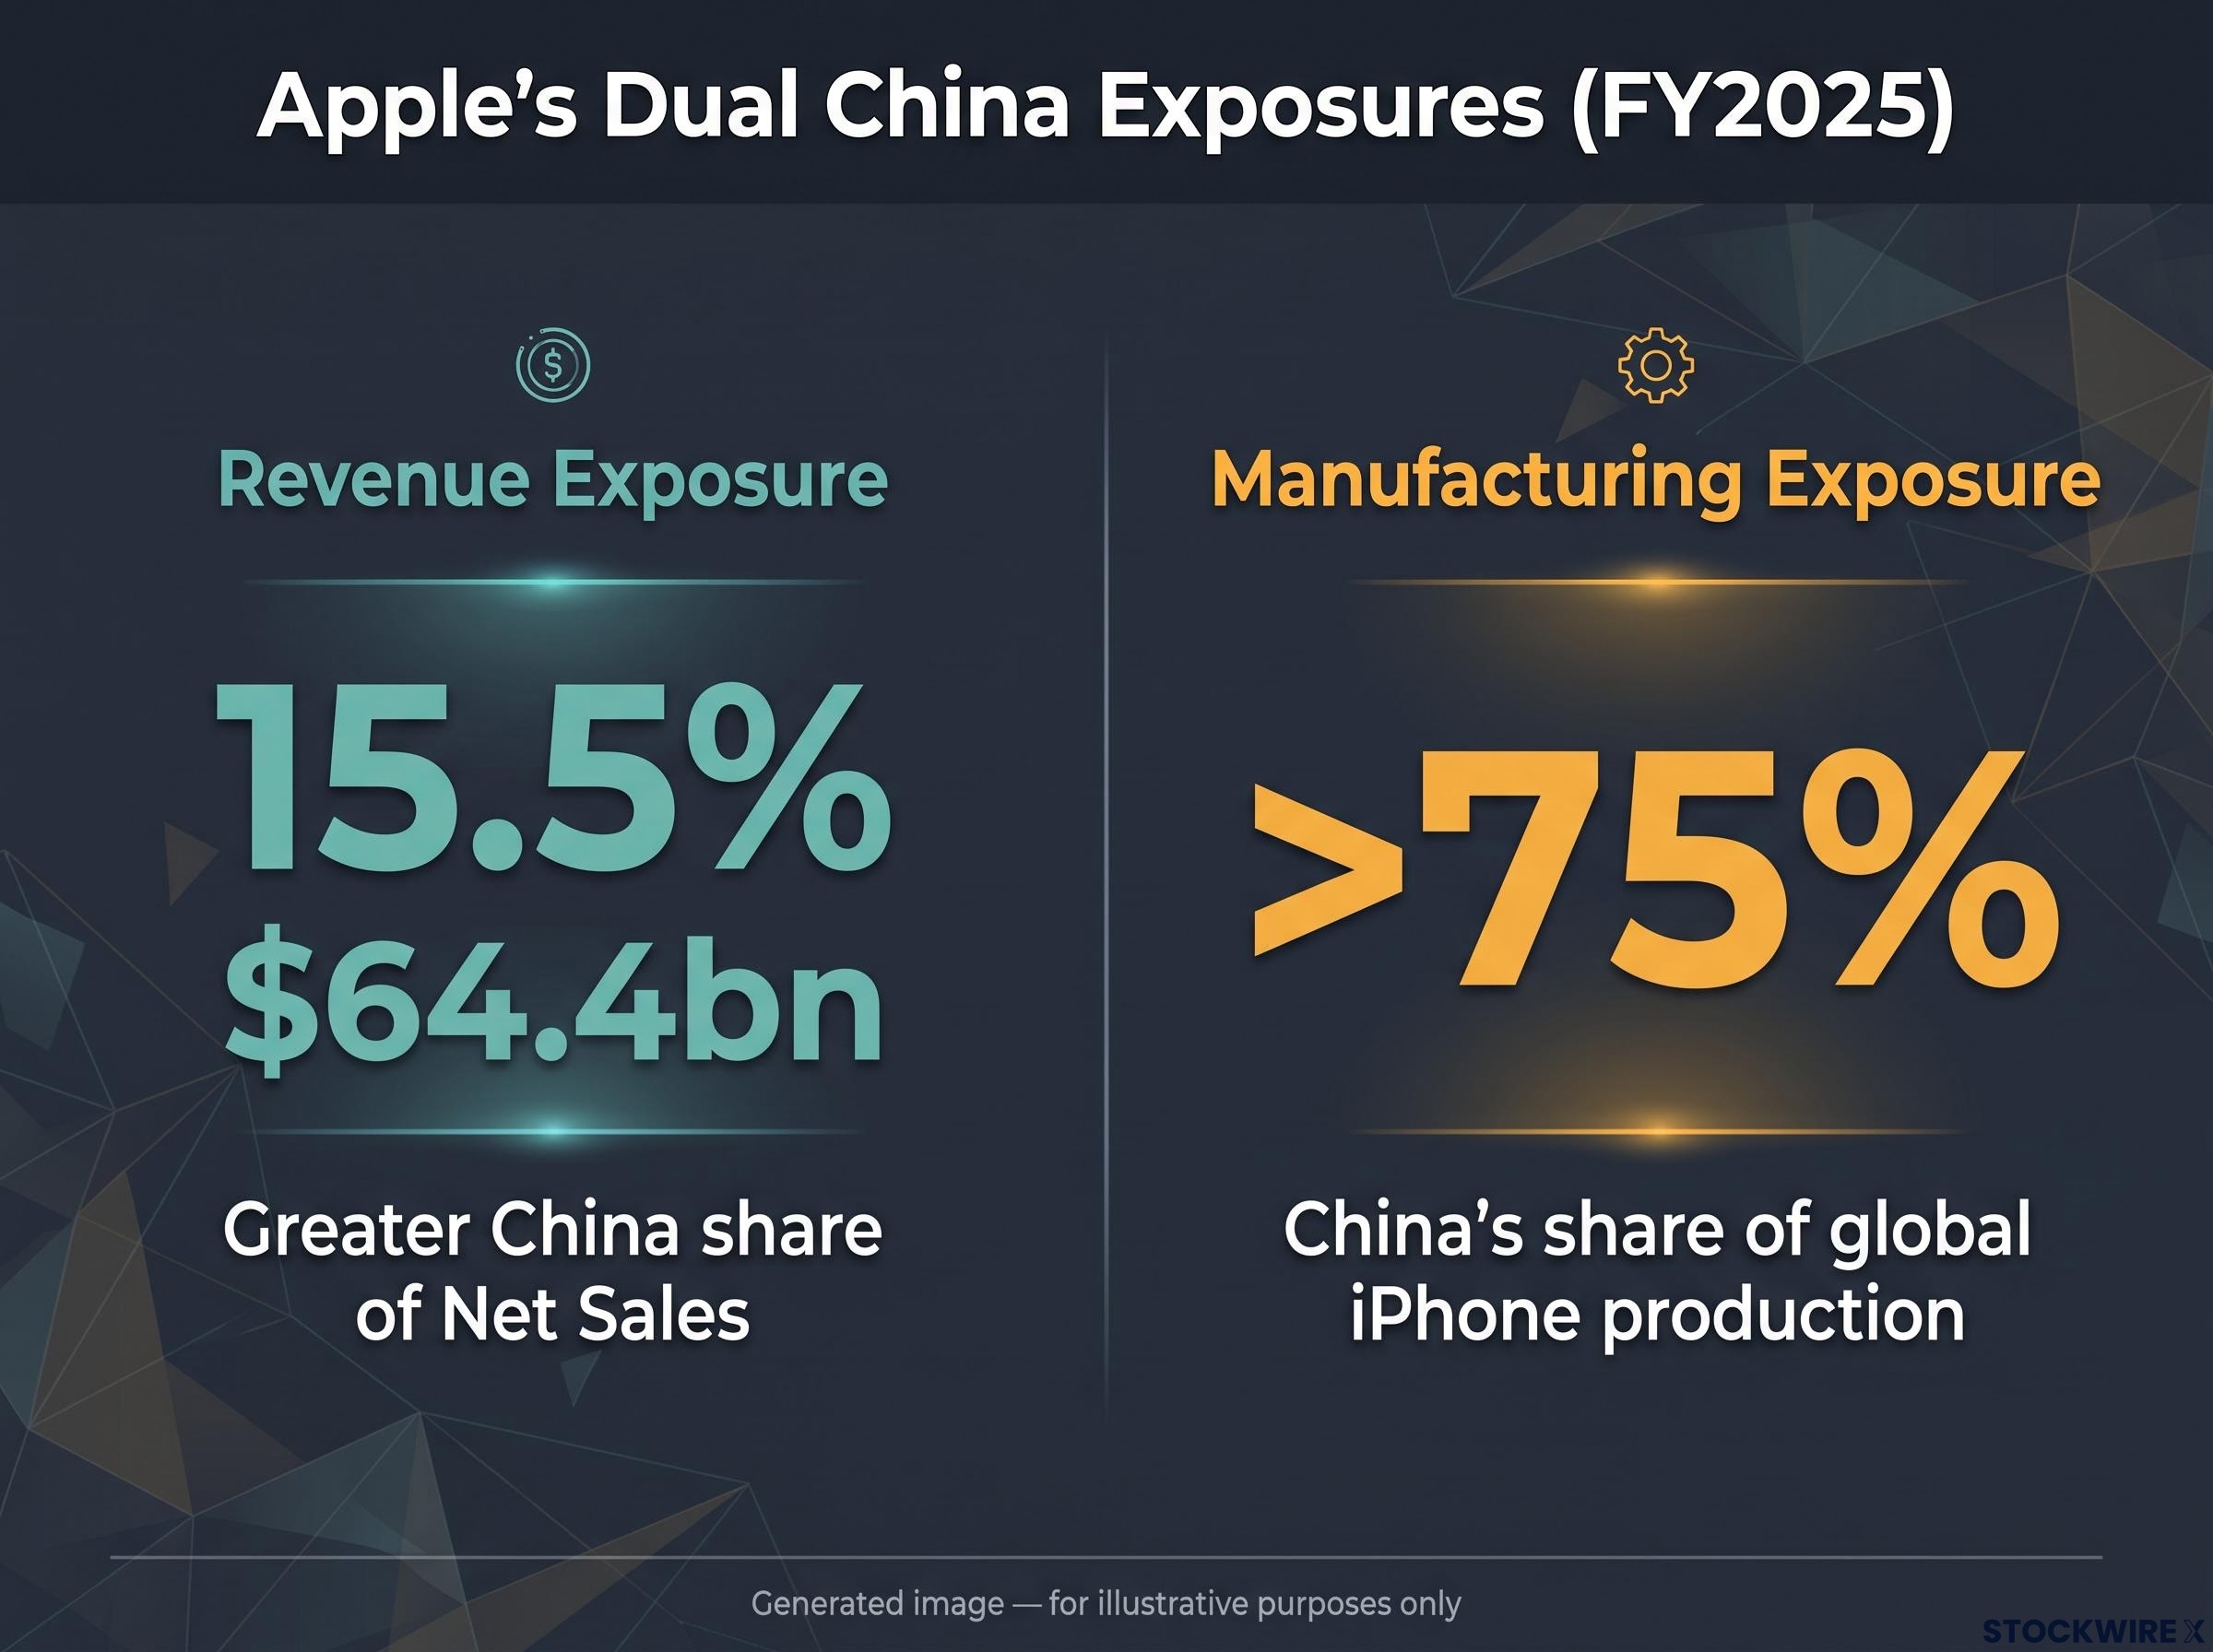
Greater China accounts for roughly 15.5% of Apple’s net sales. That figure gets quoted in almost every discussion of Apple’s China risk. The number that matters far more, China’s share of global iPhone production at more than 75%, is almost never mentioned first.
That gap is the whole story. Apple’s Greater China revenue has slipped across four fiscal years, from $68,370m in FY2021 to $64,377m in FY2025, yet periodic quarterly rebounds keep generating headlines that suggest a turnaround. At the same time, Apple has pushed Indian assembly to roughly 55 million units in 2025, about a quarter of global output, with Tata Electronics overtaking Foxconn as the country’s largest iPhone assembler as of May 2026.
These are two separate stories that get told as one. This analysis gives you a precise framework for separating Apple’s demand-side China exposure from its supply-side China exposure, and for judging whether the India build-out addresses both, neither, or only one of them. Treat it as a sharper lens for risk assessment, not a buy-or-sell verdict.
What Apple’s China revenue actually shows across four fiscal years
Start with the raw trajectory, because the direction only becomes obvious when the years sit side by side.
In FY2021, Greater China net sales were $68,370m. By FY2023 they had climbed to $72,559m, the high-water mark in this window. Then the slide began: $66,952m in FY2024, a drop of roughly 8%, followed by $64,377m in FY2025, down a further 4%.
Read as a single line rather than four data points, the picture is a market where Apple is gradually losing ground. This matters because the most recent quarter tells a very different-looking story.
For the quarter ended December 27, 2025, Greater China net sales jumped to $25,526m, up sharply from $18,513m in the prior-year quarter. Taken alone, that looks like a decisive recovery.
It is not, at least not yet. A single strong quarter does not reverse a four-year contraction, and treating one earnings beat as a structural turn is the most common error in assessing China exposure.
The Q1 2026 iPhone market share recovery adds a layer of complexity to the four-year China revenue decline: Apple grew shipments in China approximately 20% year-over-year in Q1 2026, even as the broader global smartphone market contracted 6%, raising the question of whether recent quarterly strength reflects a structural shift or a temporarily favourable competitive environment.
| Fiscal Year | Greater China Net Sales (USD bn) | Year-on-Year Change |
|---|---|---|
| FY2021 | $68.4bn | Baseline |
| FY2023 | $72.6bn | Peak in window |
| FY2024 | $67.0bn | Approximately -8% |
| FY2025 | $64.4bn | Approximately -4% |
The cause anchors the trend in product demand rather than currency swings or pricing tweaks.
Apple’s FY2025 Form 10-K attributes the Greater China decline primarily to lower iPhone sales, partially offset by higher Mac sales.
For proportional context, Americas net sales reached $178,353m in FY2025, roughly 43% of Apple’s total. What the four-year line tells you is that China is a market where Apple is slowly ceding share, and understanding that slope is the precondition for reading any single quarter correctly. One rebound is noise until several quarters make it a trend.
When big ASX news breaks, our subscribers know first
The risk that the revenue number does not capture
Geographic concentration risk at Apple splits into two structurally separate exposures, and conflating them produces a badly distorted picture.
The first is where Apple sells its products. The second is where Apple makes them. These are not the same risk, and they are not the same size.
- Revenue exposure: Greater China is approximately 15.5% of FY2025 net sales, roughly $64.4bn of an implied total near $414bn. A demand slowdown in China hits the China segment.
- Manufacturing exposure: China accounts for more than 75% of global iPhone production in FY2025. India has risen to approximately 25%, up from around 18% in 2024. A production disruption in China hits everything.
That second dimension is the one the revenue figure cannot show you.
A disruption to Chinese production would affect Apple’s global revenues, not just its China-segment revenues.
The logic is direct. iPhones assembled in China are shipped and sold worldwide, so a factory shutdown, a regulatory intervention, or a geopolitical shock in China would choke supply to every market at once. A 15.5% revenue segment is a manageable dent. A 75%-plus production base is a systemic dependency, and the two should never be weighed as if they carried equal weight.
Why the 10-K risk disclosure language matters here
This is not analyst speculation or media extrapolation. Apple’s own Form 10-K explicitly identifies the concentration of manufacturing and supplier operations in China as a risk factor, flagging exposure to regulatory changes, geopolitical tensions, and supply disruptions.
Formal risk-factor disclosure in a 10-K carries legal weight. It represents management’s own acknowledgement of material exposure, filed under securities regulation, not a commentator’s inference.
For you, the practical takeaway is a recalibration. Any risk assessment built primarily on the 15.5% revenue share is anchored to the wrong number. If you want to understand what a China shock does to Apple, the production figure is the one to weight most heavily, and it is worth asking the same question of any large-cap company with a geographically concentrated supply chain.
The same analytical discipline applies across geographically concentrated supply chains more broadly: TSMC’s dominance of leading-edge chip production below the 5nm node creates a structurally similar single-country dependency to Apple’s China manufacturing base, and the portfolio implications of a disruption in either case extend well beyond any single company’s revenue segment.
India as a demand market: what 10% market share actually means
Apple holds roughly 10% of India’s smartphone market. On its own, that sounds modest, even discouraging for a company that dominates premium segments elsewhere.
The number reads differently once you look at the structure beneath it. That 10% is concentrated almost entirely in the premium tier, in a market where the vast majority of volume sits in price bands Apple does not compete in.
Market researchers including Counterpoint Research, IDC, and Canalys consistently describe India as highly price-sensitive and dominated by Android brands such as Samsung, Xiaomi, Vivo, and Oppo in sub-$300 tiers. Apple’s strength sits above the $400-$600 line, and its recent opening of a sixth retail store in Mumbai reflects continued investment in affluent, urban demand.
The structural ceiling on that position comes from a few durable factors:
- Income levels that keep most buyers below Apple’s price points
- Deep price sensitivity across the mass market
- Entrenched Chinese-brand visibility in the sub-$300 tiers Apple does not address
The bullish counter-case is not hollow, though:
- Aspirational demand for the brand among a rising middle class
- Growing incomes and wider financing and trade-in options
- Locally assembled iPhones that can modestly improve affordability
- Services and wearables lock-in that supports premium pricing over time
Neither list cancels the other. India is a real growth story, but it operates on a longer horizon than manufacturing diversification, and it is incremental optionality rather than a near-term substitute for China revenue at comparable scale. Greater China generated $64.4bn in FY2025; expecting India’s roughly 10%, premium-skewed base to close that gap soon sets you up for disappointment.
Premium segment concentration and what it implies for revenue quality
Because Apple’s India revenue clusters in higher-priced tiers, revenue-per-unit runs well above what a 10% unit share suggests. The quality of that revenue is better than the headline share implies.
The flip side is that expanding into mass-market volume would require pricing concessions Apple has historically declined to make. Growth in India is therefore more likely to come from premium-segment depth and rising services attach rates among existing iPhone owners than from a fight for the sub-$300 buyer.
For a genuinely long view, the demographic logic holds. India is among the eight countries projected to account for more than half of global population growth over roughly the next 30 years, which is why emerging-market engagement makes strategic sense even where near-term monetisation stays constrained. The right question is not whether India rescues this year’s China number. It is whether India compounds as structural optionality over a 10-to-20-year window.
What the India manufacturing build-out signals to investors beyond the tariff narrative
The surface reading is simple and probably familiar: Apple is moving production to India to dodge tariffs on China-made goods. That is real, and it is part of the story.
It is not the most useful part. The scale and speed of the shift point to something deeper than tariff hedging.
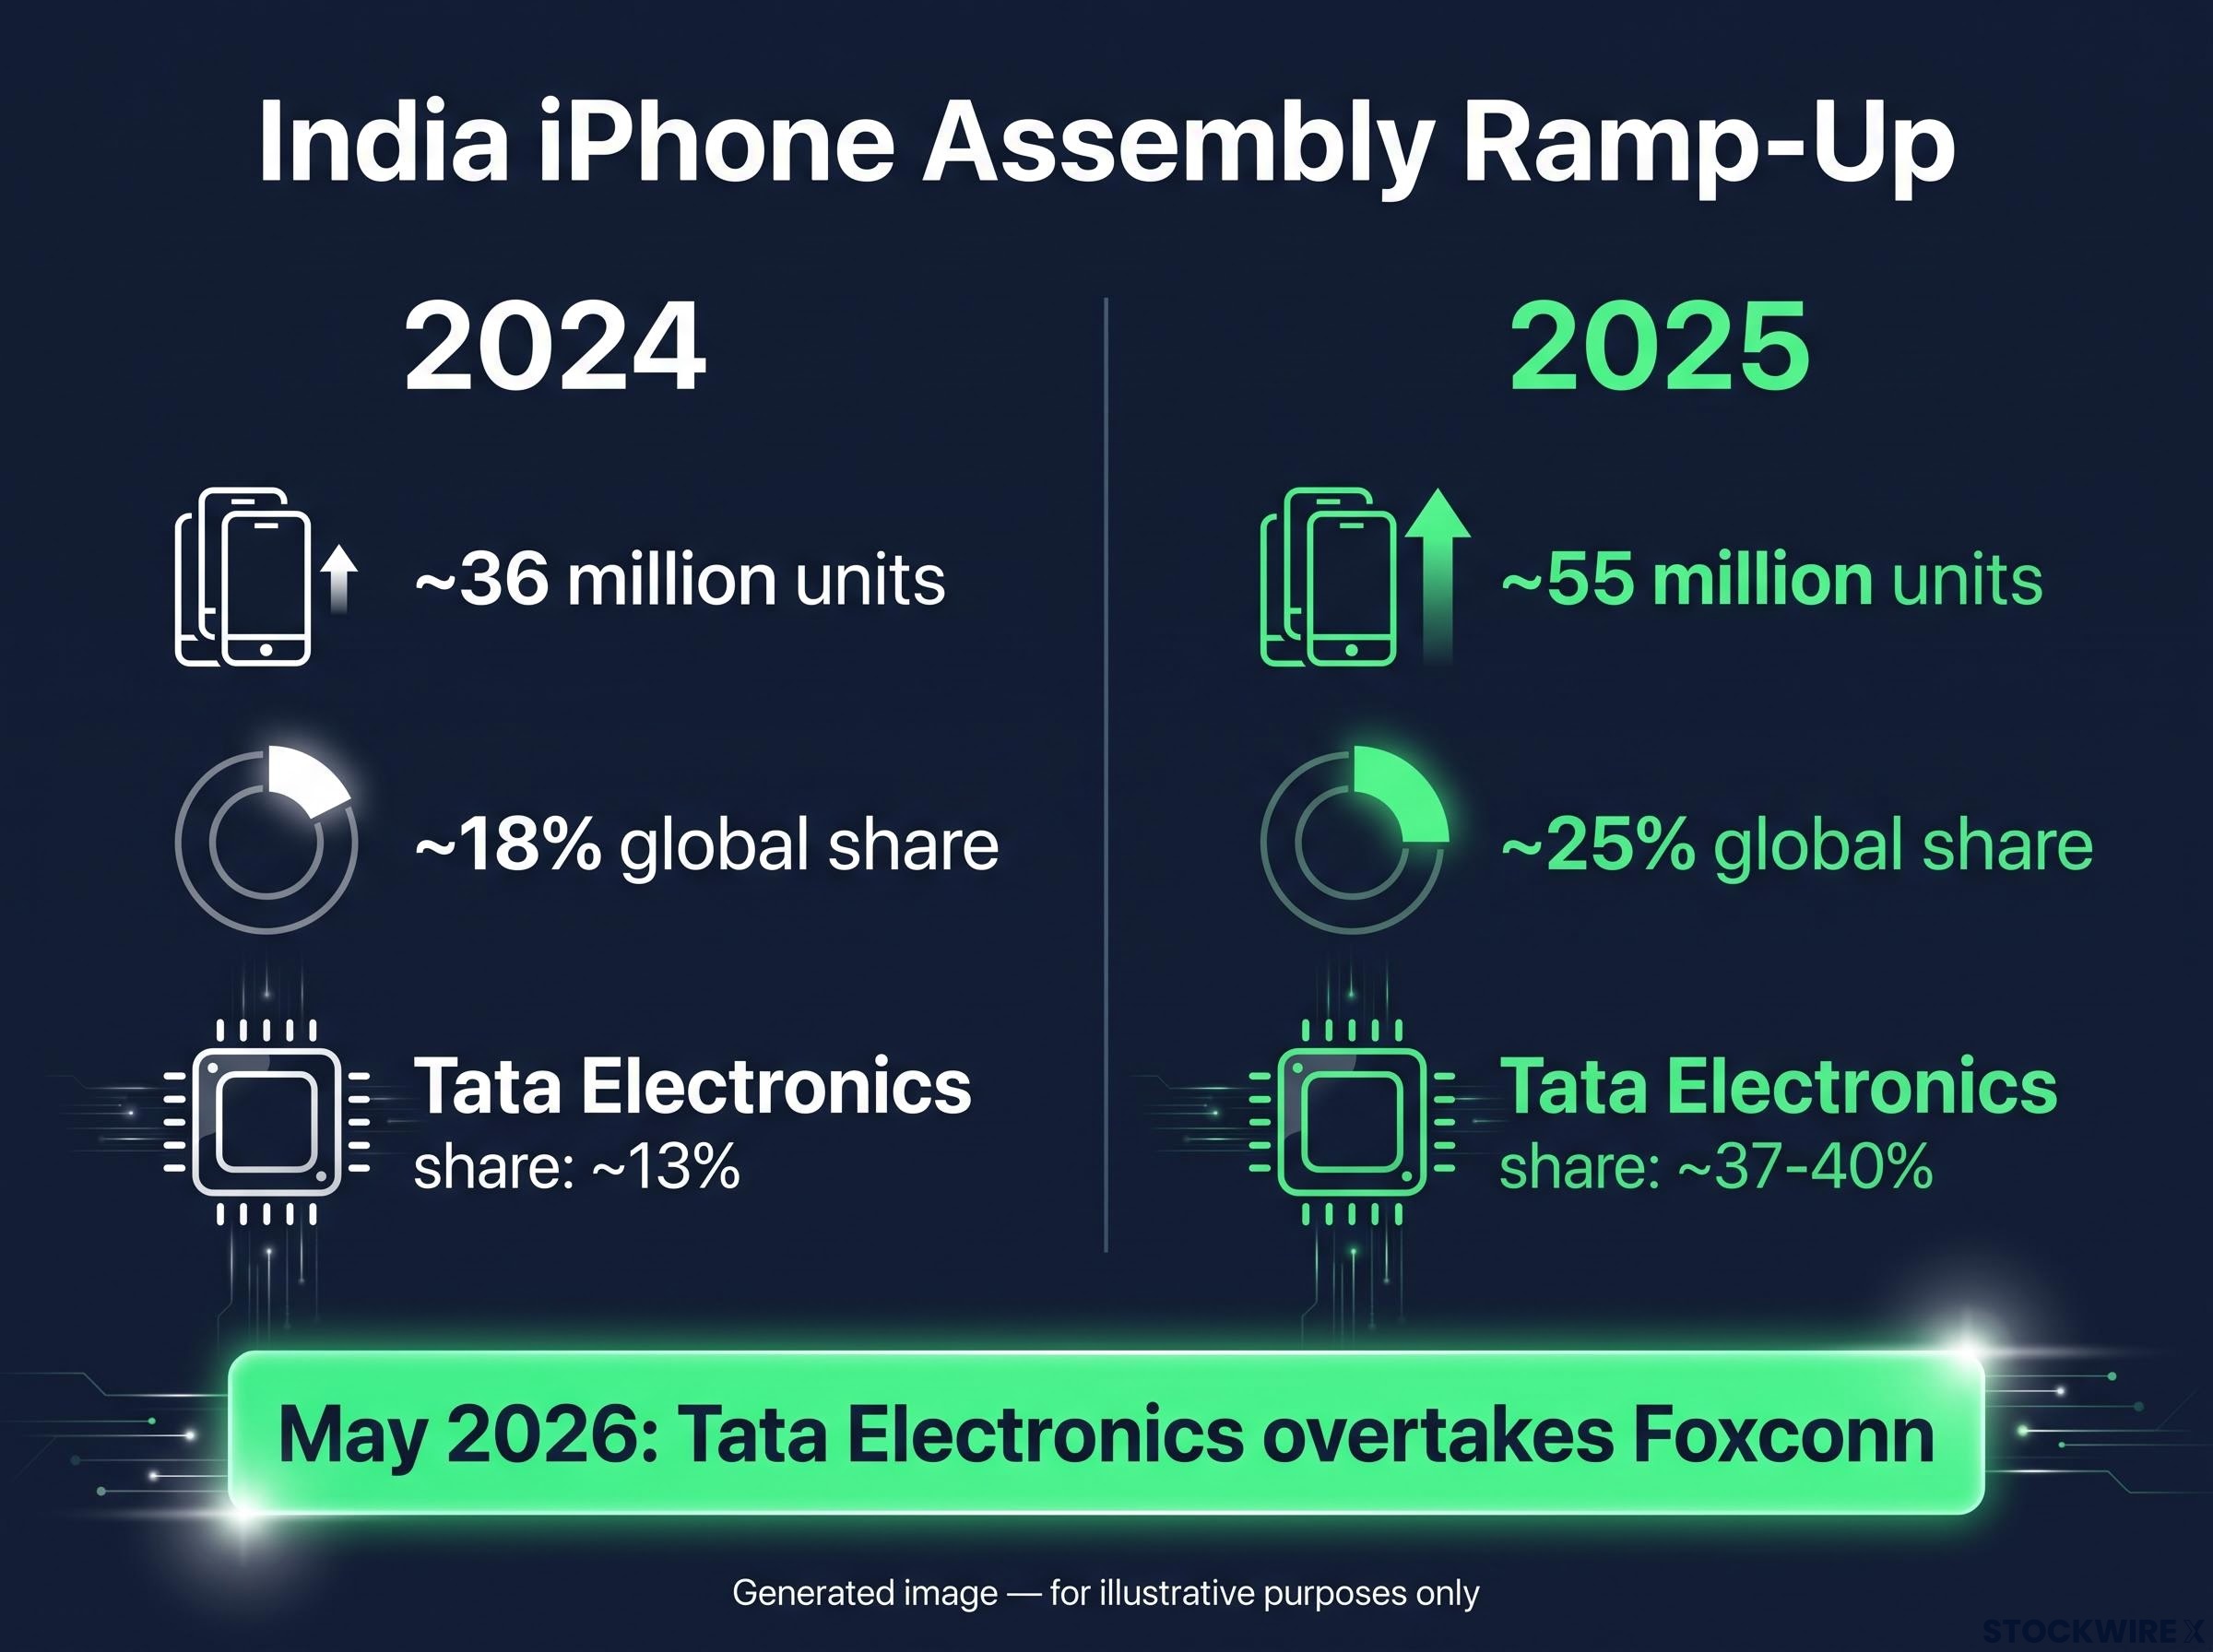
Apple assembled approximately 55 million iPhones in India in 2025, up roughly 53% from around 36 million in 2024, per Bloomberg-sourced reporting. Tata Electronics lifted its share of India’s iPhone exports from about 13% in 2024 to roughly 37-40% in 2025, and as of May 2, 2026 overtook Foxconn as Apple’s largest India assembler. Apple has stated it aims to shift the bulk of U.S.-bound iPhone production to India by the end of 2026.
| Year | Units Assembled (millions) | Year-on-Year Change | Share of Global Output |
|---|---|---|---|
| 2024 | ~36 | Baseline | ~18% |
| 2025 | ~55 | ~+53% | ~25% |
For the 12 months ended March 2025, India assembly was worth roughly $22bn. This is structural rebalancing, not a temporary workaround.
History gives you a way to read the signal. Supply-chain diversification of this magnitude tends to function as an early warning indicator of elevated country-risk perception:
- Samsung: Its shift from China toward Vietnam and India cut cost and risk but coincided with a sharp market-share decline inside China.
- TSMC: Its US and Japan fab investments were read as both risk mitigation and a source of higher capital intensity and margin pressure.
- Dell and HP: Their “China+1” moves into Vietnam and Mexico were interpreted as signals of heightened country risk even when near-term financials held steady.
- Apple’s own precedent: Its earlier diversification across multiple Chinese provinces showed that resilience gains take years and heavy capital spending.
What this tells you is that Apple’s internal assessment of China concentration has moved materially, and that judgement is worth weighing even before any tariff impact shows up in the financials. The relocation decision is the leading indicator; the reported numbers are the lagging one.
There is a catch worth holding onto.
If Apple routes the majority of U.S.-bound iPhones through India, the question becomes whether it has swapped one single-country dependency for another rather than achieving genuine geographic resilience.
Holding both risks in the same frame
The two-part framework, once separated, is easier to act on than the blended version most coverage offers.
China poses a manageable revenue risk at roughly 15.5% of net sales, and a far more serious manufacturing-disruption risk that the India build-out only partially addresses. India, in turn, offers a demand-side opportunity on a long horizon that should not be priced as a near-term replacement for China revenue.
Even rigorous analysis leaves real questions open. Whether India’s manufacturing ecosystem can match China’s decades of integration depth is unresolved. So is whether Apple can hold brand and political neutrality in both countries as geopolitical friction rises, and whether the end-of-2026 U.S.-bound production target is achievable without quality or cost trade-offs. India’s heavy reliance on the Production-Linked Incentive (PLI) scheme, a government programme that pays manufacturers for hitting output targets, adds a policy variable outside Apple’s control.
So the honest close is a monitoring checklist, not a verdict. Across the next two to three annual reporting cycles, these are the variables worth tracking:
- India’s share of global iPhone production in the next two annual cycles
- Greater China revenue trajectory through FY2026 and FY2027, against the FY2021-FY2025 baseline
- India retail store count as a consumer-demand signal
- PLI scheme continuity and any policy reversals
- Quality or cost disclosures tied to the India assembly ramp
A framework you can return to each cycle is more durable than a point-in-time call. The outcome here depends on execution variables that are not yet settled, and that is exactly why you watch them rather than predict them.
For investors wanting to see how these structural questions played out in the most recent quarterly numbers, our full explainer on Apple’s Q2 2026 earnings report covers the record revenue result alongside the unresolved AI monetisation gap and CEO succession timeline that caused the stock to fall despite the beat.
This article is for informational purposes only and should not be considered financial advice. Investors should conduct their own research and consult with financial professionals before making investment decisions.
Past performance does not guarantee future results. Financial projections are subject to market conditions and various risk factors. Forward-looking statements are speculative and subject to change based on market developments and company performance.