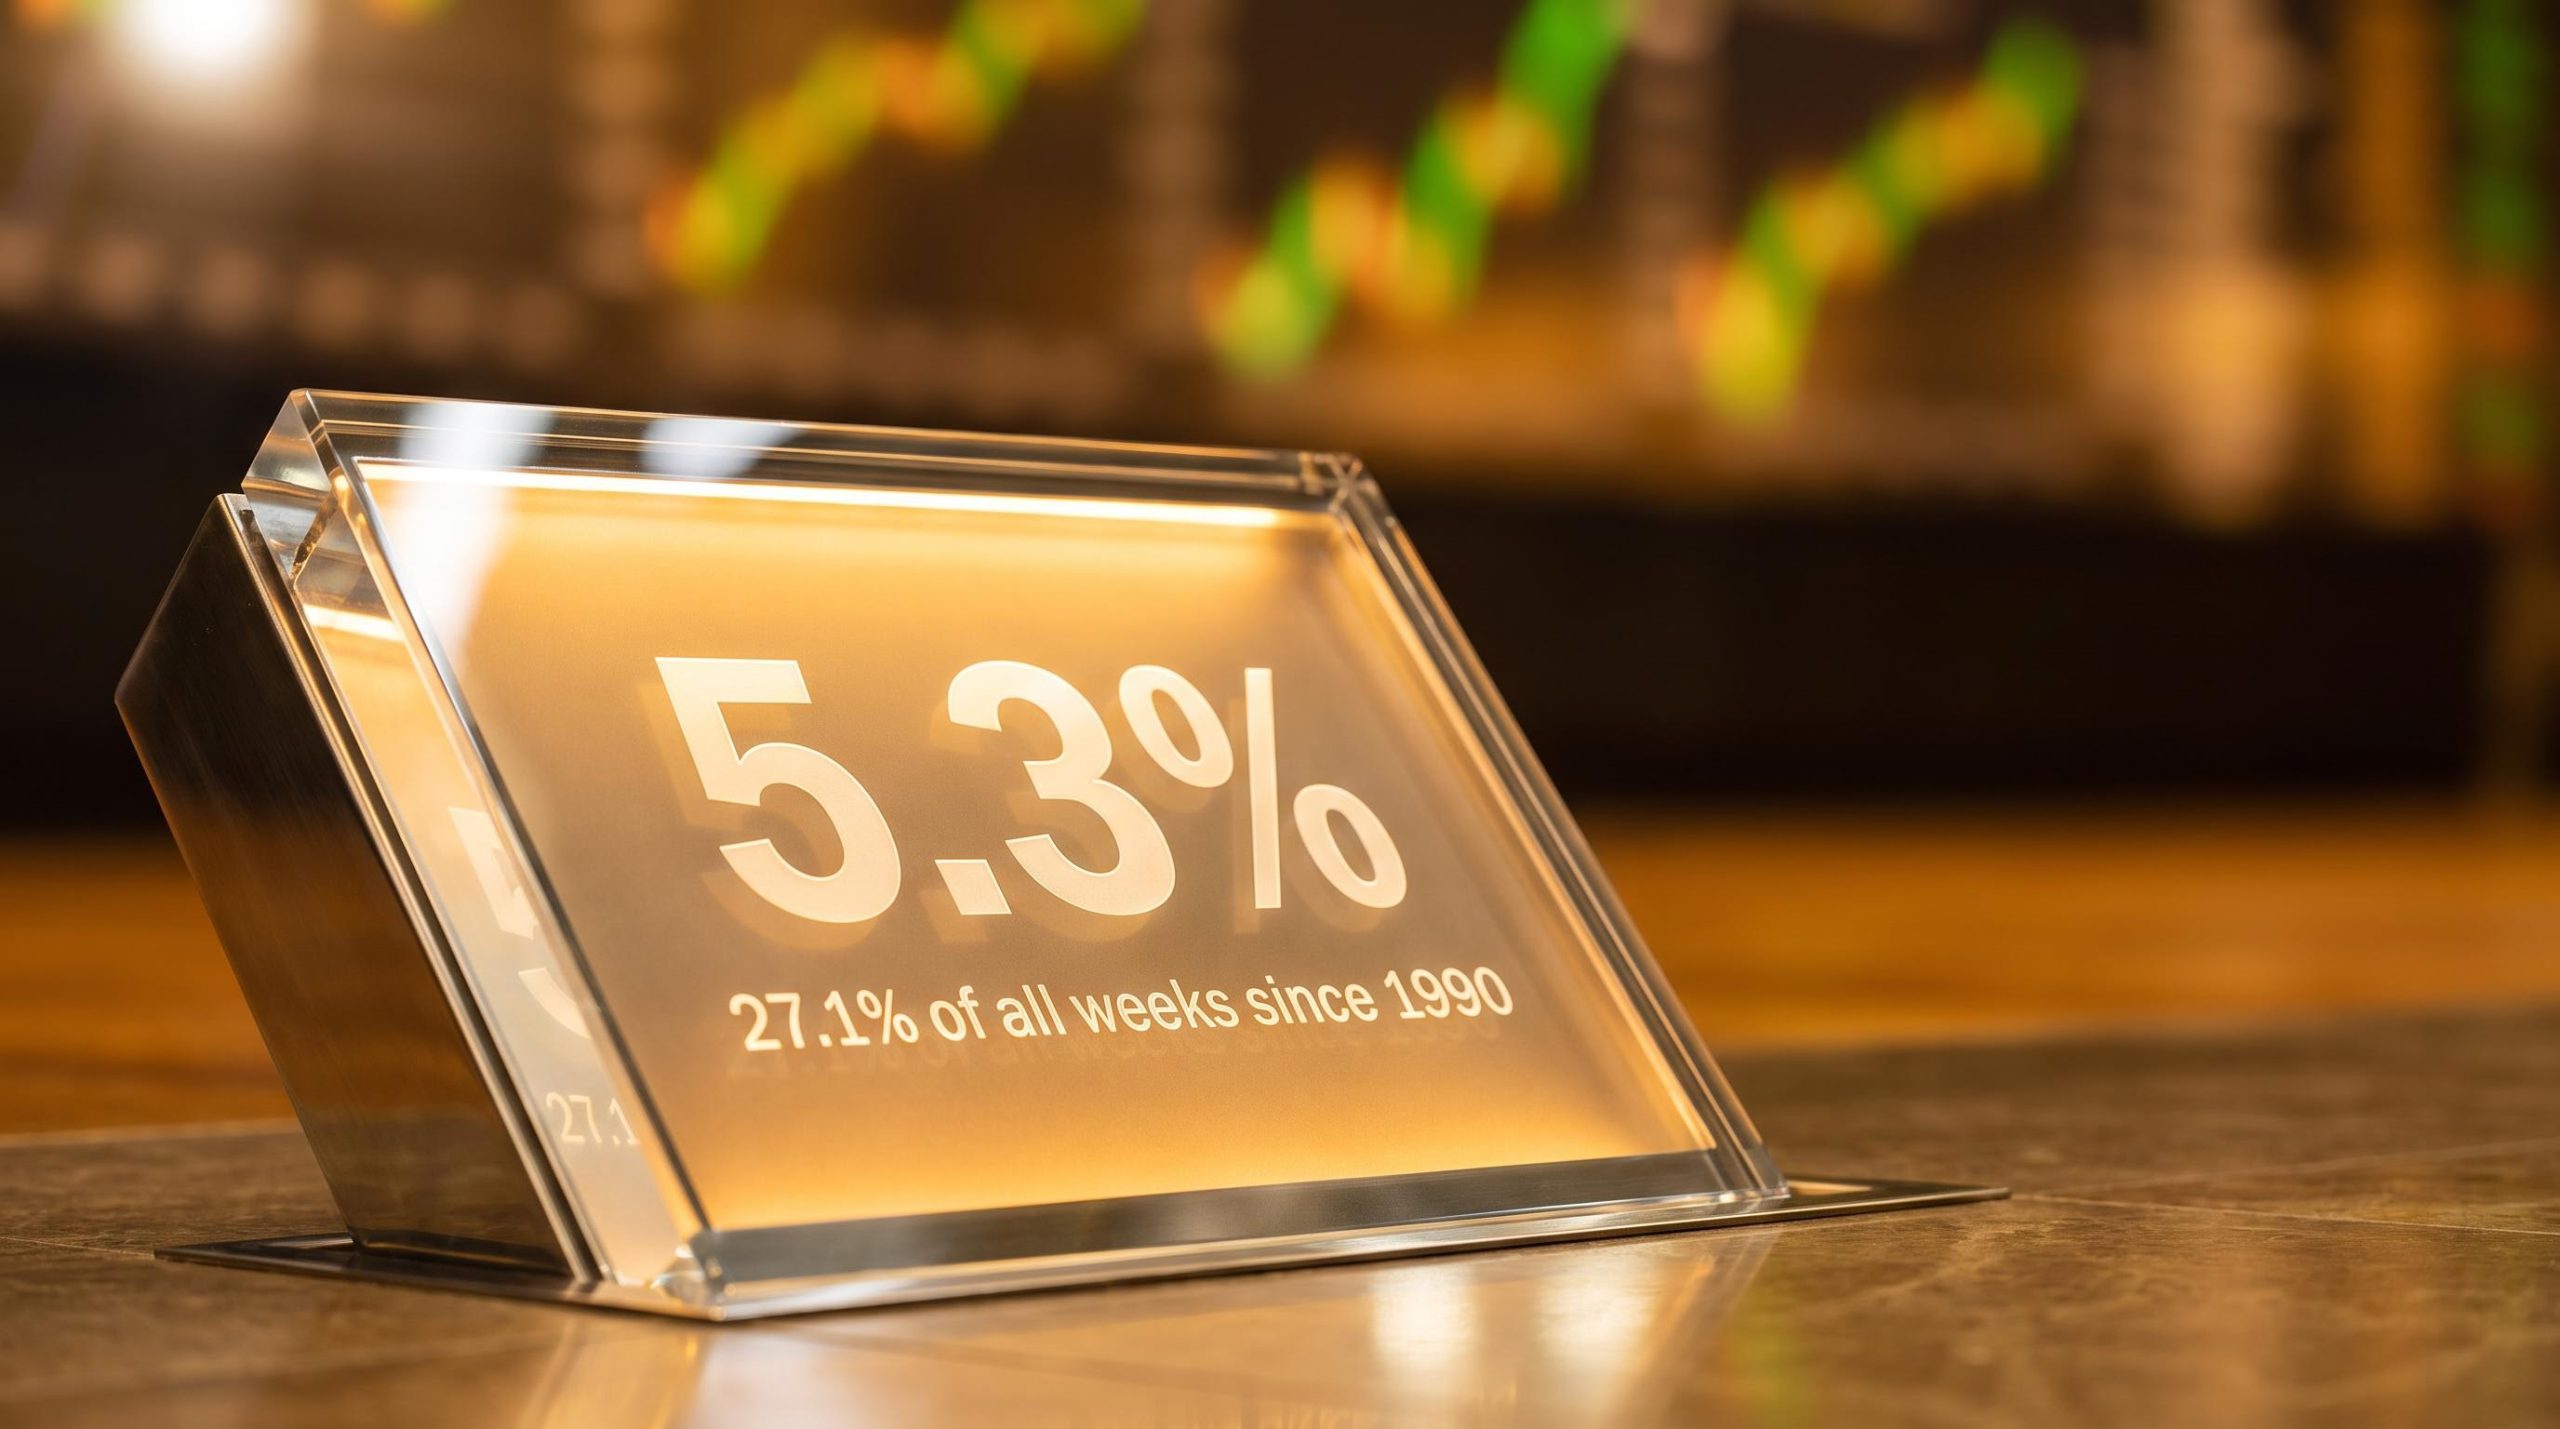
Most Australian investors look at a 10-year bond yield above 5% and see a warning light for shares. The historical record says something less dramatic: 5% is not the exception, it is the single most common yield environment the ASX has known, present in more than one in four weeks since 1990.
That gap between perception and data matters right now. Australian 10-year government bond yields sit at roughly 5.3% as of mid-September 2026, near 15-year highs, and the dominant market narrative treats that level as a reason to trim equity exposure. This analysis tests that narrative against 36 years of evidence.
Here is what the data actually show about ASX bond yields, and why the level on the screen tells you far less than what is driving it. The aim is to move you past the simple “high yields mean bad ASX returns” heuristic and toward assessing 2026 as a specific episode with its own drivers, rather than a rerun of every high-yield period before it.
Why 5% yields feel alarming but are historically unremarkable
The discomfort is understandable. For most of the last decade, an investor watching the ASX grew used to yields well below 3%, and a jump to 5.3% feels like the ground shifting.
It is not. According to historical bond and equity market data analysed by Kerry Sun at Market Index, Australian 10-year yields have sat at the 5% level during 27.1% of all weeks since 1990. That makes it the most frequently observed yield state across the entire 36-year record.
The RBA historical bond yield data confirms this long-run picture, with capital market yield series extending back to the late 1960s showing that the post-GFC low-yield decade was the genuine outlier across Australia’s recorded interest rate history.
The anchor statistic Yields at the 5% level have been present in 27.1% of all weeks since 1990, more than any other yield environment on record.
The current reading looks elevated only against a recent, unusual backdrop. Here is where the market sits today.
- Australia’s 10-year yield is around 5.3% as of 18-19 September 2026, per Trading Economics and Investing.com.
- The yield broke above 5.2% on 2 September 2026, described at the time as a 15-year high.
- Over the longer horizon, IBISWorld shows the 10-year rate averaging about 4.61% for 2025-26.
What the post-GFC era distorted
The years following the Global Financial Crisis reset what “normal” felt like. A decade of sub-3% yields conditioned a generation of investors to treat cheap money as the baseline, when the fuller history says it was the anomaly.
What the frequency data tells you is that 5.3% represents a return to historical norms, not a departure from them. If you have calibrated your risk assessment to the idea that 5% yields are abnormal, you are working from a distorted baseline. Correcting it is the first step toward reading the current environment accurately rather than reflexively.
When big ASX news breaks, our subscribers know first
What the raw return averages hide about the 5% yield era
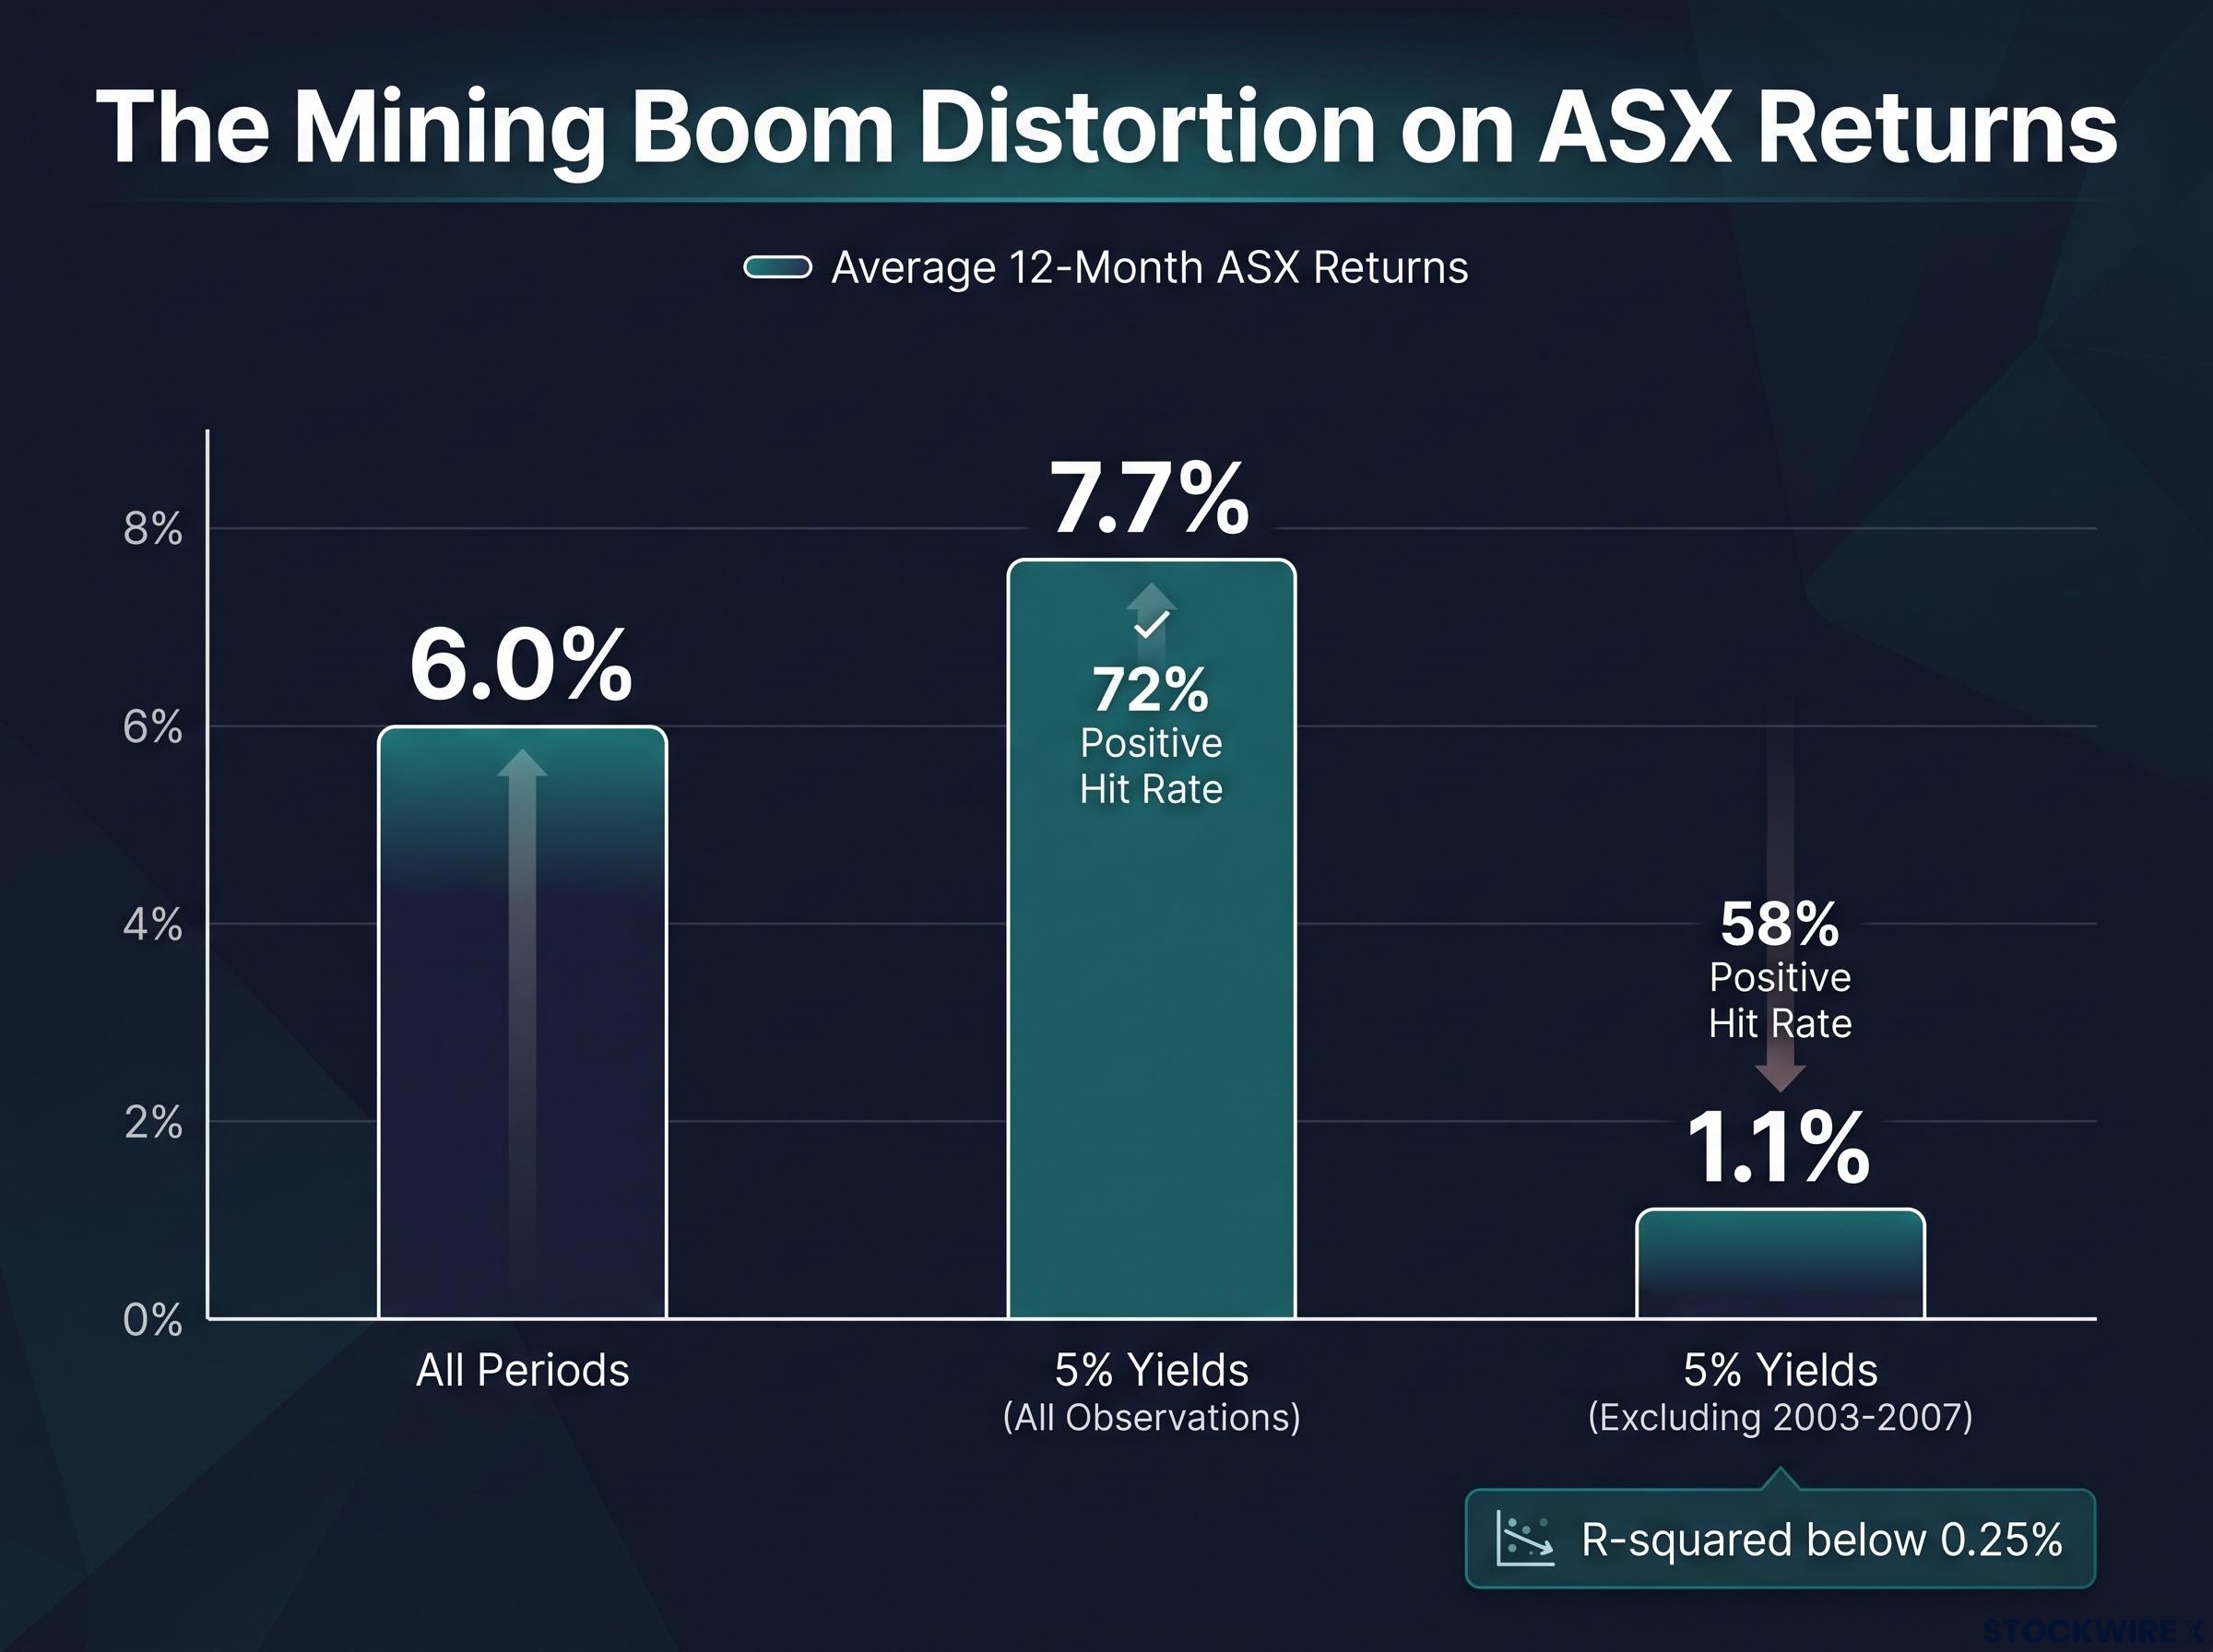
Start with the surface numbers, because at first glance they are reassuring. During periods when yields sat at the 5% level, average 12-month forward ASX returns came in at 7.7%, with a 72% positive hit rate. Both beat the all-periods average forward return of 6.0%.
Read only that far and the conclusion writes itself: high yields have historically coincided with above-average returns. But the average conceals a problem.
Nearly half of all historical observations of yields at the 5% level fall inside a single window: the 2003-2007 mining boom, when Australian commodity demand and earnings growth ran hot. The headline average is not describing a general relationship. It is describing one extraordinary episode dragging the numbers upward.
Strip that episode out, and the picture changes completely. Excluding the 2003-2007 mining boom, average 12-month forward returns at the 5% level fall to just 1.1%, with a positive outcome only 58% of the time.
| Period | Yield environment | Avg 12-month ASX return | Positive hit rate | Key driver |
|---|---|---|---|---|
| All periods | Every yield level | 6.0% | Not specified | Full-cycle baseline |
| 5% yield, all observations | Yields at 5% | 7.7% | 72% | Heavily weighted by mining boom |
| 5% yield, excluding 2003-2007 | Yields at 5% | 1.1% | 58% | Commodity super-cycle removed |
The adjusted 1.1% figure tells you the comforting numbers largely reflect a commodity super-cycle with no obvious equivalent today. Lean on the unadjusted average and you are drawing false comfort from a coincidence of timing.
The statistical anchor Market Index research finds the R-squared of yield levels as a predictor of ASX forward returns sits below 0.25% at every time horizon examined.
That is close to no predictive power at all. Historical averages can be deeply misleading when they blend together fundamentally different market episodes. The lesson is not that yields do not matter, but that the yield level on its own is not the signal you should be trading on.
Why yields bundle too many different forces to predict equity returns
If the level is not the signal, what is? The answer is that a bond yield is not a single fact. It is several macro forces compressed into one number, and those forces can point in opposite directions.
A high nominal yield can reflect strong real economic growth, which is generally supportive of equities. Or it can reflect high inflation expectations paired with weak growth, which is the opposite. Same yield reading, opposite equity outcomes. Northern Trust’s research makes the point directly: starting Treasury yields have no significant relationship with future equity returns, though they strongly predict future bond returns.
The discount-rate channel operates mechanically: as yields rise, the present value of future corporate cash flows falls, compressing price-to-earnings multiples even when underlying earnings are unchanged, which is why long-duration sectors such as property and utilities carry disproportionate exposure in the current environment.
So rather than asking whether 5.3% is high, the more useful questions are these.
- What is driving the yield: real growth, or inflation expectations?
- Which direction is inflation moving, up or down?
- What is the growth backdrop underpinning it all?
The inflation regime distinction
Direction turns out to matter more than level. Hartford Funds finds that equities outperform inflation roughly 90% of the time when inflation is low and rising, but only about 50% of the time when inflation is high and rising.
The falling side of the cycle looks very different. AllianceBernstein’s multi-asset work shows that when inflation is high but falling, equities can deliver strong positive real returns. The operative variable is not whether inflation is high, but whether it is accelerating or easing.
Markets repeatedly punish investors who treat inflation narrative noise as actionable signal: the S&P 500 advanced toward record highs in August 2026 precisely while alarming inflation commentary was at its peak, a pattern consistent with the broader finding that markets price the expected end of tightening cycles well before formal policy pivots arrive.
What is driving Australia’s yield in 2026
Apply that framework to the present, and the current move looks more constructive than a straight inflation scare. Haver Analytics notes the recent global rise in yields has been driven largely by higher real rates and term premia rather than inflation expectations, with equities holding up because growth surprises have been positive while inflation surprises stayed modest.
The Australian drivers blend structural and cyclical forces. AMP chief economist Shane Oliver attributes the yield backup to large budget deficits, heavy corporate borrowing for AI and data-centre infrastructure, higher-for-longer inflation, and rising Japanese yields unwinding carry trades. The cyclical layer, surging oil prices and RBA tightening expectations, sits on top of that.
In AMP’s Weekly Market Update on 11 September 2026, Oliver described bonds as “starting to get oversold,” while stressing the longer-run risk remains skewed toward further yield increases. For an Australian investor today, the point is that the question worth answering is not “are yields at 5.3%?” but “what is pushing them there?” The answer to that determines whether this environment is benign or threatening.
The episode framework: what the distinct historical yield periods actually show
History offers three sharp illustrations of why context, not the yield number, dictates the outcome.
The 1994 bond rout is the clearest case of yields dragging equities down. The RBA’s July 1994 Bulletin describes rising yields making shares less attractive and spilling straight into the equity market, producing broad, sharp price falls.
The 2003-2007 mining boom is the mirror image. Yields were elevated, yet the ASX delivered strong returns because commodity demand and earnings growth overwhelmed the yield headwind entirely.
Then there is 2026. Yields have climbed to similar levels, but the equity market has not buckled. CommSec reports the ASX 200 returned 2.8% in price terms and 5.9% in total net returns for FY2026 (July 2025 to June 2026). Trailing figures show the split between price and total return clearly: Investing.com’s Net Total Return index was up roughly 2.87% over the year to 10 September 2026, while Trading Economics recorded a price-only change of about -0.48% near 18 September 2026.
| Episode | Yield level | ASX outcome | Key driver | Lesson |
|---|---|---|---|---|
| 1994 bond rout | Rising sharply | Broad, sharp declines | Yields alone repriced equities | Yields can drive equity weakness |
| 2003-2007 mining boom | Elevated near 5% | Strong gains | Commodity demand, earnings growth | Growth can overwhelm the headwind |
| 2026 | Around 5.3% | Modest positive total return | Real growth, AI investment, full valuations | Assess on its own terms |
The resilience is not just local. Euronews reported in September 2026 that despite surging global bond yields, the S&P 500, STOXX 600 and Nikkei 225 all continued to gain, supported by strong growth, record earnings and heavy AI and data-centre investment.
What the contrast tells you is that 2026 resembles a growth-driven yield rise in mechanism, closer to the mid-2000s than to a 1994-style rout, even without a commodity super-cycle behind it. But one feature separates it from the mid-2000s: the starting valuation. Schroders’ Martin Conlon has characterised Australian share valuations as “pretty full.”
A reader-relevant risk signal With valuations described as “pretty full,” there is limited room for multiple expansion. That is the specific vulnerability 2026 carries that the mid-2000s did not.
Certain sectors sit directly in the firing line of higher discount rates.
- Listed property, exposed through long-duration cash-flow discounting.
- Utilities, for the same reason.
- Bond-proxy stocks generally, whose valuations lean heavily on long-term cash-flow assumptions.
What to watch instead of the yield number itself
The practical takeaway is to stop forming a view on whether 5.3% is “too high” and start assessing the three variables that actually decide whether a yield environment is benign or threatening.
- Inflation direction. High and falling supports equities; high and rising erodes real returns.
- The real growth backdrop. Yields rising on genuine growth are a very different signal from yields rising on inflation fear.
- The equity valuation starting point. Full valuations leave little cushion, whatever the yield does next.
Alongside those, three sector-level considerations apply right now.
- Bond-proxy sectors such as property and utilities remain the most exposed to rising discount rates.
- Dividend-paying stocks with yields above 5% face direct competition from bonds and must justify their payouts.
- High-yield cyclicals carry dual risk, both valuation compression and fundamental stress.
Defensive sector rotation in rising-yield environments is not uniform: bond-proxy defensives with stretched valuations carry their own rate sensitivity, meaning balance sheet quality and current valuation determine whether a defensive holding actually delivers protection or compounds the problem.
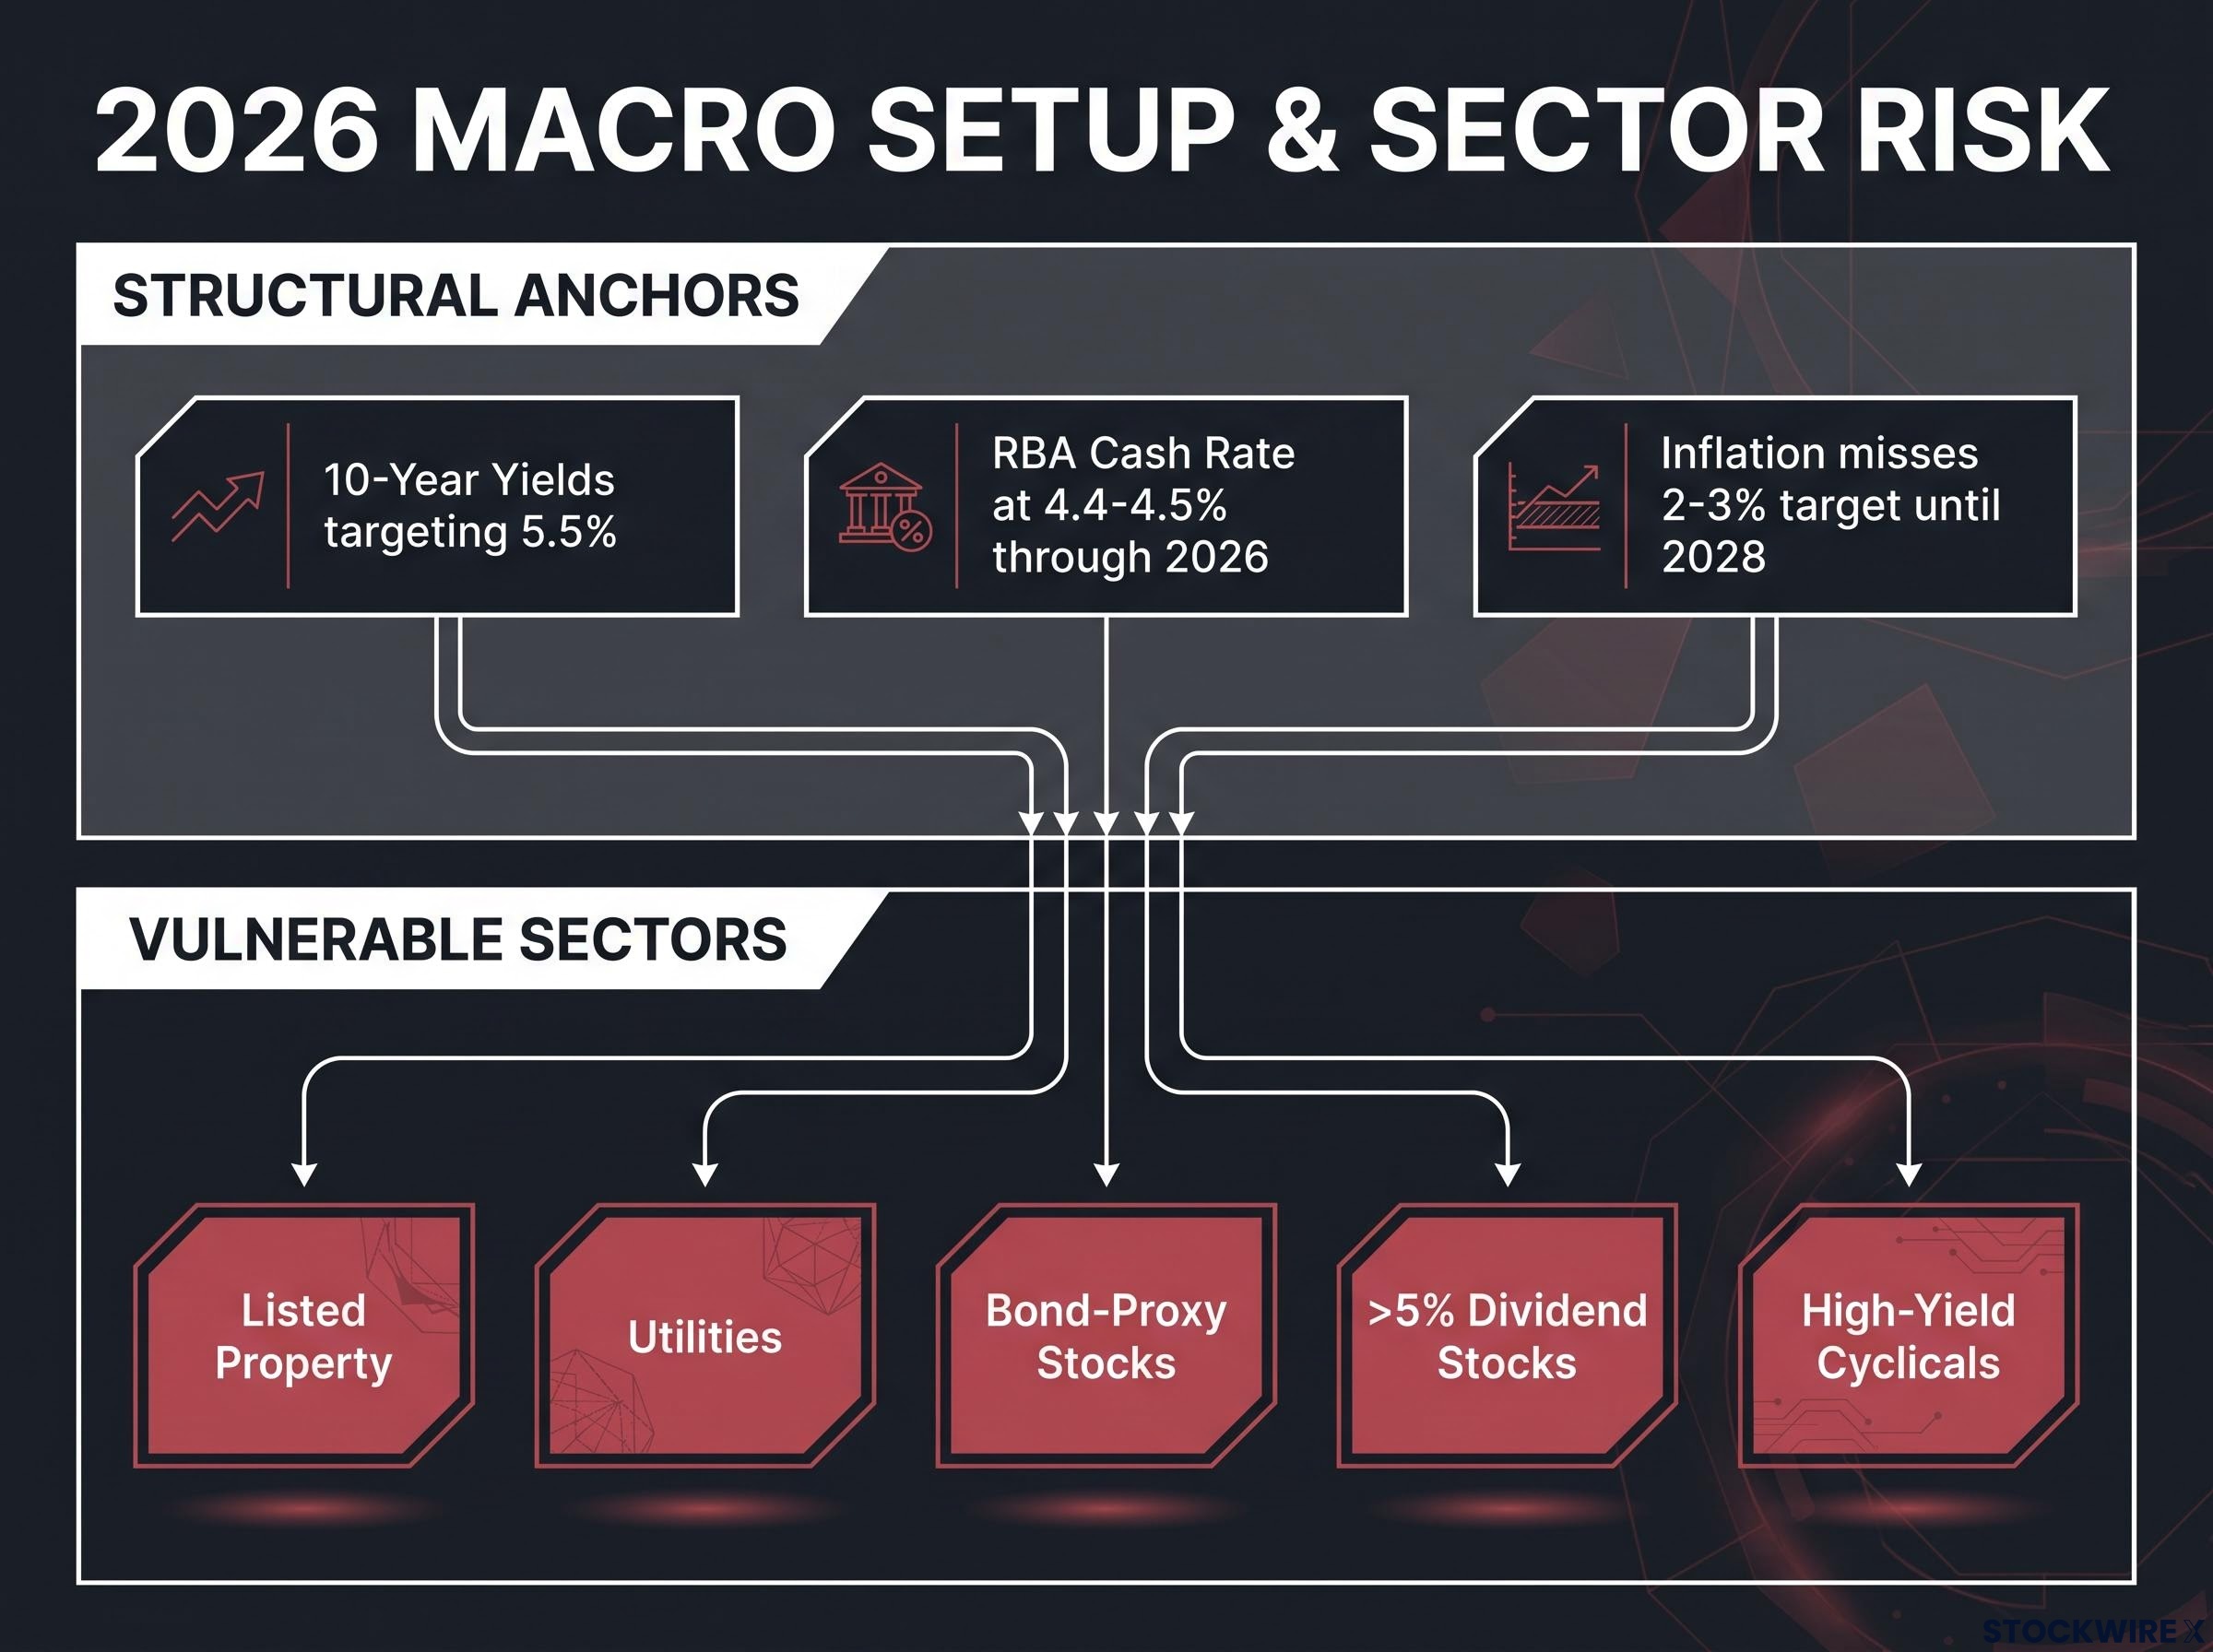
The open question is how long this lasts. Shane Oliver at AMP has flagged Australian 10-year yields potentially moving toward 5.5%, and Macquarie’s 2026 Mid-Year Outlook argues yields stay “relatively high” on structural government spending in defence and clean energy. UBS chief economist George Tharenou notes that rising RBA hike probabilities are leading brokers to expect the ASX 200 to underperform over the next 12 months.
The structural anchor The RBA’s August 2026 Statement on Monetary Policy assumes a cash rate of 4.4-4.5% through 2026, with inflation not expected to return to the middle of the 2-3% target band until early 2028.
That timeline tells you the elevated-yield environment is a structural condition, not a passing noise event. The implication for you is direct: this framework is likely to stay relevant for the next 12-18 months, and managing sector exposure and valuation sensitivity actively matters more than waiting for yields to fall.
Reading the environment correctly, not reacting to the number
Thirty-six years of data do not support treating the yield level as a standalone signal for ASX direction. The operative variables are the macro regime driving the yield, the direction of inflation, and the valuation you are buying into.
None of that means the current setup is risk-free. Valuations described as “pretty full,” a cash rate held at 4.4-4.5% through 2026, inflation above target until 2028, and structurally higher global yields together warrant active portfolio awareness rather than either panic or passive dismissal.
For investors wanting to understand how the current yield environment disrupts conventional portfolio construction, our dedicated guide to stock-bond correlation in 2026 covers the UBS research showing the correlation at its most extreme negative reading since 1996 and what that means for diversification assumptions.
The investors who navigate the next 12-18 months most effectively will be the ones who have swapped the simple yield-watching habit for the episode-based, multi-variable approach set out here. The number on the screen is the start of the question, not the answer.
This article is for informational purposes only and should not be considered financial advice. Investors should conduct their own research and consult with financial professionals before making investment decisions. Past performance does not guarantee future results. Financial projections are subject to market conditions and various risk factors.