The Federal Reserve’s 2% inflation target does not mean your money is safe. It means the value of your dollar is guaranteed to shrink every single year, by design. A dollar that buys $100 of goods today buys roughly $82 worth in a decade at 2% annual inflation, and that erosion only speeds up when inflation runs hotter.
Right now, it is running hotter. The Bureau of Labor Statistics reported US CPI-U at 3.4% year-over-year in its August 2026 release, while the Federal Reserve lifted the federal funds rate to a 3.75-4.0% target range at its September meeting. The Fed’s stated longer-run goal remains 2% PCE inflation, reaffirmed in its updated 8 August 2026 policy statement.
This is not a crisis you can wait out. It is the permanent operating environment for your savings.
So here is what the data tells you about building a portfolio that does not just survive inflation but compounds ahead of it, one asset layer at a time.
Why the Fed’s inflation framework costs you money every year
Start with what the 2% target actually is. It is not a ceiling the Fed tries to stay under. It is a floor the Fed actively works to reach, which means perpetual price increases are baked into US monetary policy rather than treated as a problem to solve.
The 8 August 2026 update to the Fed’s longer-run goals statement made this explicit.
The Committee reaffirms that inflation at the rate of 2 percent, as measured by the annual change in the price index for personal consumption expenditures, is most consistent over the longer run with its statutory mandate.
That single sentence is the whole game. When the central bank targets 2% and gets it, your purchasing power still falls 2% a year. When it overshoots, as it has at the current 3.4% reading, the loss compounds faster.
This is a structural feature of the modern US economy, not an accident. Several forces keep prices moving in one direction.
- A fiat currency system, where money is not backed by a physical commodity
- The abandonment of the gold standard, which removed a hard anchor on money supply
- Persistent large federal fiscal deficits
- A post-World War II shift from cyclical price movements to a steady upward trajectory
Before the war, US prices rose and fell in cycles. Since then, they have mostly gone one way. The practical takeaway is uncomfortable but clear: holding cash or low-yield instruments locks in a real loss every year, and the entire job of outpacing inflation lands on you.
The structural reason the Fed cannot simply crush inflation with a Volcker-scale rate campaign is fiscal dominance: US federal debt has risen from roughly 31% of GDP in 1981 to approximately 122% today, meaning each percentage point of rate increase now costs the government four times as much as it did when Volcker acted.
What economists are actually debating about the 2% target
Here is the part official language hides: the experts do not agree that 2% is even the right number.
A Brookings Institution analysis has proposed lifting the target to 3-4% or defining a range. Economists Paul Krugman and Olivier Blanchard have argued for a 3% target, while an IMF working paper made the case for a 4% long-run target to give policymakers more room in downturns. The Boyd Institute, in June 2026, characterised the fixed 2% number as arbitrary.
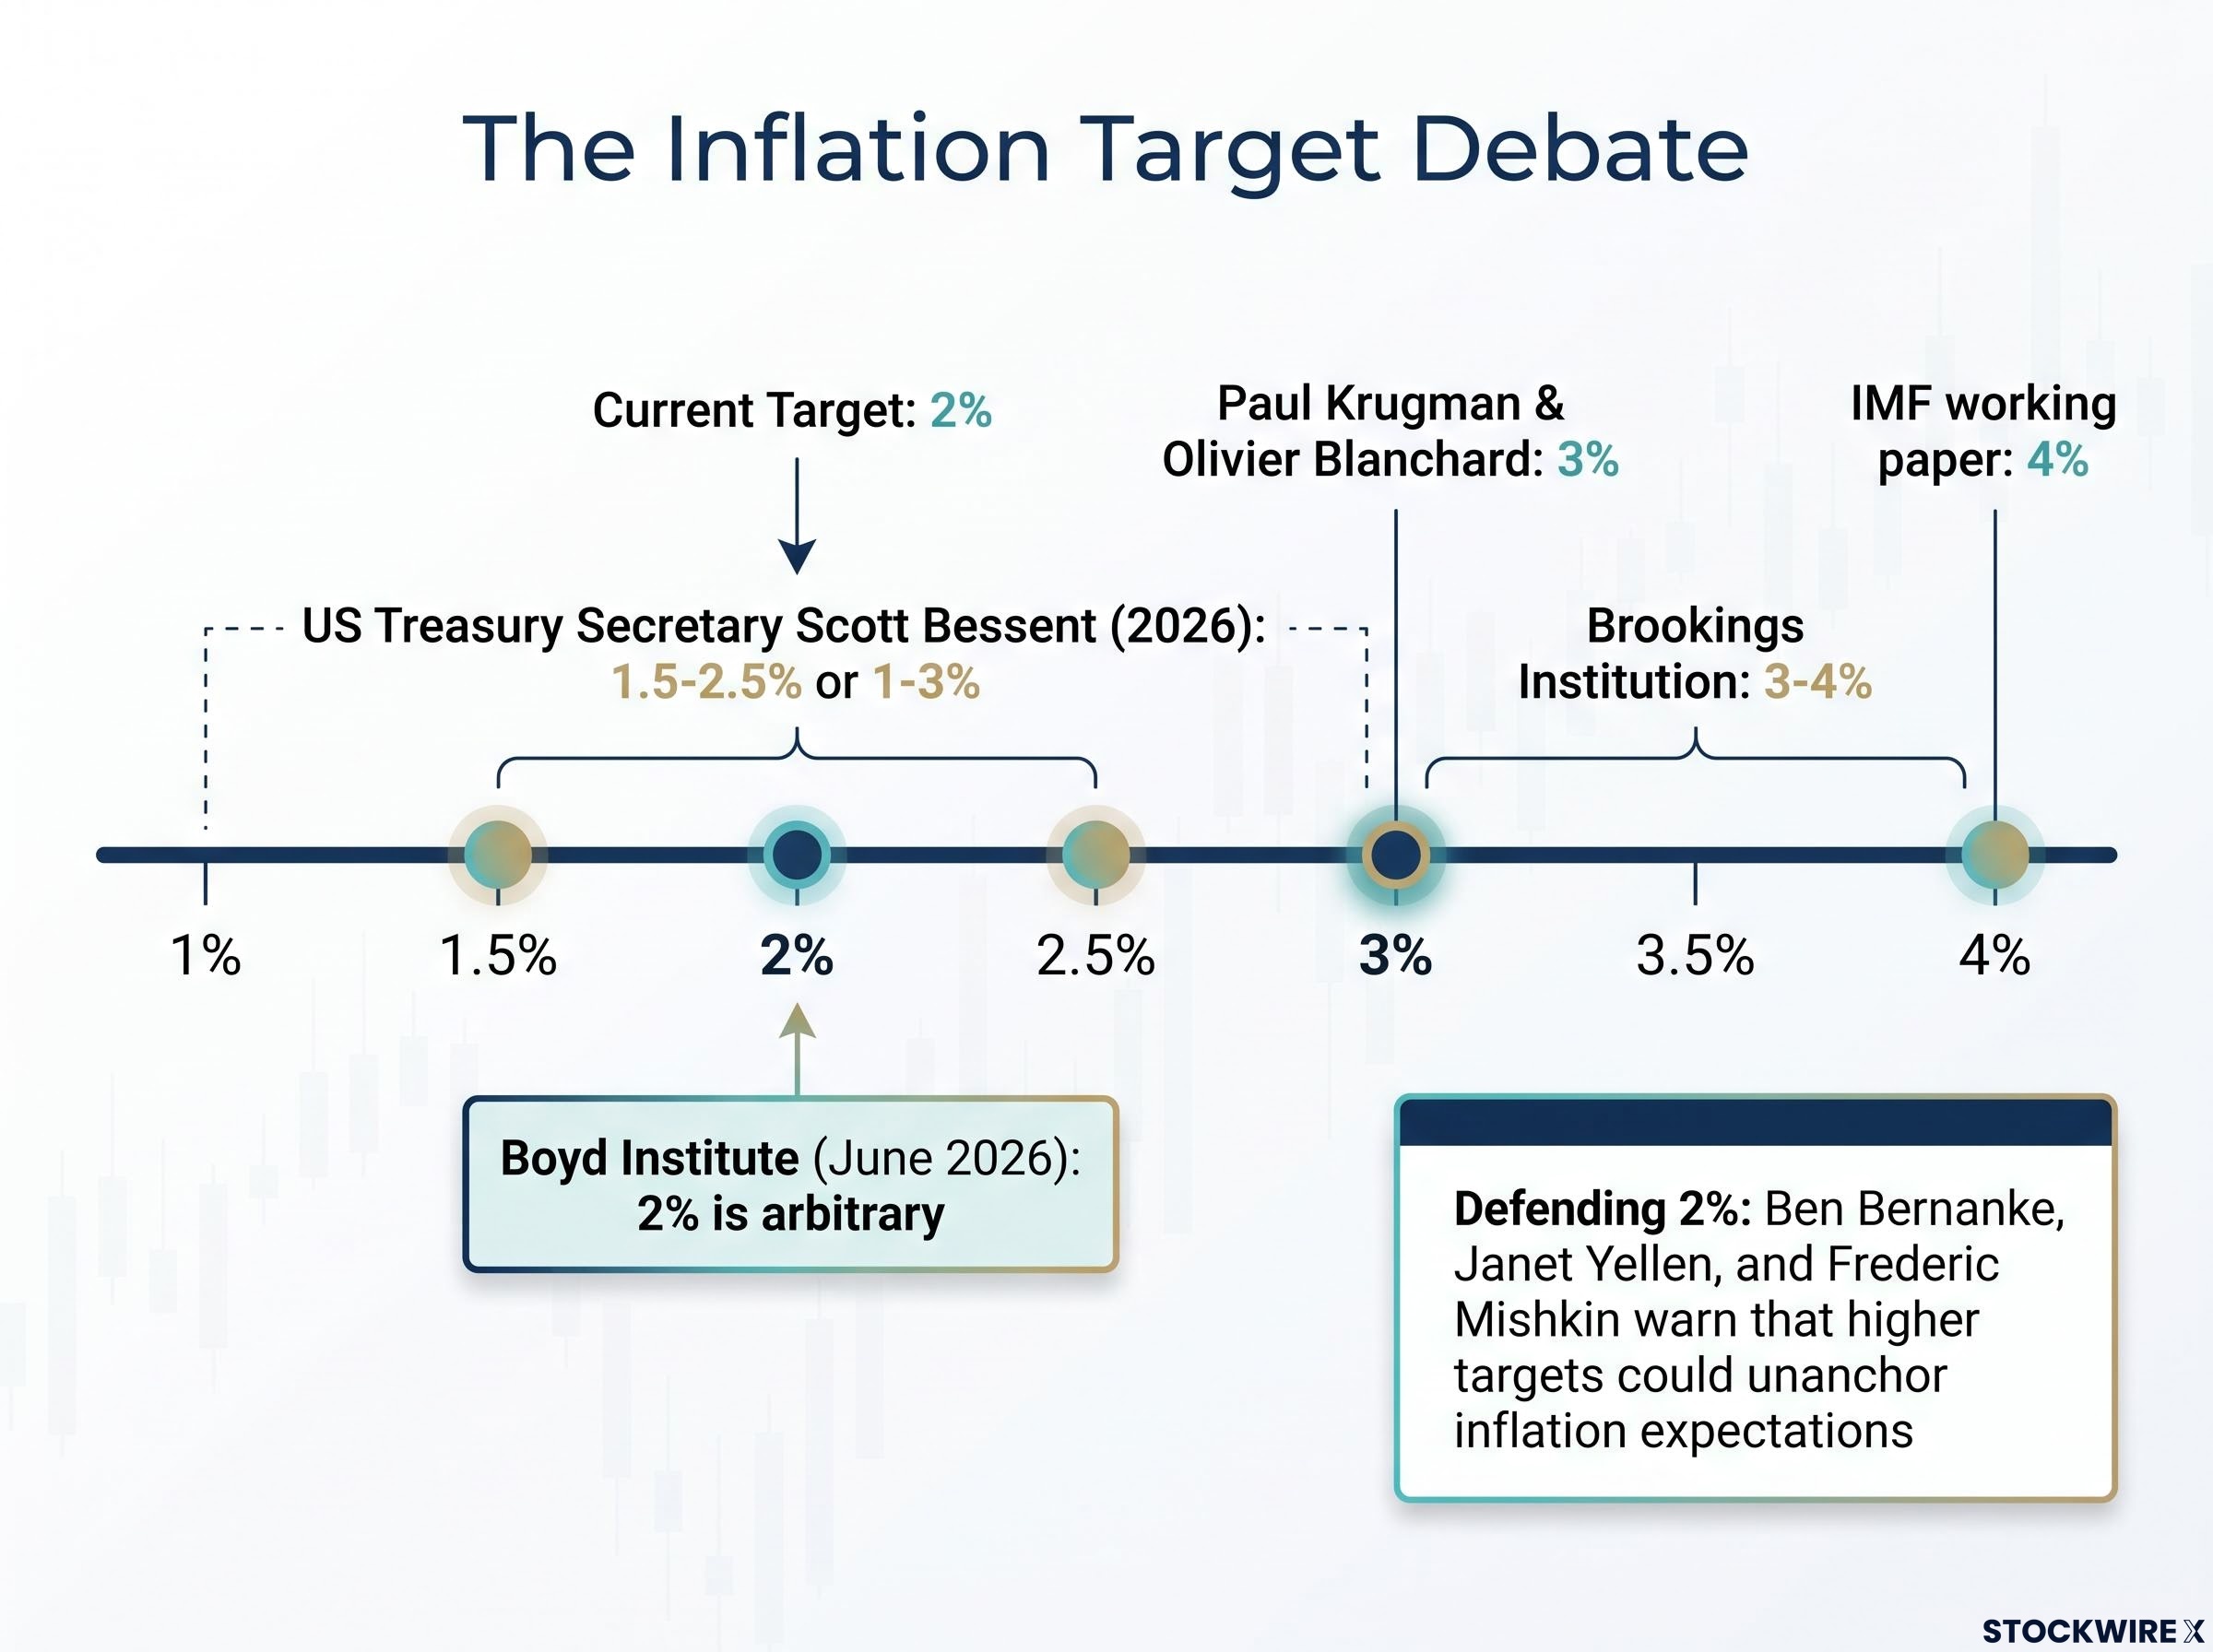
The other side is just as credible. Former Fed chairs Ben Bernanke and Janet Yellen, along with economist Frederic Mishkin, warn that higher targets could unanchor inflation expectations and make price stability harder to hold. US Treasury Secretary Scott Bessent has floated a middle path in 2026, replacing the fixed 2% with a range such as 1.5-2.5% or 1-3%.
Whether 2% is right or wrong is secondary for your purposes. The point is that the official floor is contested, uncertain, and unlikely to move lower. You have to build for rising prices regardless of how the academic argument resolves.
When big ASX news breaks, our subscribers know first
What a genuine inflation-protection portfolio actually looks like
The single most useful lesson from the research is also the one most investors ignore: no single asset reliably hedges inflation across every environment and time horizon. Gold, equities, bonds, and Bitcoin have each taken turns leading performance on a rotating monthly basis, which makes predicting the winning hedge in any given period a losing exercise.
That changes the entire question. Inflation protection is not a hedge you buy. It is a portfolio you construct.
Vanguard research on inflation-hedging asset classes finds that equities remain the most reliable vehicle for long-run purchasing power growth, while commodities and TIPS play a more targeted role for investors with shorter horizons or more immediate inflation protection needs, a distinction that maps directly onto the layered structure this guide recommends.
The horizon matters as much as the asset. Short-run hedging over one to three years tends to favour commodities and energy-linked assets. Long-run purchasing power preservation can justify a role for gold and dividend equities, and effectiveness shifts depending on whether inflation is expected or unexpected and whether real interest rates are positive or negative.
One workable structure splits holdings roughly evenly between broad S&P 500 index exposure and individually selected inflation-sensitive positions. If you prefer a hands-off approach, a well-diversified index portfolio with targeted tilts toward inflation-sensitive sectors is a valid alternative that still delivers meaningful protection.
The table below sets out the four layers this guide covers and what each one is actually for.
| Asset layer | Protection mechanism | Horizon suitability | Key risk |
|---|---|---|---|
| Dividend equities | Income and dividends can grow nominally with prices | Long-run income preservation | Equity drawdowns in recessions |
| Commodities and gold | Real-asset value tied to physical scarcity | Short-run (commodities), long-run (gold) | Regime-dependent; can fail when real rates rise |
| Crypto-adjacent ETFs | Leveraged exposure to blockchain sector upside | Speculative, small allocation only | Behaves like a risk asset under stress |
| Broad index | Diversified earnings growth across the market | Core, all horizons | Broad market volatility |
The research literature distils this into four practical lessons worth committing to memory.
- Avoid single-asset silver bullets, because none of them works in every regime.
- Diversify across multiple asset types to broaden your inflation sensitivity.
- Match asset selection to your time horizon and the rate environment.
- Beware valuation and sequence risk; buying a hedge at an extreme or concentrating in high-yield names just before a downturn can produce large real losses.
Keep one calibration principle in mind throughout. The research targets a portfolio beta slightly above one, meaning slightly more sensitive to market moves than the average, while acknowledging that mining and commodity holdings carry higher beta than the broad market. The sections that follow are the components of this architecture, not standalone bets.
Dividend equities and the income layer of an inflation portfolio
Here is the mechanism that separates dividend equities from bonds when prices are rising. A bond pays a fixed coupon in dollar terms, so its income stays flat while inflation eats into what that income buys. A company, by contrast, can raise prices, grow earnings, and lift its dividend nominally alongside the price level.
That gives equities a second avenue to protect your real income that bonds simply do not have. Companies able to pass higher costs through to customers can grow both their payout and their share price faster than the CPI over time.
Before you treat that as a green light, sit with the empirical caveat.
The inflation protection case for dividend equities rests on the assumption that growing payouts offset rising prices, but dividend mechanics complicate that thesis: when a company pays a dividend, its share price falls by approximately the same amount on the ex-dividend date, meaning the income is a transfer of existing value rather than new wealth created on top of it.
Dimensional Fund Advisors research, summarised in 2024, found no strong evidence that dividend stocks deliver superior inflation-adjusted performance during periods of high inflation or rising interest rates.
The mechanism is sound in theory but not guaranteed in practice. And there is a specific trap: double-digit yields should raise your suspicion, not your interest, because they often signal dividend cut risk when growth or inflation disappoints.
Energy and financial sector plays: where the higher yields currently live
The named positions in the research cluster in energy and financials, sectors offering yields above the S&P 500 average with downside cushioning during corrections.
| Ticker | Sector | Yield range | Inflation relevance | Key risk |
|---|---|---|---|---|
| MAIN | Business development / finance | 5.5% to 7.9% | Monthly plus regular income | ~1% loan portfolio default rate |
| EPD | Midstream energy | 5.83% | Energy exposure through transition window | Sector cyclicality |
| WMB | Pipeline / midstream energy | 2.79% to 2.93% | Energy relevance plus stability | Lower yield than peers |
Main Street Capital (MAIN) is worth studying closely because its yield figure is a lesson in itself. MarketBeat reported a 5.57% yield in August 2026, DividendMax reported 5.5% in September 2026, yet a company press release put it at 7.9% once September supplemental dividends were included, based on the $55.75 closing price on 3 August. That gap between headline and supplemental-inclusive yield is exactly why you scrutinise the number rather than chase it. An investor grabbing the highest figure without understanding its composition is walking straight into the cut risk the research warns about.
Enterprise Products Partners (EPD) yields 5.83% on a $2.24 annual dividend, according to MarketBeat in September 2026. Williams Companies (WMB) yields between 2.79% and 2.93% on a $2.10 annual dividend, or $0.52 quarterly.
Both are midstream energy names, and the thesis is time-bound rather than permanent. Energy holdings are considered appropriate until Middle East geopolitical tensions ease and nuclear power capacity comes online, developments expected to take years. Financial sector payers add yield plus economic sensitivity as a secondary hedge. As for technology, these remain growth holdings with minimal yield and stretched valuations; the research estimates tech could fall 50% and still be considered overvalued.
Real assets and alternative hedges: commodities, gold, and crypto-adjacent plays
Every real-asset hedge shares a pattern. It works in some regimes and fails in others, which is precisely why none of them works alone.
Take commodities first. Rather than holding physical metal or futures, the research prefers equity access through royalty companies such as Franco-Nevada, which offer a lower-volatility route than direct mining. Your access options differ sharply in risk.
- Royalty companies: equity-structured, lower volatility, steadier exposure
- Direct commodity funds: higher volatility, closer to spot price movements
- Futures-based ETFs: exposed to roll-yield costs and contango, meaning the fund can lag badly even when spot prices climb
That contango risk matters. Rolling futures forward can drag returns so much that a rising commodity price still produces a losing position. Copper sat near $6.50 to $6.70 per pound on mid-September 2026 COMEX data, and uranium prices remain elevated, but the correlation between commodity returns and inflation is weaker than most assume. IMF data from 1970 to 1999 put the correlation between the 12-month Chase Physical Commodity Index return and annual US inflation at just 0.23.
Gold tells a more dramatic version of the same story. Its long-run record is genuinely impressive.
Since 1971, gold has climbed from $35 an ounce to above $4,100, while the US dollar lost roughly 87% of its purchasing power over the same stretch. It traded in the $4,350 to $4,400 range in mid-September 2026, having rebounded 9% in August on institutional and central bank demand.
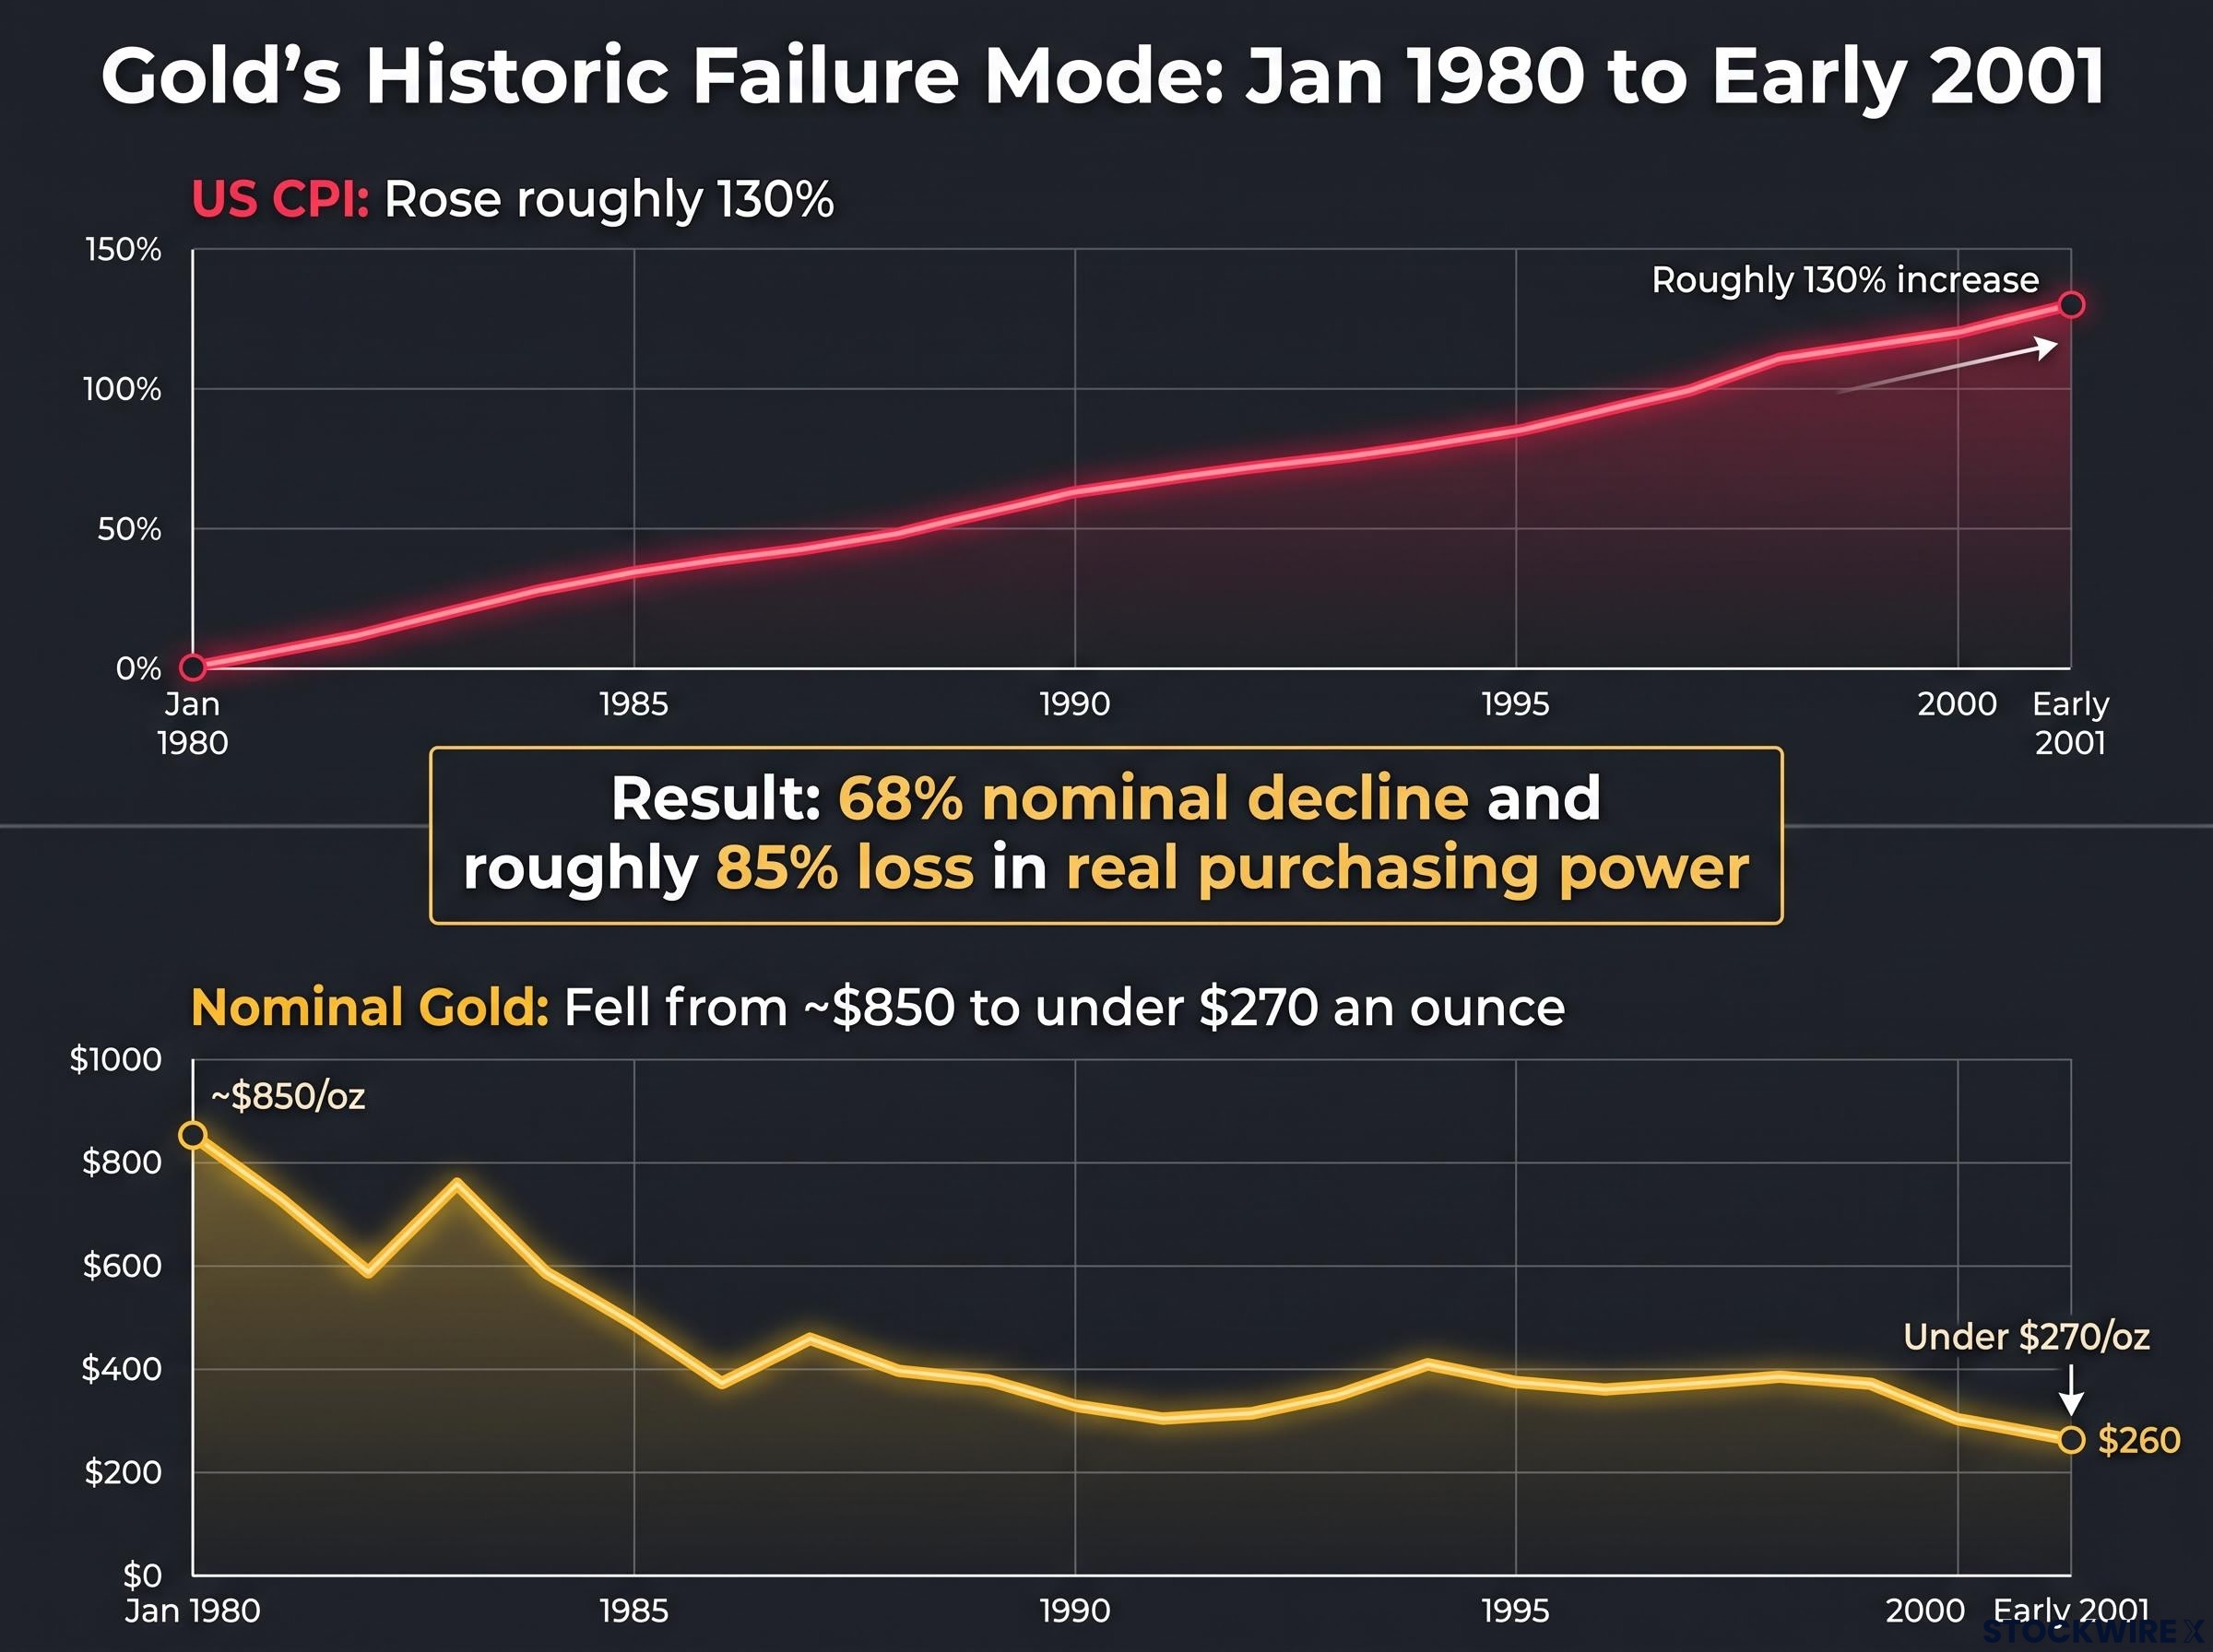
Now the failure mode you cannot ignore. From January 1980 to early 2001, US CPI rose roughly 130% while nominal gold fell from about $850 to under $270 an ounce, a 68% nominal decline and roughly an 85% loss in real purchasing power. An investor who bought gold as an inflation hedge at the 1980 peak and held for 21 years watched inflation compound while their hedge collapsed. Gold excels in high-inflation, low-real-rate environments and underperforms badly when real rates turn meaningfully positive. Timing and the rate regime matter as much as the decision to own it.
One instrument the portfolio framework here does not cover in detail is TIPS, and at 30-year TIPS real yields near 3.05% in September 2026, a multi-decade high, the case for Treasury Inflation-Protected Securities as a complement to the equity and real-asset layers is stronger than most inflation-focused guides currently reflect.
Crypto-adjacent ETFs: leverage on the theme without direct Bitcoin ownership
The research prefers blockchain and crypto-adjacent ETFs, funds holding blockchain-related companies, over direct Bitcoin ownership. The appeal is capturing sector upside with fund-level diversification and no custody risk from holding coins yourself.
Be clear-eyed about what these are. They behave like risk assets in stress environments, not defensive hedges, which means they can sell off precisely when you most need inflation protection. Crypto-linked instruments also carry regulatory and technological risk on top of high volatility.
There is no robust empirical research confirming crypto-adjacent ETFs as reliable inflation hedges. Treat this as a small, speculative, high-risk layer, not a core holding.
Building a real-return portfolio before the next CPI print
Pull the four layers together and a coherent structure emerges. Dividend equities supply an income layer that can grow with prices. Commodities and gold provide real-asset ballast for different horizons. Crypto-adjacent ETFs sit as a small speculative sleeve. Broad index exposure anchors the whole thing.
The research is consistent on what matters most, and it is not any single asset call. It is discipline.
- Diversify across asset layers with distinct inflation mechanisms.
- Match your asset selection to your time horizon and the rate environment.
- Calibrate portfolio beta to slightly above one, enough sensitivity to capture upside without concentrating so heavily in high-beta mining and commodity names that drawdowns become unmanageable.
- Prioritise systematic contributions and regular rebalancing over tactical rotations into whichever hedge is currently hot.
For readers who want to understand how behavioural responses to CPI headlines have historically undermined returns, our deep-dive into inflation misreading and market timing documents how investors who sold on alarming June and July 2026 inflation commentary exited before the S&P 500 advanced toward record highs in August, a pattern that repeats across cycles.
On cash, the guidance is direct: hold only minimal reserves for genuinely opportunistic situations, stay fully invested, and treat special situations as occasional rather than structural.
Ground every decision in today’s starting conditions.
- CPI at 3.4% year-over-year, per the BLS August 2026 release
- Fed funds rate at 3.75-4.0% following the September 2026 FOMC meeting
- The Fed’s stated longer-run inflation floor of 2% PCE
Building this portfolio in September 2026 is not a bet on inflation returning. It is construction for an environment where 3.4% is the current reality and 2% is the permanent floor. Real return above inflation will not arrive through passive exposure; it requires intentional design across every layer.
This article is for informational purposes only and should not be considered financial advice. Investors should conduct their own research and consult with financial professionals before making investment decisions. Past performance does not guarantee future results, and financial projections are subject to market conditions and various risk factors.