UK retail sales beat expectations by a meaningful margin on Friday, and Sterling barely moved. That gap, between genuinely good economic news and a currency that shrugged, is the story worth understanding.
In a market where rate-path expectations dominate almost every other input, a single data print rarely moves a currency unless it shifts the policy calculus. Even a strong print. This piece of GBP/USD analysis unpacks why the pair stayed rangebound despite an upside surprise, examining the technical structure, the Bank of England’s constrained positioning, and the FX market mechanics that quietly suppress the rallies you would expect.
After reading this, you will have a clear framework for telling when positive UK data is tradeable and when it is not, using Friday’s setup as the live example. The value is practical: the next time strong domestic data lands and the pound refuses to follow, you will know why, and what to watch instead.
What the retail sales data actually showed
August was not a marginal beat. It was a clear one, across every measure that matters.
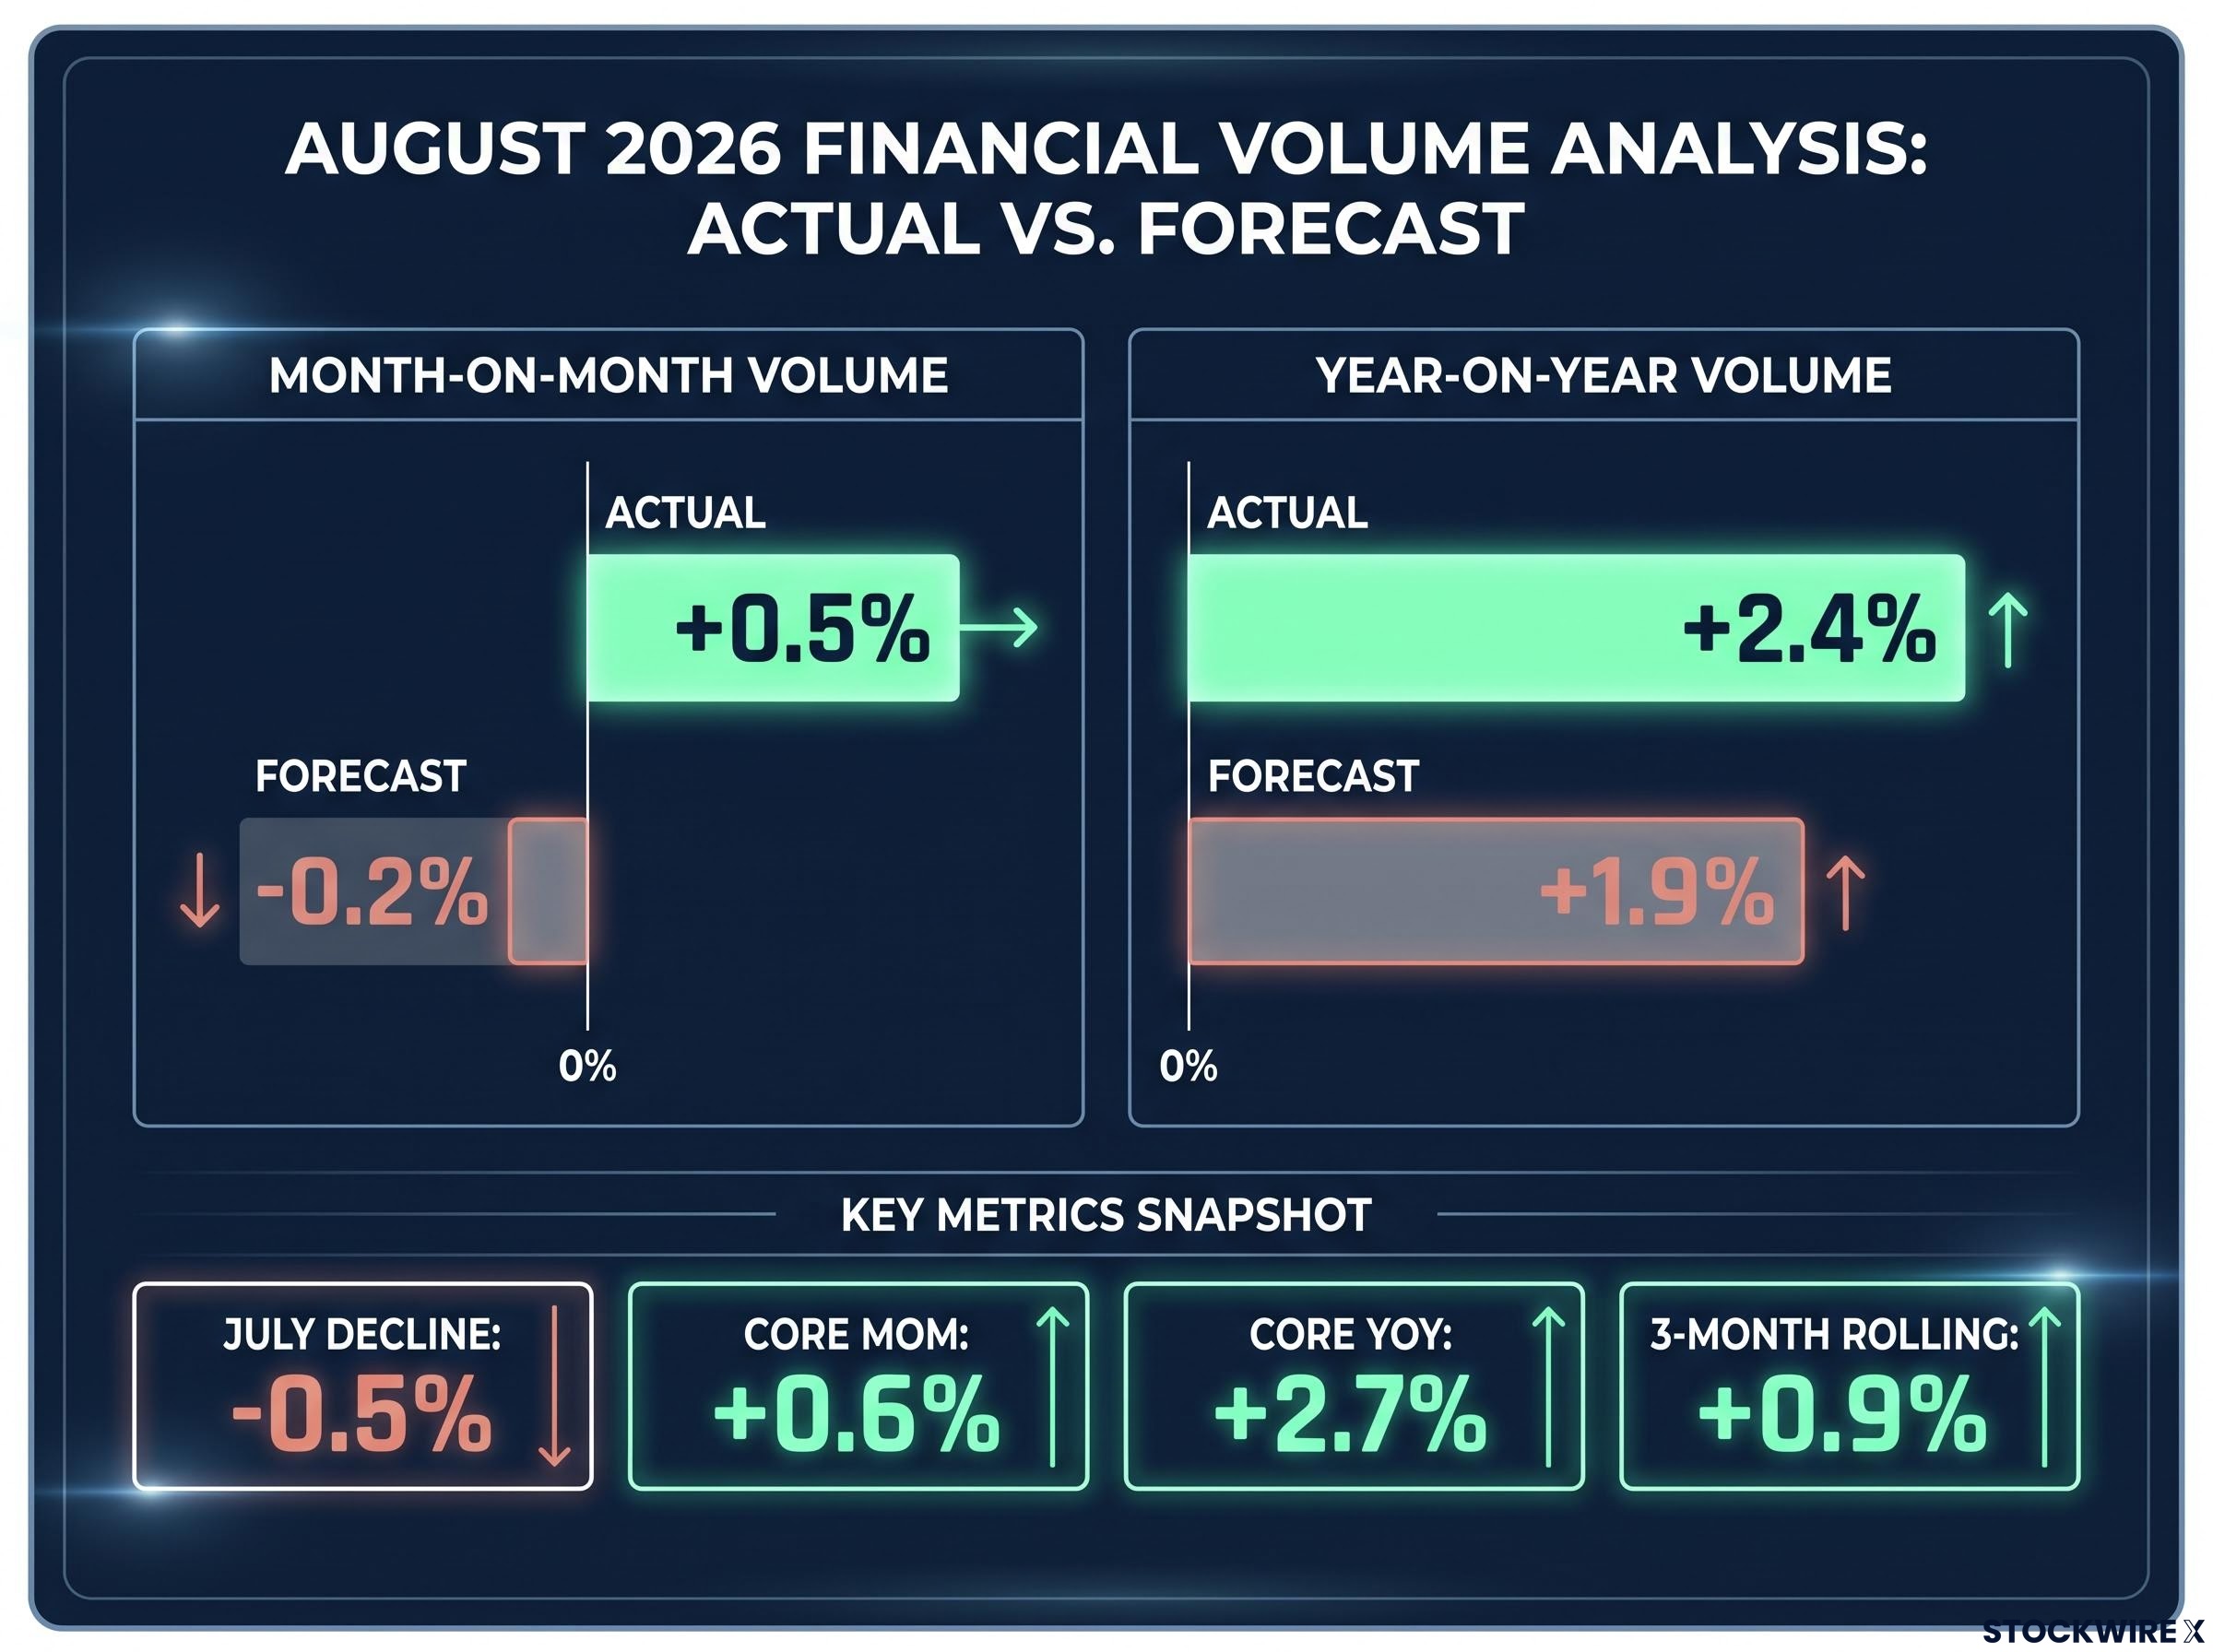
The Office for National Statistics reported that retail sales volumes rose 0.5% month-on-month in August 2026, reversing a 0.5% decline in July. On an annual basis, total sales volumes ran 2.4% higher than the August 2025 level.
Consensus had positioned for the opposite. Economists had forecast a 0.2% monthly fall and a 1.9% annual gain, which means the actual print beat expectations on both counts. The strength held up beneath the headline too.
- Retail sales volumes rose 0.5% month-on-month, versus a forecast 0.2% fall
- Total volumes were 2.4% higher year-on-year, versus a forecast 1.9% gain
- Core sales excluding automotive fuel rose 0.6% on the month and 2.7% on the year
- Three-month rolling volumes rose 0.9% against the prior three-month period
That last figure matters most. A single strong month can be noise. A three-month rolling gain confirms the beat was a genuine trend in consumer spending, not a one-off distortion.
And yet Sterling posted only a slight advance during Friday’s North American session. This is the paradox the rest of this analysis resolves.
Scotiabank strategists Shaun Osborne and Eric Theoret noted explicitly that the pound failed to capitalise meaningfully on the better-than-expected consumer figures, despite the clear upside surprise in the data.
The size of the beat is the point. If the numbers had been ambiguous, a flat reaction would need no explanation. Because the beat was clean and broad-based, the muted response was not a data-quality problem. It was a deliberate market choice, and understanding that choice is what turns a confusing session into a readable one.
When big ASX news breaks, our subscribers know first
Why strong data does not always produce a stronger currency
The intuitive model is simple: good data means a stronger economy, which means a stronger currency. Friday broke that model in plain sight, so it is worth rebuilding from the ground up.
Currencies do not price the news. They price the surprise relative to what was already expected, and then only if that surprise changes the interest-rate outlook. Four mechanisms explain why a confirmed beat can land with a thud rather than a rally.
- Buy the rumour, sell the fact. FX prices move ahead of major releases. August’s beat arrived against a backdrop of already-constructive UK data and firm expectations for a hawkish BoE hold, so the good news was largely embedded in the pound’s valuation before the number printed. When the surprise confirmed what traders had positioned for, there were few marginal buyers left to push the pair higher.
- Crowded positioning triggers profit-taking. When speculative long positioning is heavily one-sided, a data beat becomes an exit opportunity rather than an entry signal. Traders use the post-data spike to trim exposure and unwind crowded bets, which caps the move.
- Rate-path dominance. Central bank policy expectations outweigh single data prints. A strong number that fails to shift the market’s view of the rate path over the next year does not generate a lasting rally, and Friday’s retail beat did not move that pricing.
- Global risk offset. Domestic strength can be overshadowed by the wider backdrop. Upside risk in US PCE inflation data on the same session maintained a structural bid for the Dollar as both a safe haven and a yield benchmark, putting a ceiling on GBP/USD regardless of the UK-specific beat.
Yield-spread mechanics amplified the dollar bid on the same session: a 93% probability of a Fed hike to 3.75%-4.00% was already priced before the UK retail data landed, meaning sterling was competing against a structurally stronger dollar regardless of how good the domestic numbers looked.
When rate-path logic overrides data
In a rate-plateau environment, the question is not what the data shows today. It is what the data implies for the next 12 to 18 months of policy.
Friday’s retail print, strong as it was, did not shift the BoE’s likely rate path enough to change the calculation of the marginal buyer or seller. So the pair stayed where it was.
The reason this framework matters is that it is repeatable. This is not a quirk specific to Sterling. You will see the same divergence in EUR/USD, AUD/USD, and other majors after strong domestic prints, which means you can apply these four mechanisms to any high-impact data day and know in advance whether a beat is likely to be tradeable.
The BoE hold and the policy ceiling on Sterling
If the data did not move the pound, the central bank explains why it could not. The Bank of England, not the retail figure, is the binding constraint on Sterling right now.
At its meeting ending 16 September 2026, the Monetary Policy Committee voted 6-3 to hold the Bank Rate at 3.75%, with three dissenting members voting to raise it to 4.0%. That split is the signal. A meaningful minority wanting a hike tells you the internal tension at the BoE is tilted hawkish, which removes the prospect of near-term cuts that might otherwise weaken the currency.
The BoE rate decision itself carried a detail that matters more than the hold headline: the same three hawks (Pill, Greene, and Mann) pressed for an immediate hike to 4.0% for the third consecutive meeting, meaning the majority is just one defection from losing its position on the committee.
The communication reinforced that posture. The MPC also paused active gilt sales for six months to slow the pace of quantitative tightening (the process of unwinding bonds the central bank bought during earlier stimulus).
The Bank warned that inflation, reported at 3.1% in August, could reach slightly over 4% in early 2027 under adverse scenarios driven by geopolitical energy price spikes.
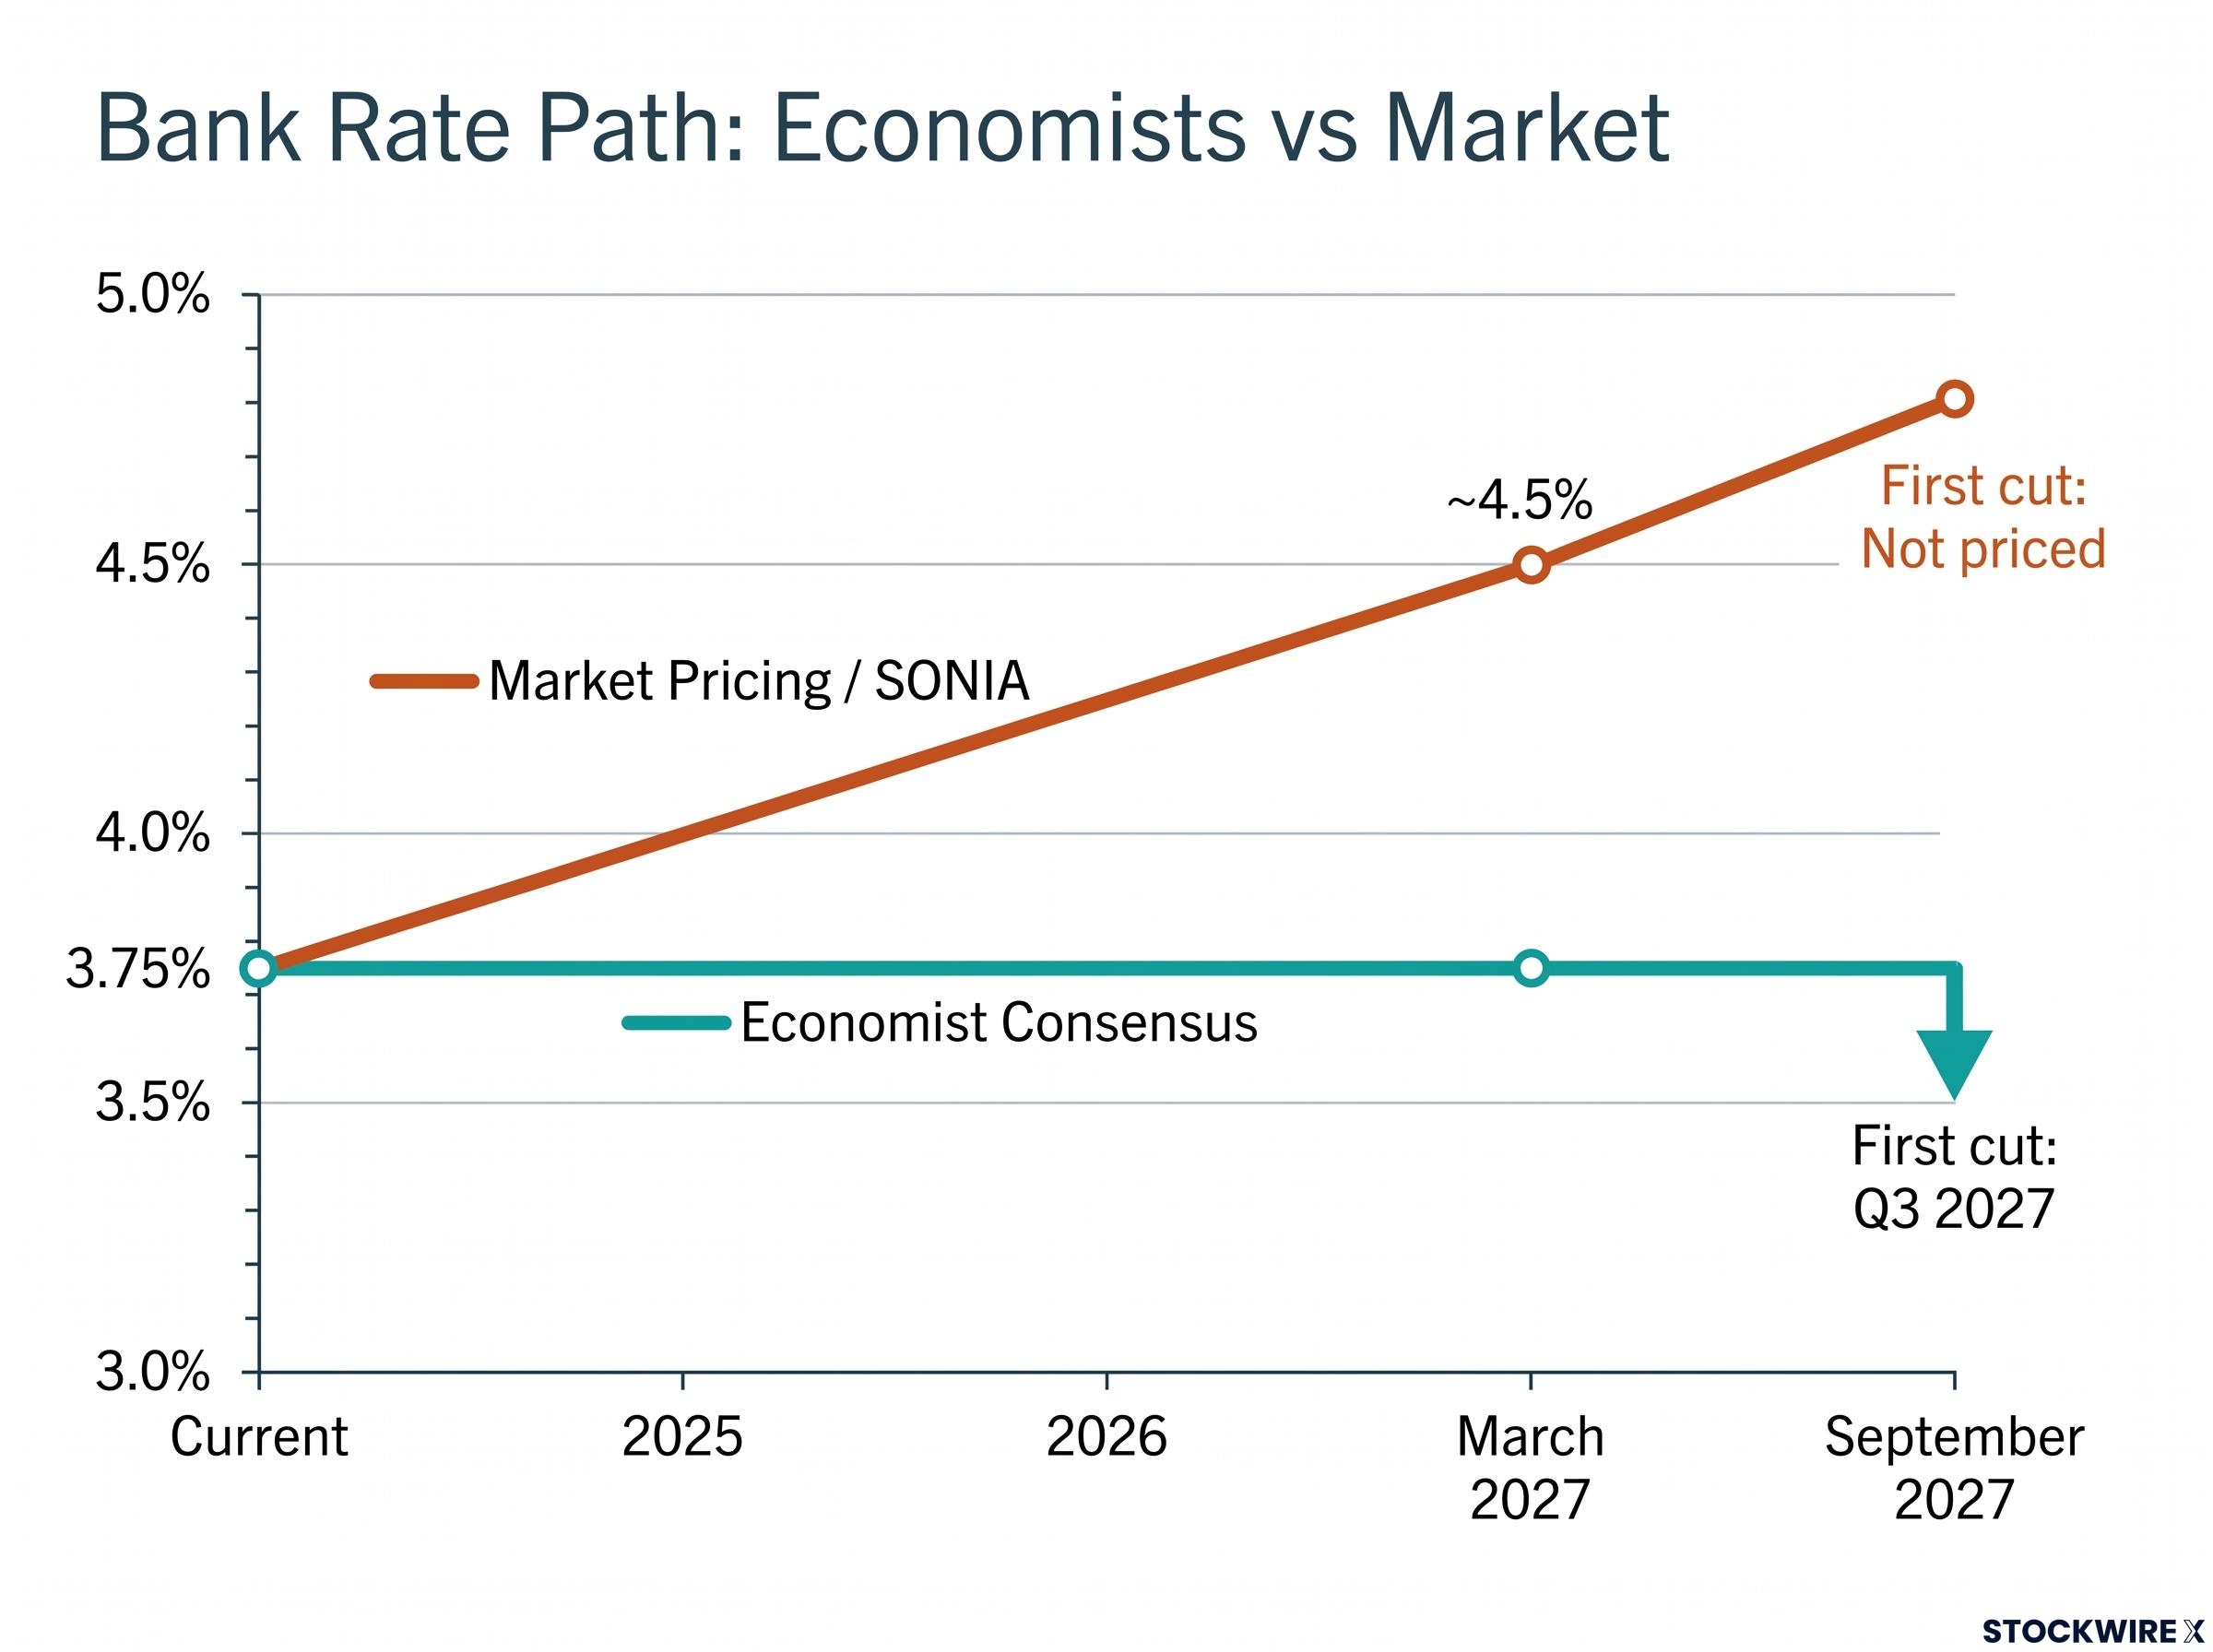
Here is where the picture gets genuinely uncertain. Economists and the market disagree about where rates go next, and that disagreement is precisely why the pound cannot rally cleanly on good news.
| Measure | Economist consensus | Market pricing (SONIA curve) |
|---|---|---|
| Current Bank Rate | 3.75% | 3.75% |
| Path by March 2027 | Hold at 3.75% | Around 4.5% |
| Path by September 2027 | Hold at 3.75% | Around 4.8% |
| First rate cut | Q3 2027 | Not priced |
Read that gap carefully. Economists see the next move as a distant cut, while the market’s SONIA-based pricing implies more hikes are coming. When professionals cannot agree whether the next move is a hold or a hike, directional conviction evaporates, and a currency with no directional conviction does not run on a single data print.
Technical structure: where the medium-term uptrend holds and where it breaks
The chart tells the same story the policy backdrop does. A trend that is intact but going nowhere fast.
The medium-term uptrend in GBP/USD originating from June remains valid. Near-term signals, though, have turned neutral to bearish, with the Relative Strength Index reaching the oversold threshold of 30. RSI measures the speed and size of recent price moves on a scale of 0 to 100, and a reading at 30 flags stretched short-term selling, not a confirmed reversal on its own.
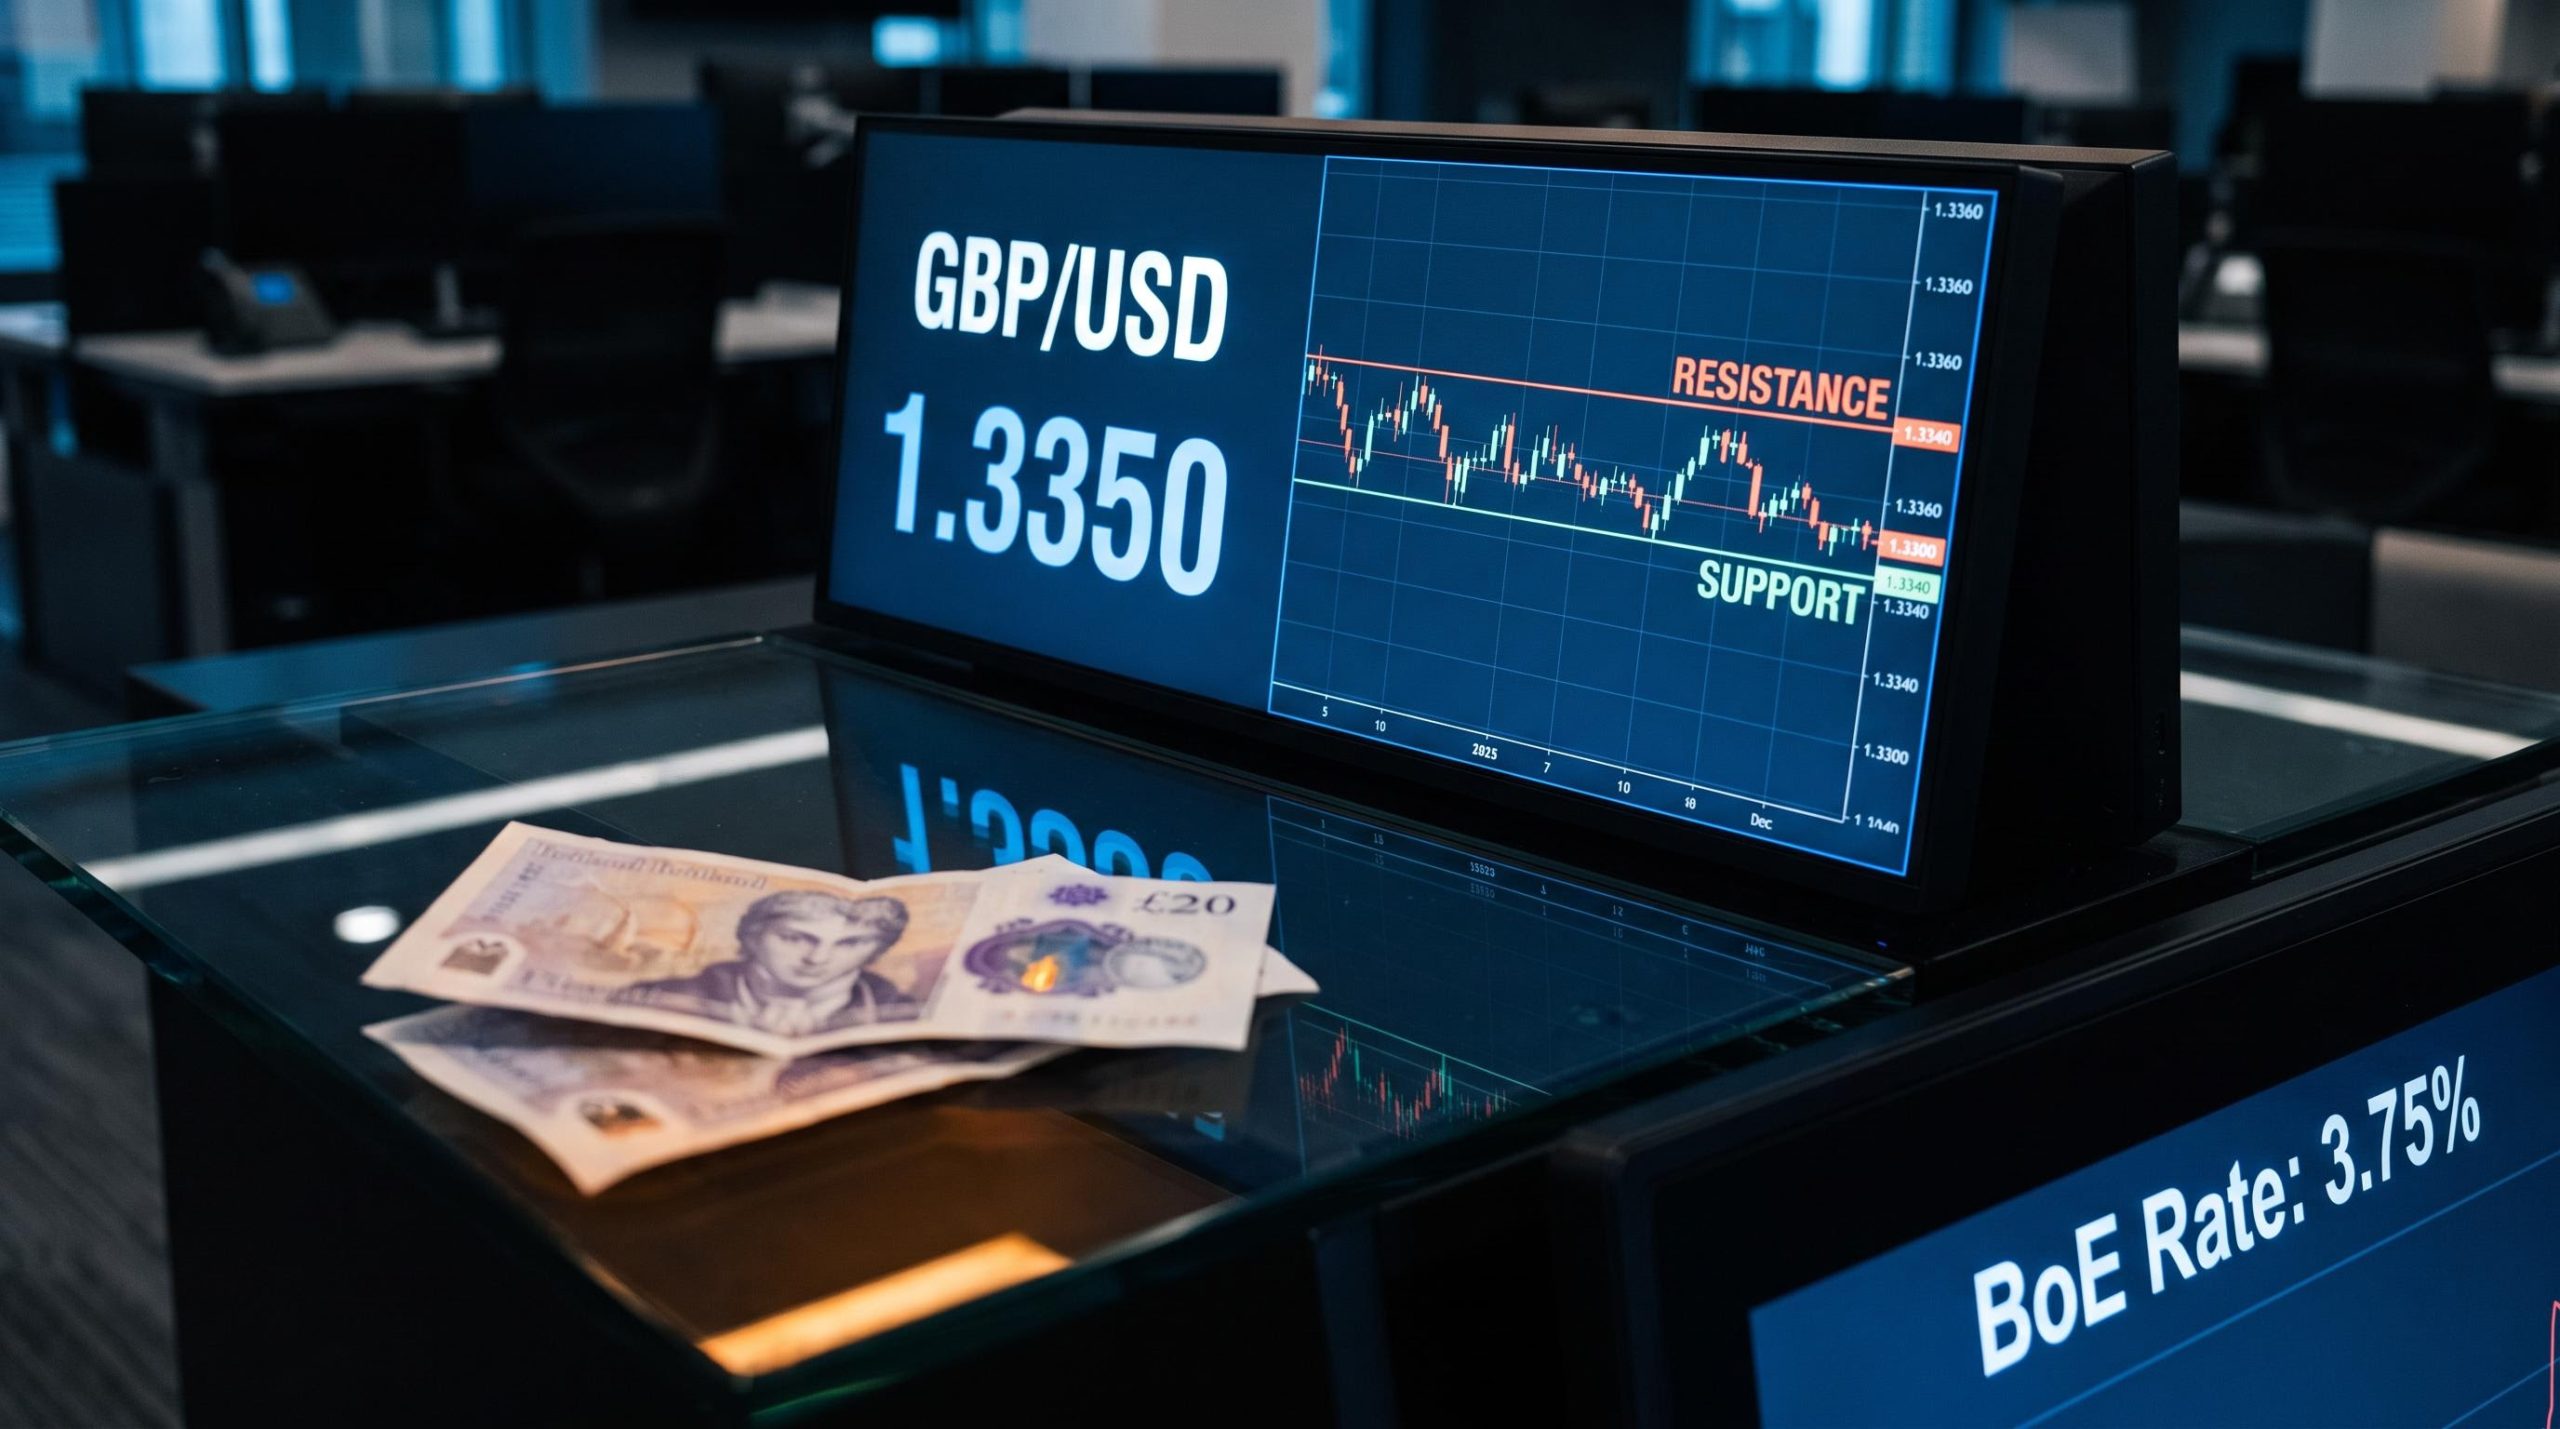
Recent action has been contained. Across sessions surrounding the BoE decision, the pair traded between a low of 1.3345 and a high of 1.3460, with the most recent close on 18 September in the 1.3350 to 1.3360 area. That places spot at the lower bound of its range.
| Level | Price | Significance |
|---|---|---|
| Near-term support | 1.3320 | First downside floor |
| Near-term resistance | ~1.3480 | Ceiling on any rally |
| Recent session low | 1.3345 | Lower bound of range |
| Recent session high | 1.3460 | Upper bound of range |
| First invalidation | Mid-1.33s | Uptrend under pressure |
| Second invalidation | 1.3245 | Bearish confirmation |
| Third invalidation | 1.3165 | Deeper breakdown |
| Critical invalidation | 1.30 | Uptrend broken |
The conditions that keep the June uptrend alive are straightforward to monitor.
- The uptrend holds as long as the pair stays above the mid-to-lower 1.33s
- A sustained break above 1.3480 would signal renewed bullish momentum
- A break below the mid-1.33s puts the trend under immediate pressure
- Losses through 1.3245, then 1.3165, then 1.30 would confirm the bullish thesis has broken
RSI at 30 combined with spot sitting at the lower edge of the range means the pair is at a decision point, not in freefall. That is a level to watch closely rather than a signal to act on immediately, and knowing exactly where the trend validates or invalidates gives you a concrete framework instead of vague talk of Sterling weakness.
For readers wanting to understand how overbought and oversold RSI readings behave differently depending on the underlying trend direction, our full explainer on RSI signals in GBP/USD trends uses August’s CPI-driven rally to show why the same indicator reading can justify caution at one level and patience at another.
What moves the pound from here: the variables worth watching
The diagnosis is done. What follows next depends on three things, and each is worth putting on a watch list.
- BoE rate-path repricing. The central question is whether the SONIA curve’s hawkish pricing, around 4.5% by March 2027, is vindicated or unwound. That resolution, more than any single release, will set the pair’s direction.
- UK inflation and growth data. With CPI at 3.1% and a flagged path toward 4%-plus in early 2027, the inflation series is the data most likely to shift rate-path pricing. Growth prints matter for the stagflation risk they carry.
- The 1.33 technical zone. The mid-to-lower 1.33s is the line that separates an intact uptrend from a broken one.
There is a latent risk variable too. Gilt-market stress can add a fiscal risk premium to the pound, deepening GBP/USD weakness through rising yields alone, without any new data print to trigger it.
The ECB-BoE monetary policy divide adds a cross-border dimension to sterling’s constrained positioning: the ECB raised to 2.50% on 10 September while the BoE held at 3.75%, and EUR/GBP is absorbing that gap in ways that complicate directional conviction on the pound across both major pairs.
For monitoring purposes, the setup reduces to two clean scenarios.
- A sustained break above 1.3480 would indicate the rate-path story resolving in Sterling’s favour and renewed bullish momentum
- A loss of the mid-to-lower 1.33s would technically invalidate the June uptrend and confirm the bearish case
For UK-based readers with GBP exposure, whether through international assets, property-related financing, or business hedging, the takeaway is direct. The pair’s next significant move will come from the rate-path story resolving in one direction, not from any single economic release.
This article is for informational purposes only and should not be considered financial advice. Investors should conduct their own research and consult with financial professionals before making investment decisions. Past performance does not guarantee future results. Financial projections are subject to market conditions and various risk factors.
Reading the pound in a data-rich, policy-constrained environment
Strong retail sales did not move GBP/USD because four FX mechanisms overwhelmed the data’s signal value. Priced-in expectations, crowded positioning, rate-path dominance, and global risk offset together left no room for a beat to translate into a rally.
Behind those mechanics sits the structural cap: the Bank of England. Until the disagreement between economist consensus and the SONIA curve resolves, the policy uncertainty itself keeps Sterling from appreciating cleanly on good news. Uncertainty is the ceiling.
The chart agrees. The medium-term uptrend from June survives, but its survival depends entirely on the 1.33 support zone holding.
That is the single most important number to track. Watch how the rate-path story resolves, and watch whether 1.33 holds. Everything else, including the next strong data print, is secondary until one of those two things gives way.