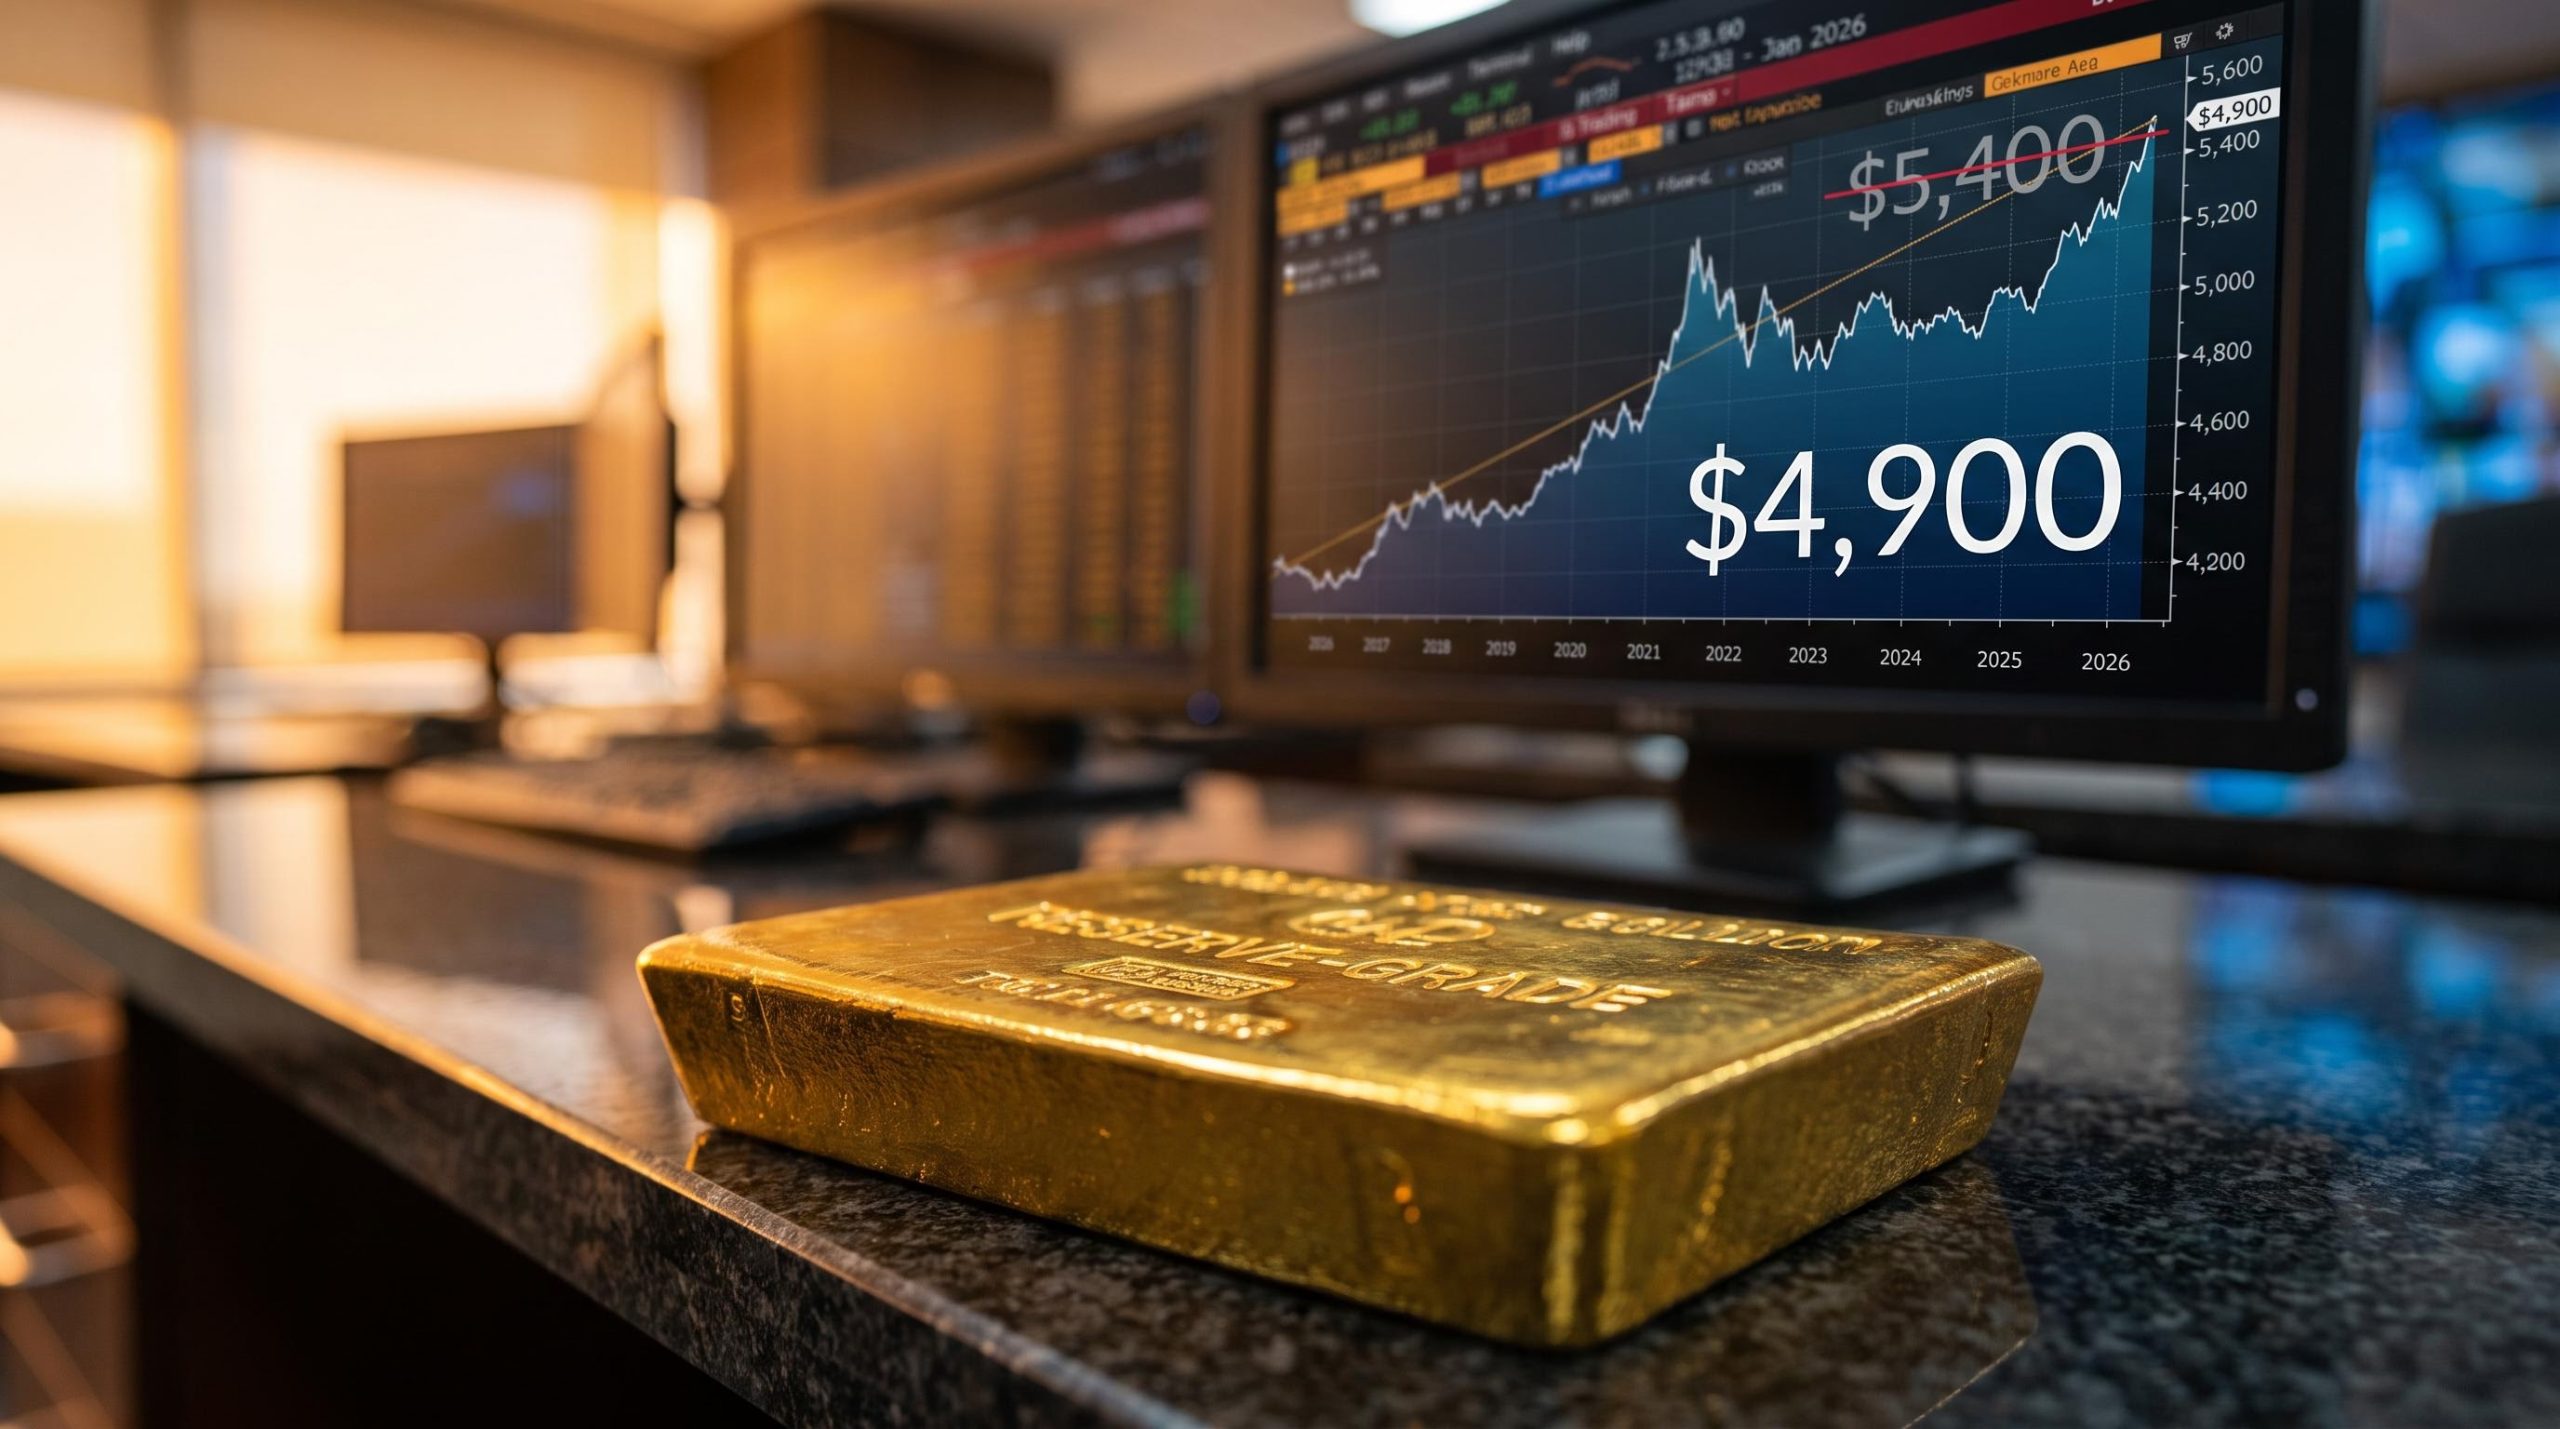
Goldman Sachs has not walked away from its $4,900 gold target. It has quietly stepped down to it, revising from a peak of $5,400 after the bank’s own economists concluded the Federal Reserve will not cut rates at all in 2026 and may actually hike in October.
The forecast that looks bullish today was the downgrade.
With gold trading around $4,355 per ounce in mid-September 2026 after a 1% intraday drop on U.S. inflation data, the gap between the current price and Goldman’s year-end target sits at roughly $545. The bank’s argument is not that the path is easy. It is that central bank buying has structurally reset the demand floor, and the rate headwinds worrying investors are largely already priced into the exchange-traded fund side of the market.
What follows maps the internal logic of Goldman’s position: where the forecast has been, what is holding it up, what could break it, and what the options market reveals about how the bank is sizing those risks. Anyone weighing gold exposure at these levels needs that map before making a call.
How Goldman’s $4,900 target became the bearish version of its own forecast
The number matters less than its history. To understand why $4,900 is a more interesting figure than it first appears, you have to see where it sits in a sequence of revisions, because the same target has meant three very different things over nine months.
Goldman’s end-2026 forecast moved through three distinct phases:
- Phase 1, pre-January 2026: $4,900. Goldman was already publicly aligned with a $4,900 December target as far back as October 2025, with coverage at the time flagging “sticky, structural buying” and options-related hedging flows as upside risks to that number.
- Phase 2, January to March 2026: $5,400. Bloomberg reported on 22 January 2026 that Goldman lifted its target to $5,400 per ounce, citing analysts Lina Thomas and Daan Struyven and their confidence that private investors would hold gold as a macro-policy hedge and that central bank buying would continue. A 30 March 2026 Bloomberg article confirmed the bank retained that bullish view.
- Phase 3, mid-June 2026 onward: back to $4,900. Bloomberg reported that Goldman cut its year-end forecast by $500 an ounce, explicitly because the Fed was no longer expected to ease in 2026.
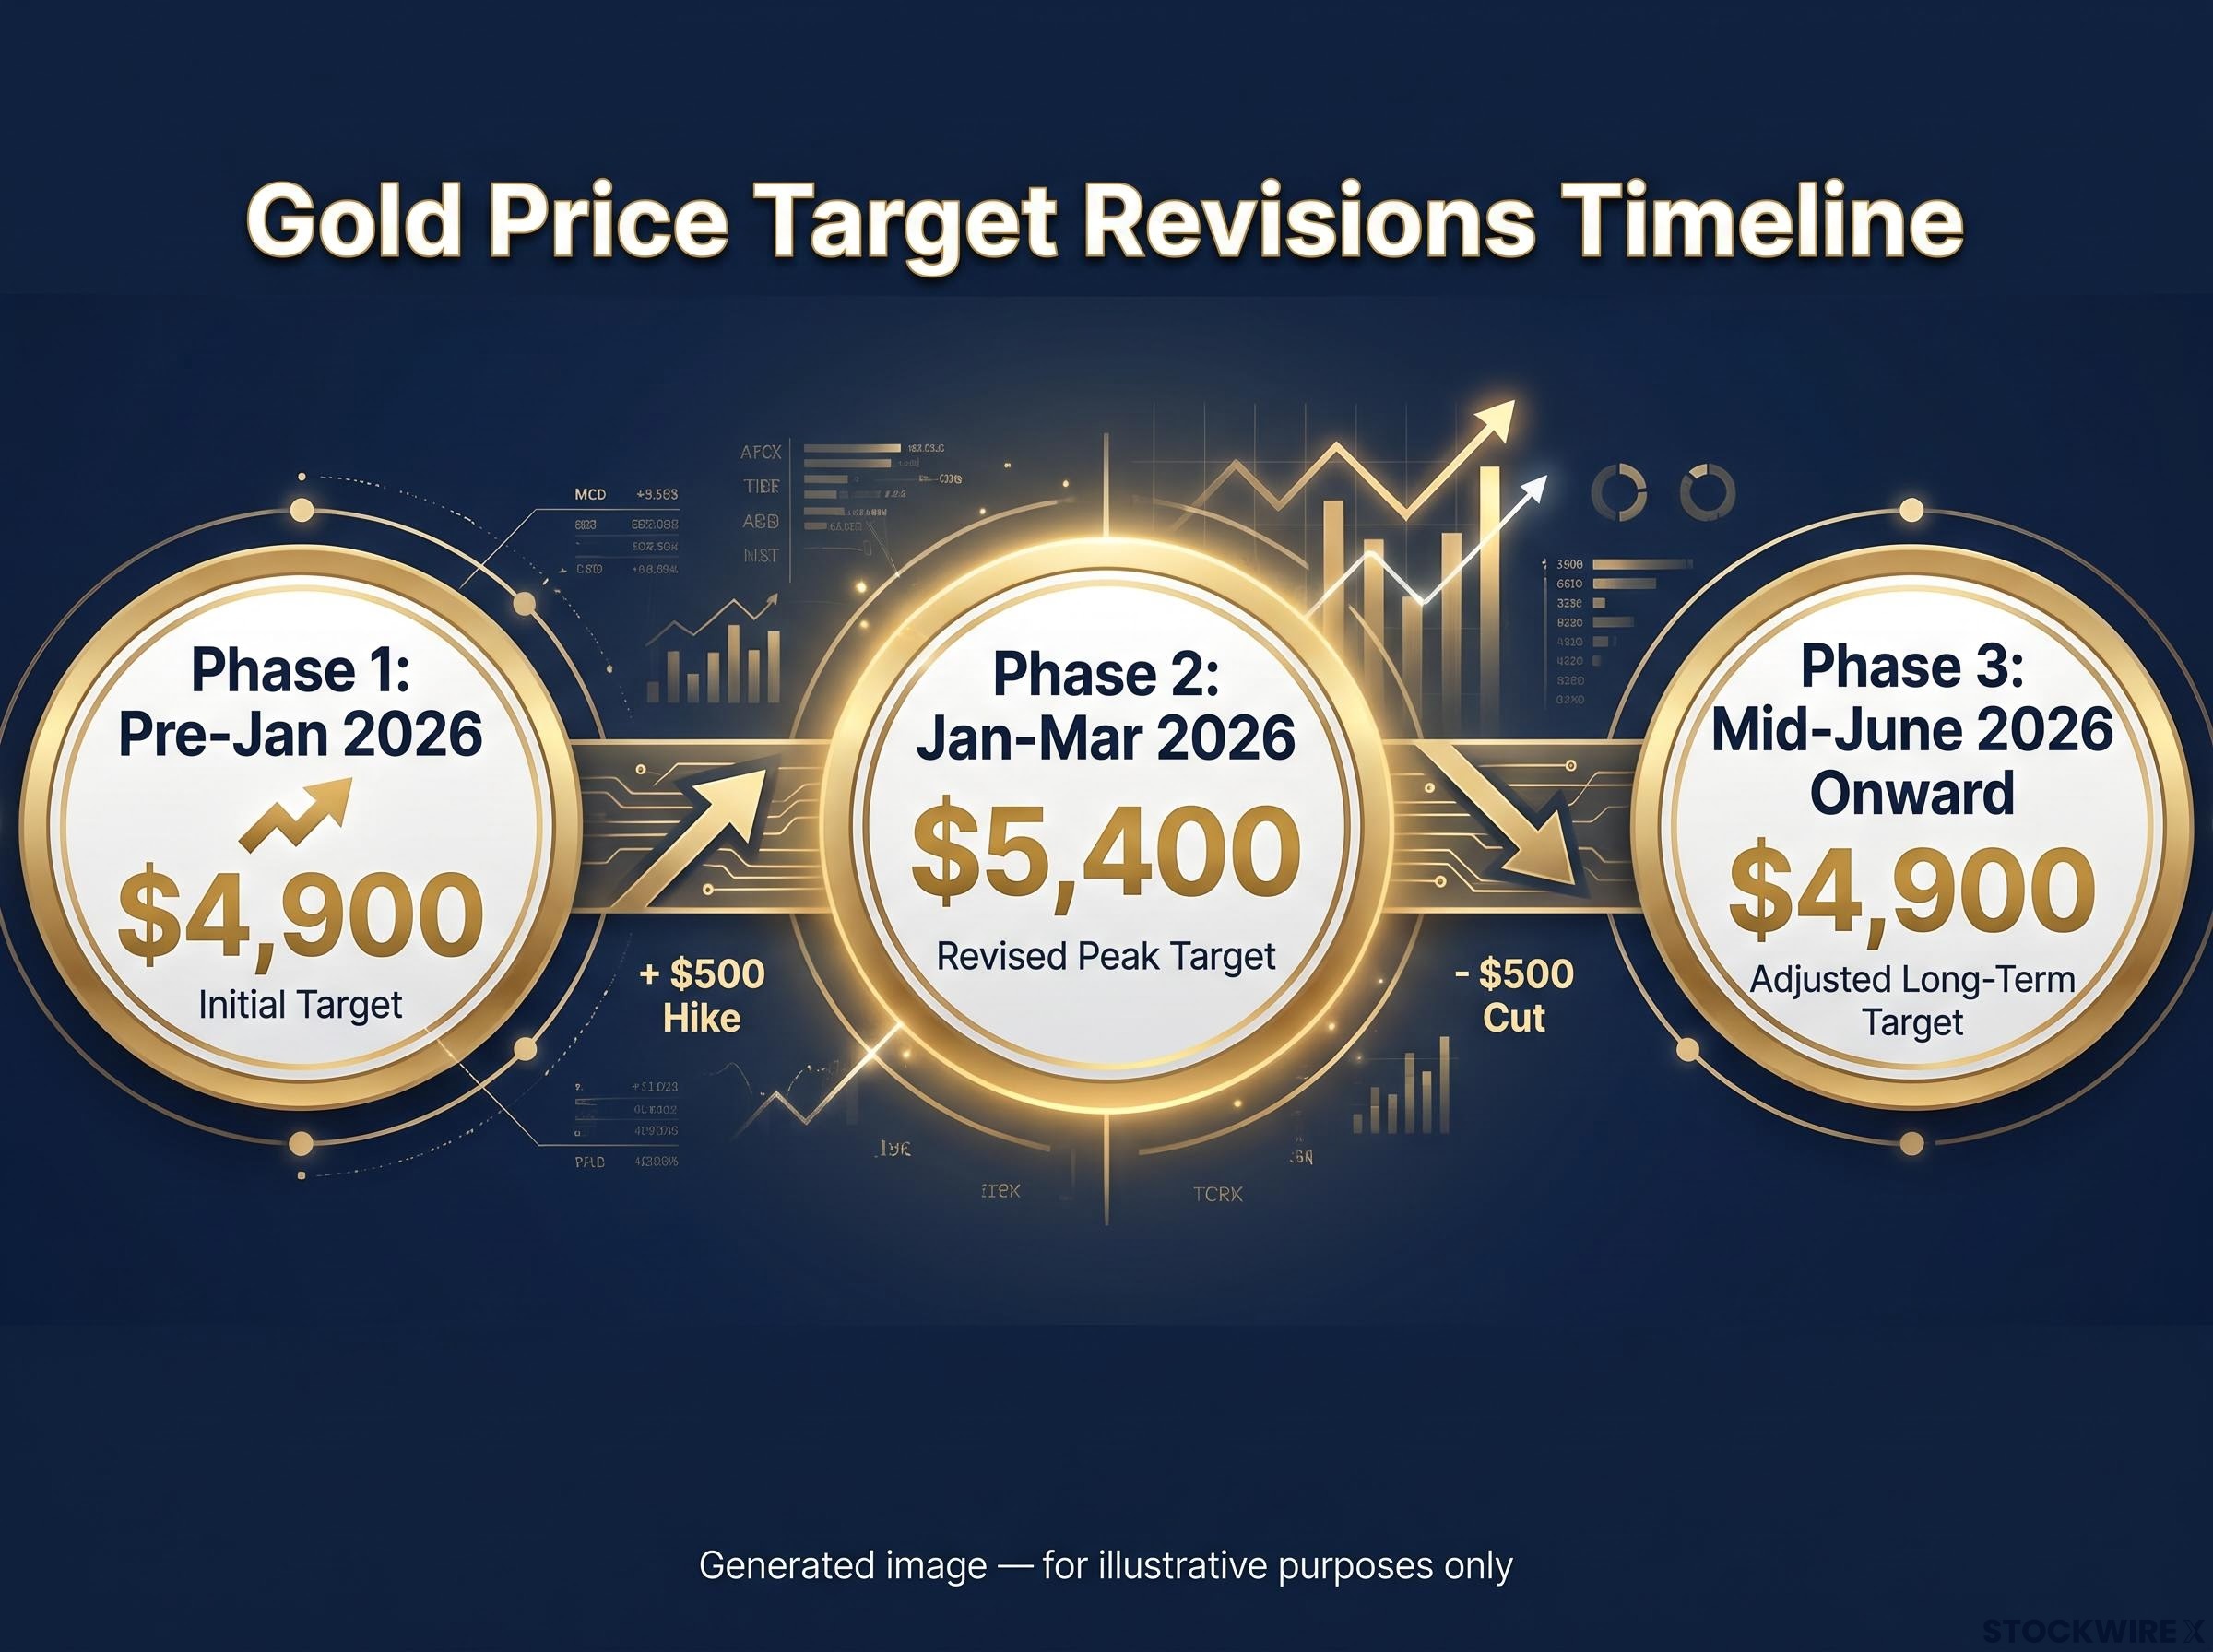
The reason for that June cut is the whole story. Goldman did not lower the target because the demand picture soured. It lowered it because one macro variable, the Fed’s rate path, moved against it. The structural framework stayed exactly where it was.
Thomas and Struyven summarised the revised stance in a single phrase.
The revised view is “structurally constructive but tactically cautious.”
The long-term thesis intact, the near-term trigger removed. That distinction is what tells you the $4,900 you see today is the floor of a range Goldman once valued $500 higher. The upside scenario the bank originally believed in is not gone. It is parked, waiting on the Fed.
The September 2026 position: $4,900, confirmed
The most recent public reaffirmations are Goldman’s own 28 August 2026 article and a Reuters-cited note reported on 11 September 2026, both holding the year-end target at $4,900.
There is a detail in that August article worth holding onto: the $4,900 figure explicitly excludes elevated demand for hedges via gold derivatives, which Goldman treats as additional upside sitting on top of the base case. The forecast, in other words, has a conservative layer built into it by design.
When big ASX news breaks, our subscribers know first
Why central bank buying has become the structural load-bearing wall
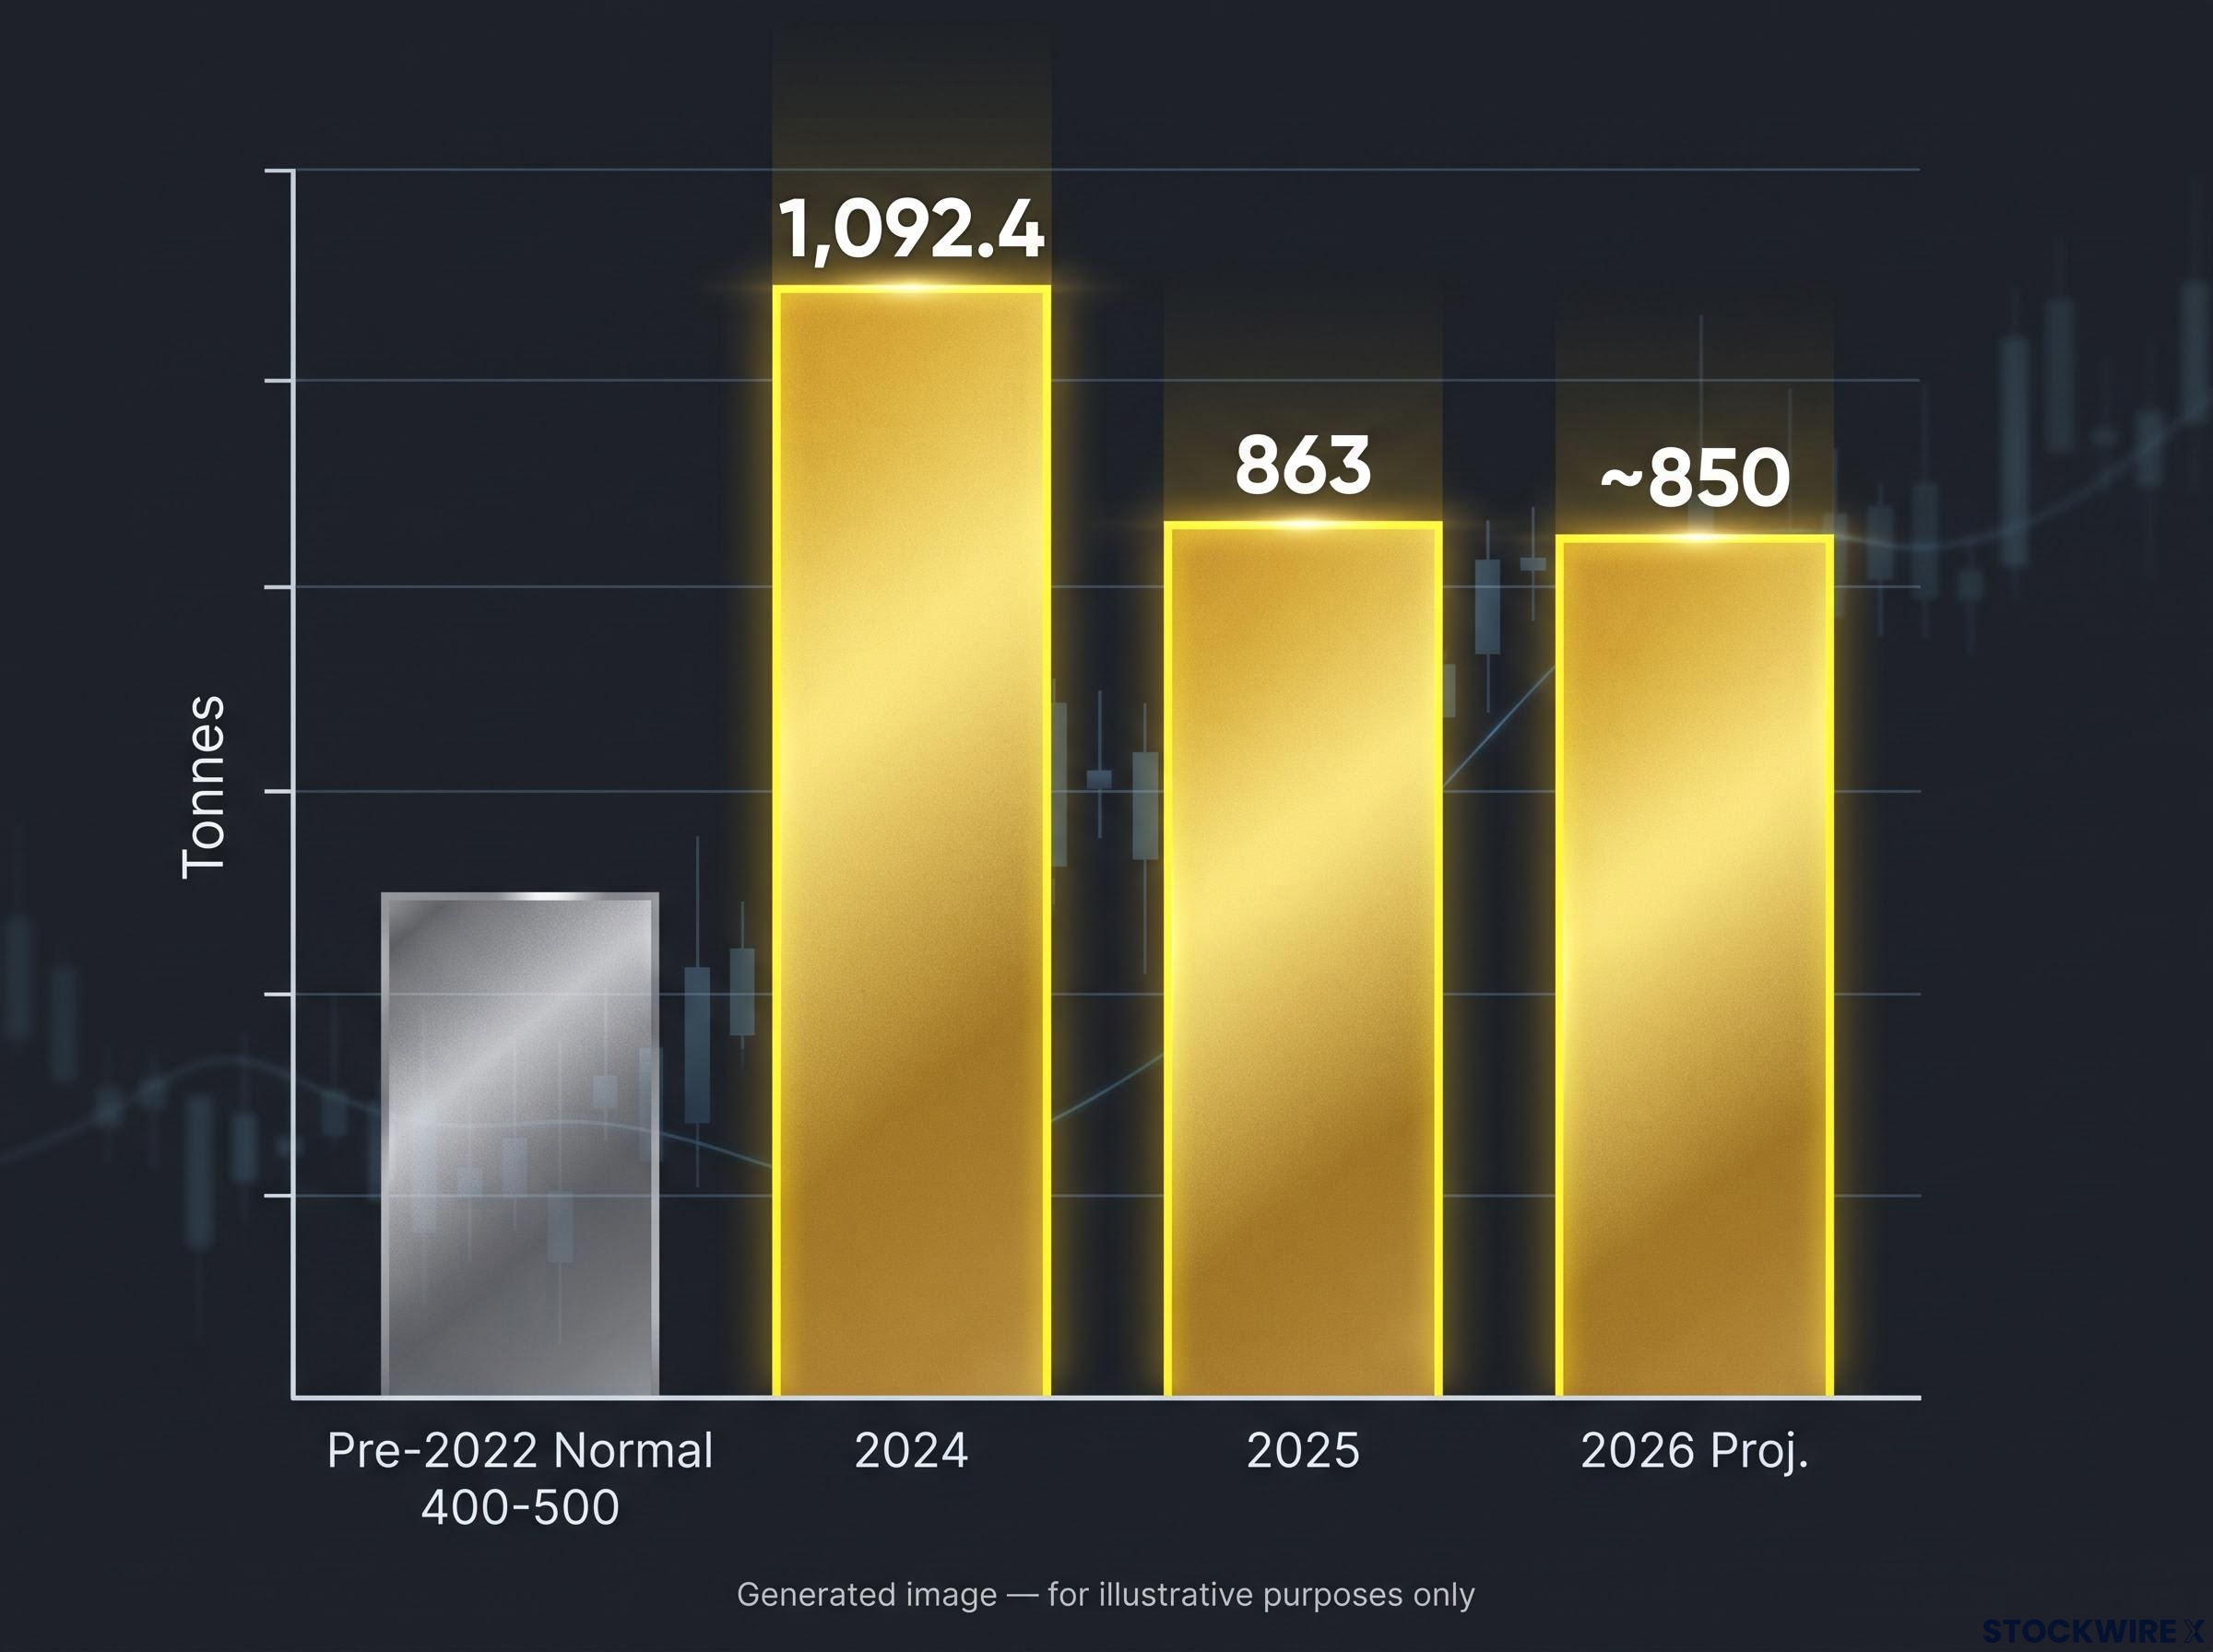
Start with the baseline. Before 2022, the world’s central banks bought gold at a fairly steady clip of roughly 400-500 tonnes per year. That was the normal. Hold that number in mind, because everything that follows is measured against it.
Then came the step-change. In 2024, central banks added 1,092.4 tonnes. In 2025, according to the World Gold Council’s full-year report published on 29 January 2026, they bought 863 tonnes, a 21% fall from the record but still comfortably double the pre-2022 norm.
The World Gold Council’s full-year 2025 demand report confirmed central bank purchases reached 863 tonnes for the year, still comfortably double the pre-2022 norm and the foundation on which Goldman’s structural demand floor argument rests.
The 2025 buying held up quarter after quarter, which is what makes it look structural rather than sporadic:
- Q1 2025: 244 tonnes, described by the WGC as 24% above the five-year quarterly average
- Q3 2025: approximately 220 tonnes
- Q4 2025: 230 tonnes
- Full-year 2025: 863 tonnes
The WGC projects roughly 850 tonnes for 2026, barely below the 2025 level. That consistency is the point. This is not a spike that fades.
The World Gold Council confirmed that total gold demand exceeded 5,000 tonnes in 2025 for the first time on record.
Now look at who is doing the buying, because the identity of the buyers is the real evidence. A single country stockpiling gold is a political story. Seven countries across multiple continents doing it is a structural one.
The sovereign buying motivation is categorically different from what most private investors are solving for: central banks are accumulating physically vaulted gold because it cannot be frozen, sanctioned, or restricted by a foreign government’s decisions, a distinction that became concrete when approximately $300 billion in Russian reserves were frozen in 2022 and that now drives reserve-composition reviews across dozens of institutions.
| Country | Central Bank | 2025 Purchases (tonnes) |
|---|---|---|
| Poland | National Bank of Poland | 102 |
| Kazakhstan | National Bank of Kazakhstan | 57 |
| Brazil | Central Bank of Brazil | 43 |
| Azerbaijan | State Oil Fund of Azerbaijan | 38 |
| Turkey | Central Bank of Turkey | 27 |
| China | People’s Bank of China | 27 |
| Czech Republic | Czech National Bank | 20 |
Eastern Europe, Central Asia, Latin America, East Asia. That spread tells you the buying does not depend on any single government staying the course. This is a broad-based diversification shift, which is why Goldman treats it as the load-bearing wall under its forecast rather than a temporary prop. For an investor judging whether the demand floor is durable, that breadth matters far more than the year-on-year decline. A 21% drop from a record still leaves purchasing at roughly twice its historical rate.
The rate mechanism: how the Fed’s pause is slowing ETFs without breaking the thesis
Here is the piece that trips up a lot of investors. Central banks are buying gold at near-record volumes, so why does the Federal Reserve’s rate path matter at all? The answer is that central banks are only one buyer. The other big one, exchange-traded fund investors, behaves in the opposite way.
The mechanism is opportunity cost. Gold pays no interest. When real yields rise, meaning the return on bonds and cash after inflation, holding a non-yielding asset becomes relatively more expensive. Portfolio allocators respond by rotating out of gold-backed ETFs and into interest-bearing instruments. Higher-for-longer rates therefore slow ETF inflows and can even trigger outflows from existing positions.
That is the exact channel Goldman’s Fed forecast runs through. Watch how the rate call and the gold target moved in lockstep:
- March 2026: Goldman expected two 25-bp cuts, in September and December 2026, taking the terminal rate to 3.00-3.25%. Gold target: $5,400.
- June 2026: Goldman scrapped 2026 cuts entirely, pushing them to June and December 2027. Gold target: cut to $4,900.
- September 2026: A Reuters factbox dated 15 September 2026 shows Goldman now projecting a possible 25-bp hike in October 2026, lifting the rate to 4.00-4.25%.
The gold target and the Fed call are the same story told twice. When easing left the forecast, so did $500 of gold.
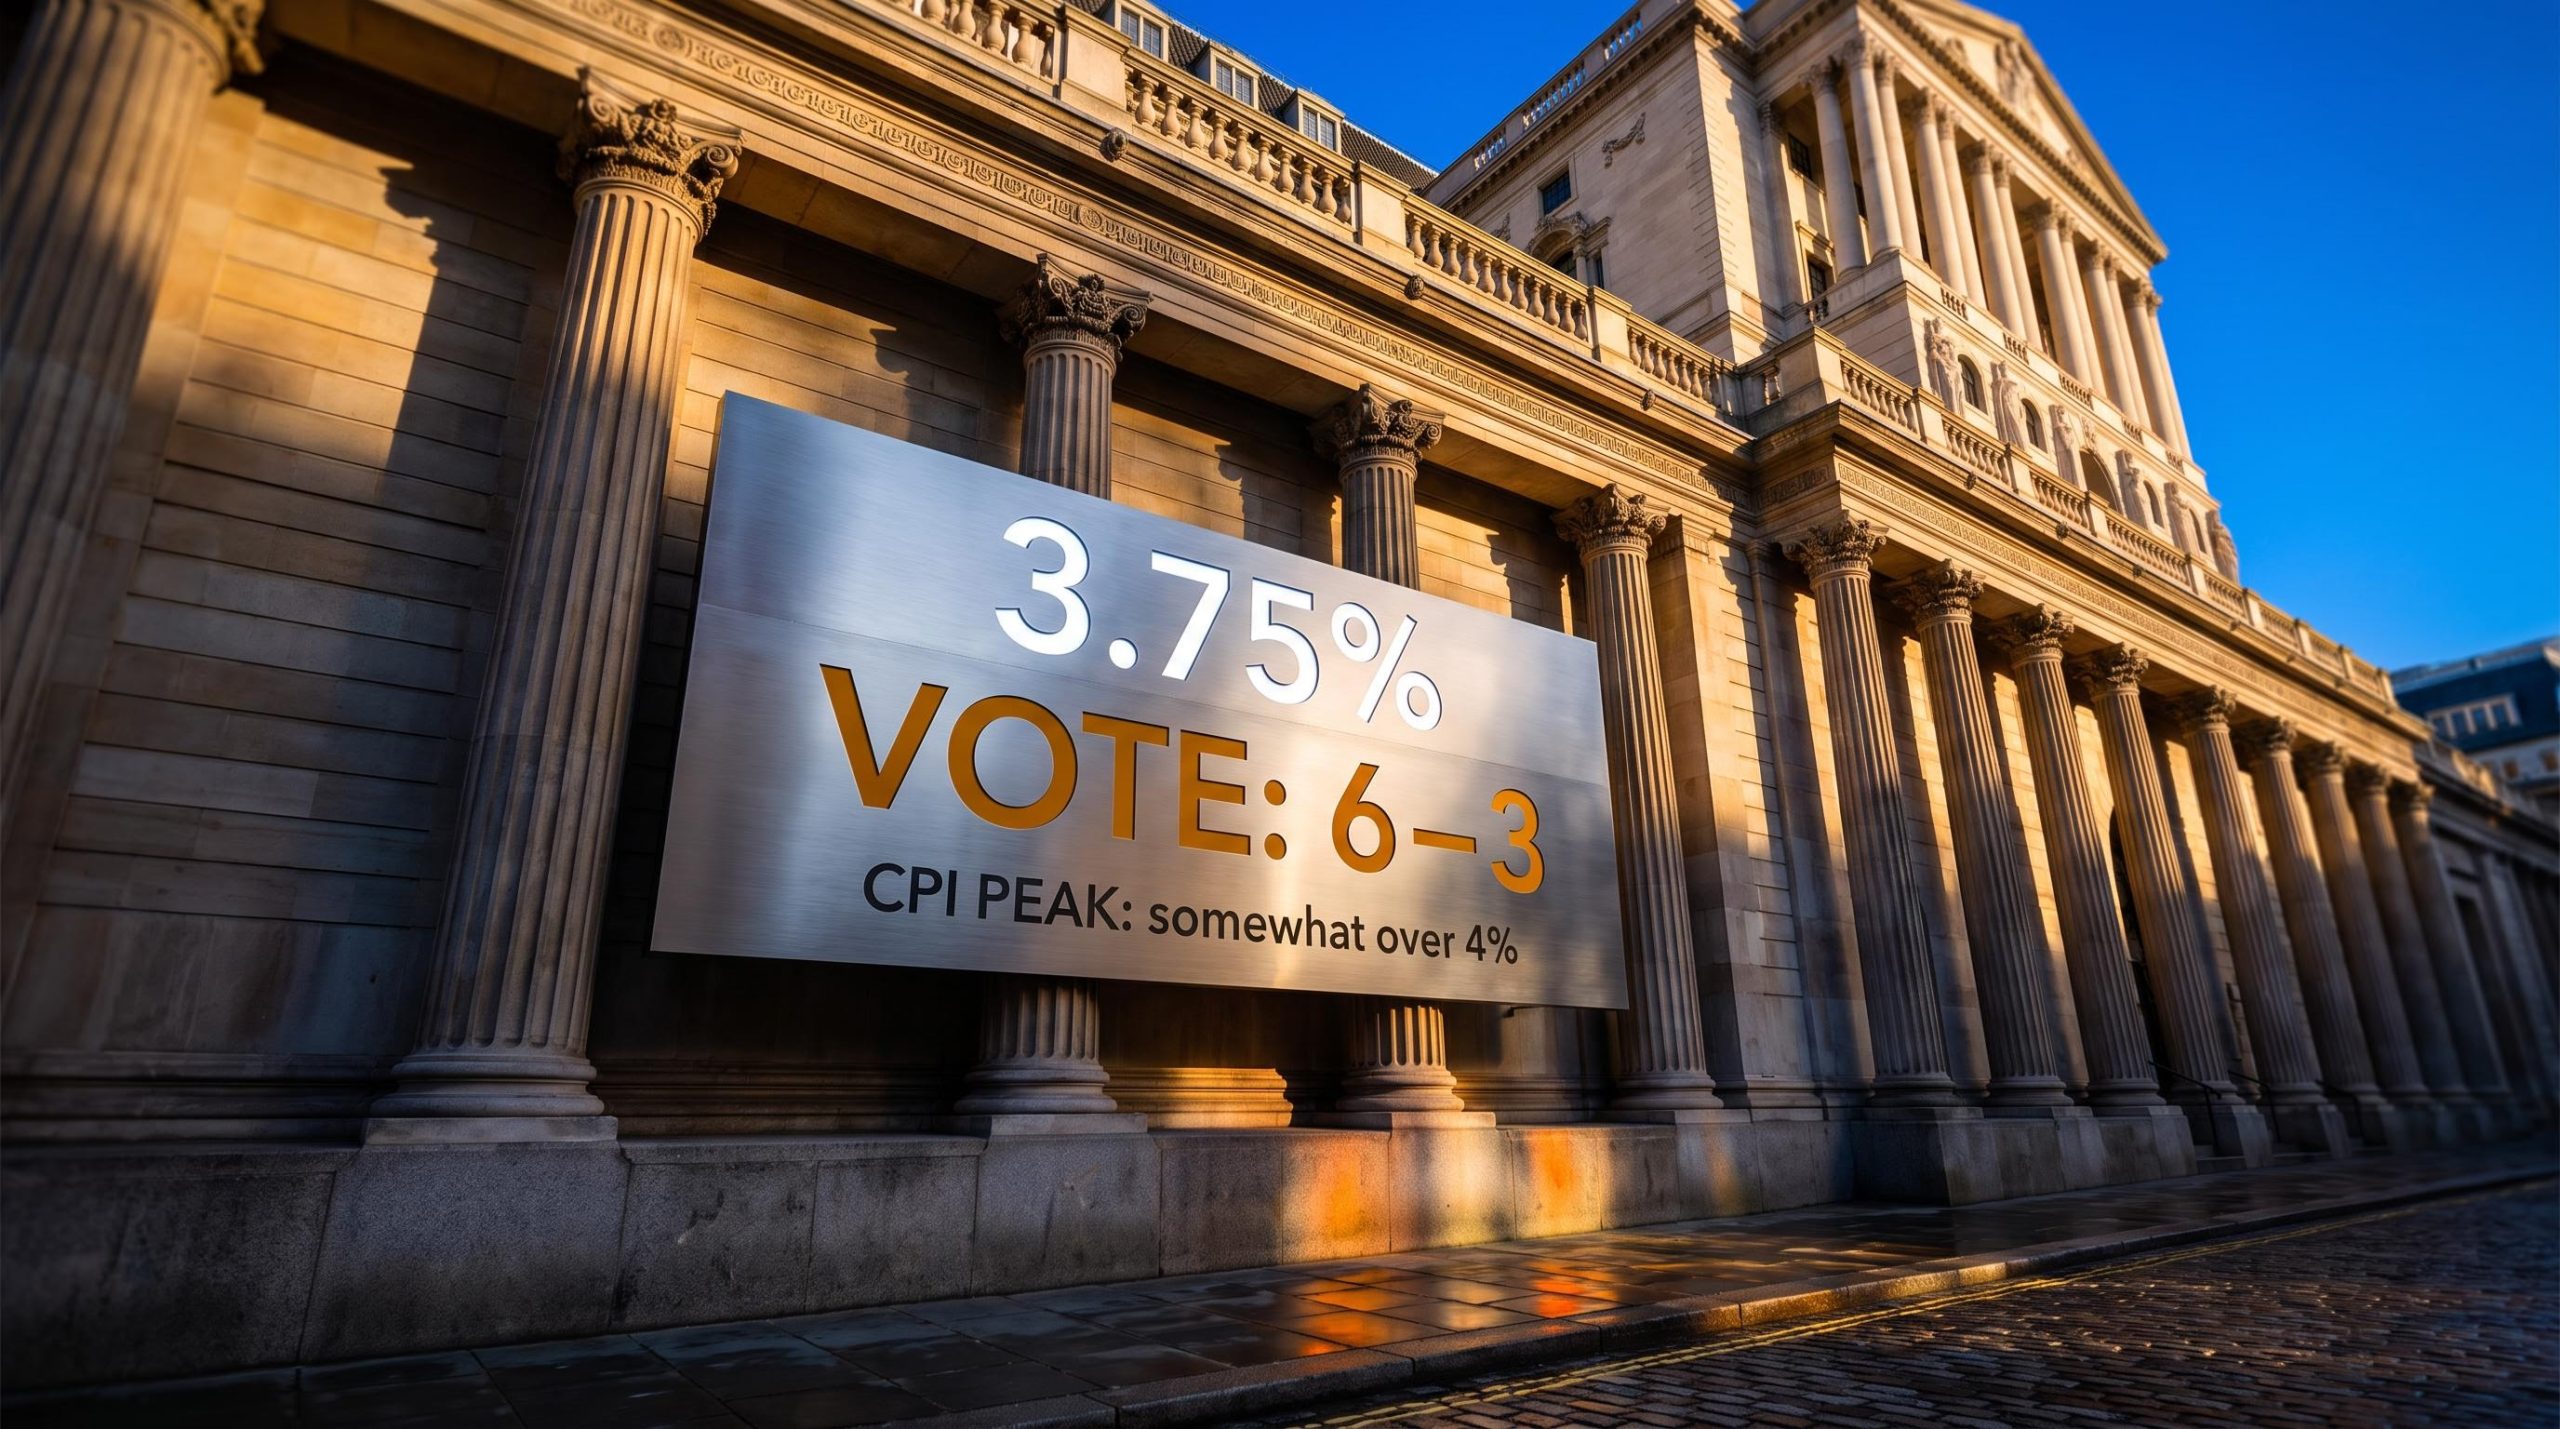
The Fed rate hike impact landed in concrete terms on 16 September 2026, when a unanimous 12-0 vote lifted the federal funds rate to 3.75%-4.00% and the dot plot eliminated any near-term cut scenario from the committee’s own projections, confirming the higher-for-longer pledge the article’s gold model is now built around.
The downside branch is explicit.
Goldman’s commentary sketches a scenario in which more aggressive Fed tightening pushes gold toward $4,400-$4,440 as macro-hedge positions unwind.
For scale, the WGC recorded total investment demand of 2,175.3 tonnes worth US$240 billion in 2025, which shows just how much force ETF flows can add when conditions turn favourable. That same force works in reverse when they do not.
What “already priced in” actually means for near-term positioning
This is where Goldman’s position gets nuanced. The bank argues that most of the ETF drag from delayed easing is already embedded in current positioning. Investors have adjusted for the current rate reality, so this is not fresh downside pressure waiting to hit.
For you, that cuts both ways. It limits further damage from the rate channel, which is reassuring. But it also means the climb to $4,900 leans more heavily on central banks than on ETF money rotating back in. The October 2026 decision is the variable to watch: if that hike lands, it stretches the ETF headwind by months and brings the $4,400-$4,440 downside into serious play, even with central banks still buying.
The options market and the asymmetric upside case Goldman is building
Everything so far has been about what already happened. The more revealing part is how Goldman frames the forward risk, because the options-market angle is not a footnote. It is a deliberate statement about where the bank thinks the balance of probability sits.
Recall that the $4,900 base case excludes derivatives hedging demand entirely. Goldman’s 28 August 2026 article is explicit on this point.
Goldman’s $4,900 forecast does not incorporate elevated demand for hedges via gold derivatives, which the bank treats as an additional upside risk.
That exclusion is a signal. It means the base case has a conservative layer folded in, and the conditions under which that layer gets added back, primarily a Fed shift toward easing, are identifiable rather than mysterious. This is not the first time the theme has surfaced; October 2025 coverage of Goldman already flagged “upside risk” from sticky structural buying and options-related hedging, months before the $5,400 upgrade actually arrived.
Mainstream ETF participation sat on the sidelines through much of the first leg of the rally, with global gold ETFs recording net sales of nearly 800 tonnes between Q4 2020 and Q2 2024 even as prices roughly doubled, which means the ETF inflow cycle Goldman identifies as a conditional upside driver is a beginning rather than an established trend.
Now weigh the two sides against the current spot of roughly $4,355:
| Scenario | Price Target | Key Condition | Distance from Spot |
|---|---|---|---|
| Downside | $4,400-$4,440 | Fed tightens beyond base case | ~1-2% |
| Base case | $4,900 | No further cuts, buying holds | ~12.5% |
| Prior bull case | $5,400 | Fed expectations turn to easing | ~24% |
Look at the asymmetry. The downside scenario sits slightly above current spot. The prior bull case is more than $1,000 above it. Goldman also names a second potential upside driver alongside derivatives: a broadening of gold diversification to private investors, layered on top of central bank buying. That is demand expansion, not rotation, and it is not in the base case either. The read for you is that the scenarios which could beat $4,900 are more numerous and larger in magnitude than the one that breaks below it.
What the $4,900 call actually requires investors to believe
Flip the question around. Instead of asking what Goldman predicts, ask what you have to believe for the forecast to hold. Reduced to essentials, the $4,900 target rests on two assumptions:
- Central bank buying stays near current elevated levels, around 850 tonnes in 2026. The risk: purchases are already down 21% from the 2024 peak, and the WGC warns they are unlikely to return to the 2022-2024 extremes.
- No material Fed tightening beyond what is currently projected. The risk: Goldman itself is now floating an October 2026 hike, which goes beyond the base case the $4,900 target is built on.
Be honest about the tension in each. Both assumptions face real pressure, and the WGC is not shy about it.
The World Gold Council warns that record prices are beginning to constrain official buying, making it “increasingly unlikely” that demand matches the prior three-year highs.
The two assumptions are not equally fragile, and that distinction is where you should focus. Central bank buying near 850 tonnes is well-evidenced by a consistent recent trajectory. The Fed path, by contrast, has been revised toward tightness three times in 2026 alone. The policy assumption is the weaker leg of the stool.
Entry level, volatility, and the short-term risk picture
There is also the matter of entering now. Reuters recorded gold swinging between roughly $4,323 and $4,488 in early September 2026 as traders reacted to inflation and jobs data. That is meaningful two-sided volatility at elevated levels.
Goldman itself flags the potential for greater-than-typical price swings. If drawdown risk matters to you as much as medium-term direction, that caution is aimed squarely at anyone buying at or near current spot. The medium-term thesis holding does not protect you from a sharp near-term pullback.
Positioning for gold when the structural case and the near-term friction are both real
Put the two halves together and the honest picture is this: the structural case is credible but not automatic, and the near-term friction is real but largely mapped rather than unknown. The central bank floor is genuine, and derivatives hedging is an upside option Goldman has deliberately left unpriced. Against that, elevated rates are suppressing ETF flows, and a possible October hike could extend that drag.
Goldman’s argument in one line: structural central bank buying provides the floor, and derivatives demand is the ceiling it has not yet built into the base case.
Sovereign debt and gold allocation are increasingly linked in institutional frameworks, with BlackRock, JPMorgan, and Swiss pension funds explicitly replacing bonds as a portfolio diversifier with gold after the stock-bond correlation breakdown documented by the BIS in 2022-2023 invalidated the traditional 60/40 hedge.
The trigger that converts the tactically cautious stance back to the $5,400 bull case is specific: a shift in Fed expectations toward easing in 2026, or a material acceleration in 2027 cut expectations. Goldman’s own forecast history from January to September 2026 shows how fast that $500 swing can materialise once the policy assumption moves. Investors waiting for full rate certainty may be watching from the sidelines when it does.
Rather than a directional call, three variables are worth tracking:
- The October 2026 Fed decision, the single most fragile assumption in the whole thesis.
- The pace of central bank buying through the WGC’s Q3-Q4 2026 data, testing whether the 850-tonne run rate holds.
- Call-option positioning and open interest in gold derivatives, a leading indicator of when Goldman’s excluded upside starts getting priced in.
This article is for informational purposes only and should not be considered financial advice. Investors should conduct their own research and consult with financial professionals before making investment decisions. Past performance does not guarantee future results, and financial projections are subject to market conditions and various risk factors. Forecast scenarios discussed here are speculative and subject to change based on market developments and central bank behaviour.