
UBS just labelled UK equities “Attractive” and “Least Preferred” at the same time. That is not a typo, and it is not a hedge.
It is one of the world’s largest wealth managers telling investors two things at once: UK stocks are worth owning on their own merits, and yet UBS still expects better returns elsewhere. Both statements are true simultaneously, and understanding why is the difference between reading the upgrade correctly and misreading it entirely.
The timing sharpens the question. The FTSE 100 trades at 12.4x forward earnings, below its historical median, amid a commodity-driven earnings surge, gilt yields at multi-decade highs, and a Bank of England warning about concentration risk. The institutional signals are genuinely mixed, and this upgrade arrived at a specific, narrow entry window tied to recent price weakness.
Here is what the dual rating actually means in practice, and what anyone weighing UK equity exposure needs to consider before acting on it. Not the headline, but the mechanics underneath it.
The contradiction at the heart of UBS’s UK call
The puzzle resolves the moment you understand that UBS is answering two separate questions, not contradicting itself on one.
On 18 September 2026, Matthew Gilman, Head of CIO Europe Equity Strategy at UBS, upgraded the bank’s absolute stance on UK equities to “Attractive.” That rating measures one thing: expected risk-adjusted returns for UK equities in isolation. Are they worth owning on their own terms? UBS now says yes.
The “Least Preferred” rating measures something entirely different. It ranks UK equities against other global regions, and on that scale UBS still puts the UK behind alternatives such as Eurozone or US equities, markets with broader cyclical sensitivity, structural growth, or heavier technology and AI exposure.
| Rating dimension | Absolute: Attractive | Relative: Least Preferred |
|---|---|---|
| What it measures | Expected risk-adjusted returns for UK equities on their own | UK’s rank against other global equity regions |
| What triggered it | A recent price decline UBS saw as a compelling entry point | Structural preference for higher-growth, tech-heavy markets |
| Portfolio implication | UK exposure is defensible on its merits | Better returns still expected elsewhere |
The upgrade was tactical, not structural. UBS benchmarked the FTSE 100 at roughly 10,650 before the call, and the index sat near 10,816 on the upgrade date. The trigger was price, not a reassessment of the UK’s long-term growth potential.
The same UBS CIO framework that upgraded UK equities also underpins a broader global equity broadening thesis, projecting 21% worldwide corporate earnings growth in 2026 and an accelerating catch-up trade in European and Asian markets with heavier exposure to real-economy AI adoption.
What UBS cited for the upgrade Cheap valuations at 12.4x forward earnings versus a 12.8x median since 1990, strong dividend and buyback yields, and anticipated earnings gains from elevated energy prices.
This distinction matters more than it first appears. Acting on “Attractive” without understanding “Least Preferred” is a category error. One tells you the UK is worth owning; the other tells you UBS would still rather own something else. Read only the first, and you mistake a tactical value call for a high-conviction buy signal it was never meant to be.
When big ASX news breaks, our subscribers know first
What is actually driving UK earnings right now, and how long does it last?
Follow the earnings story forward and it reads less like a growth narrative and more like a countdown.
The engine is commodities. Energy accounts for roughly 18% of MSCI UK total earnings in 2026, so with Brent crude above $100 per barrel in early autumn, elevated oil prices feed almost directly into index-level earnings growth. This is why UBS raised its 2026 UK corporate earnings growth projection to 16%, up from the 11% it estimated in July and August, citing stronger Q2 earnings and climbing energy prices.
Goldman Sachs runs even hotter on the near term.
- UBS: 2026 UK corporate earnings growth of 16%, revised up from 11%
- Goldman Sachs: FTSE 350 EPS growth of 21.5% for 2026, revised up from 19.7% in July, driven mainly by Energy and Basic Resources
- UBS 2027: earnings growth moderating to approximately 9% as the commodity boost fades
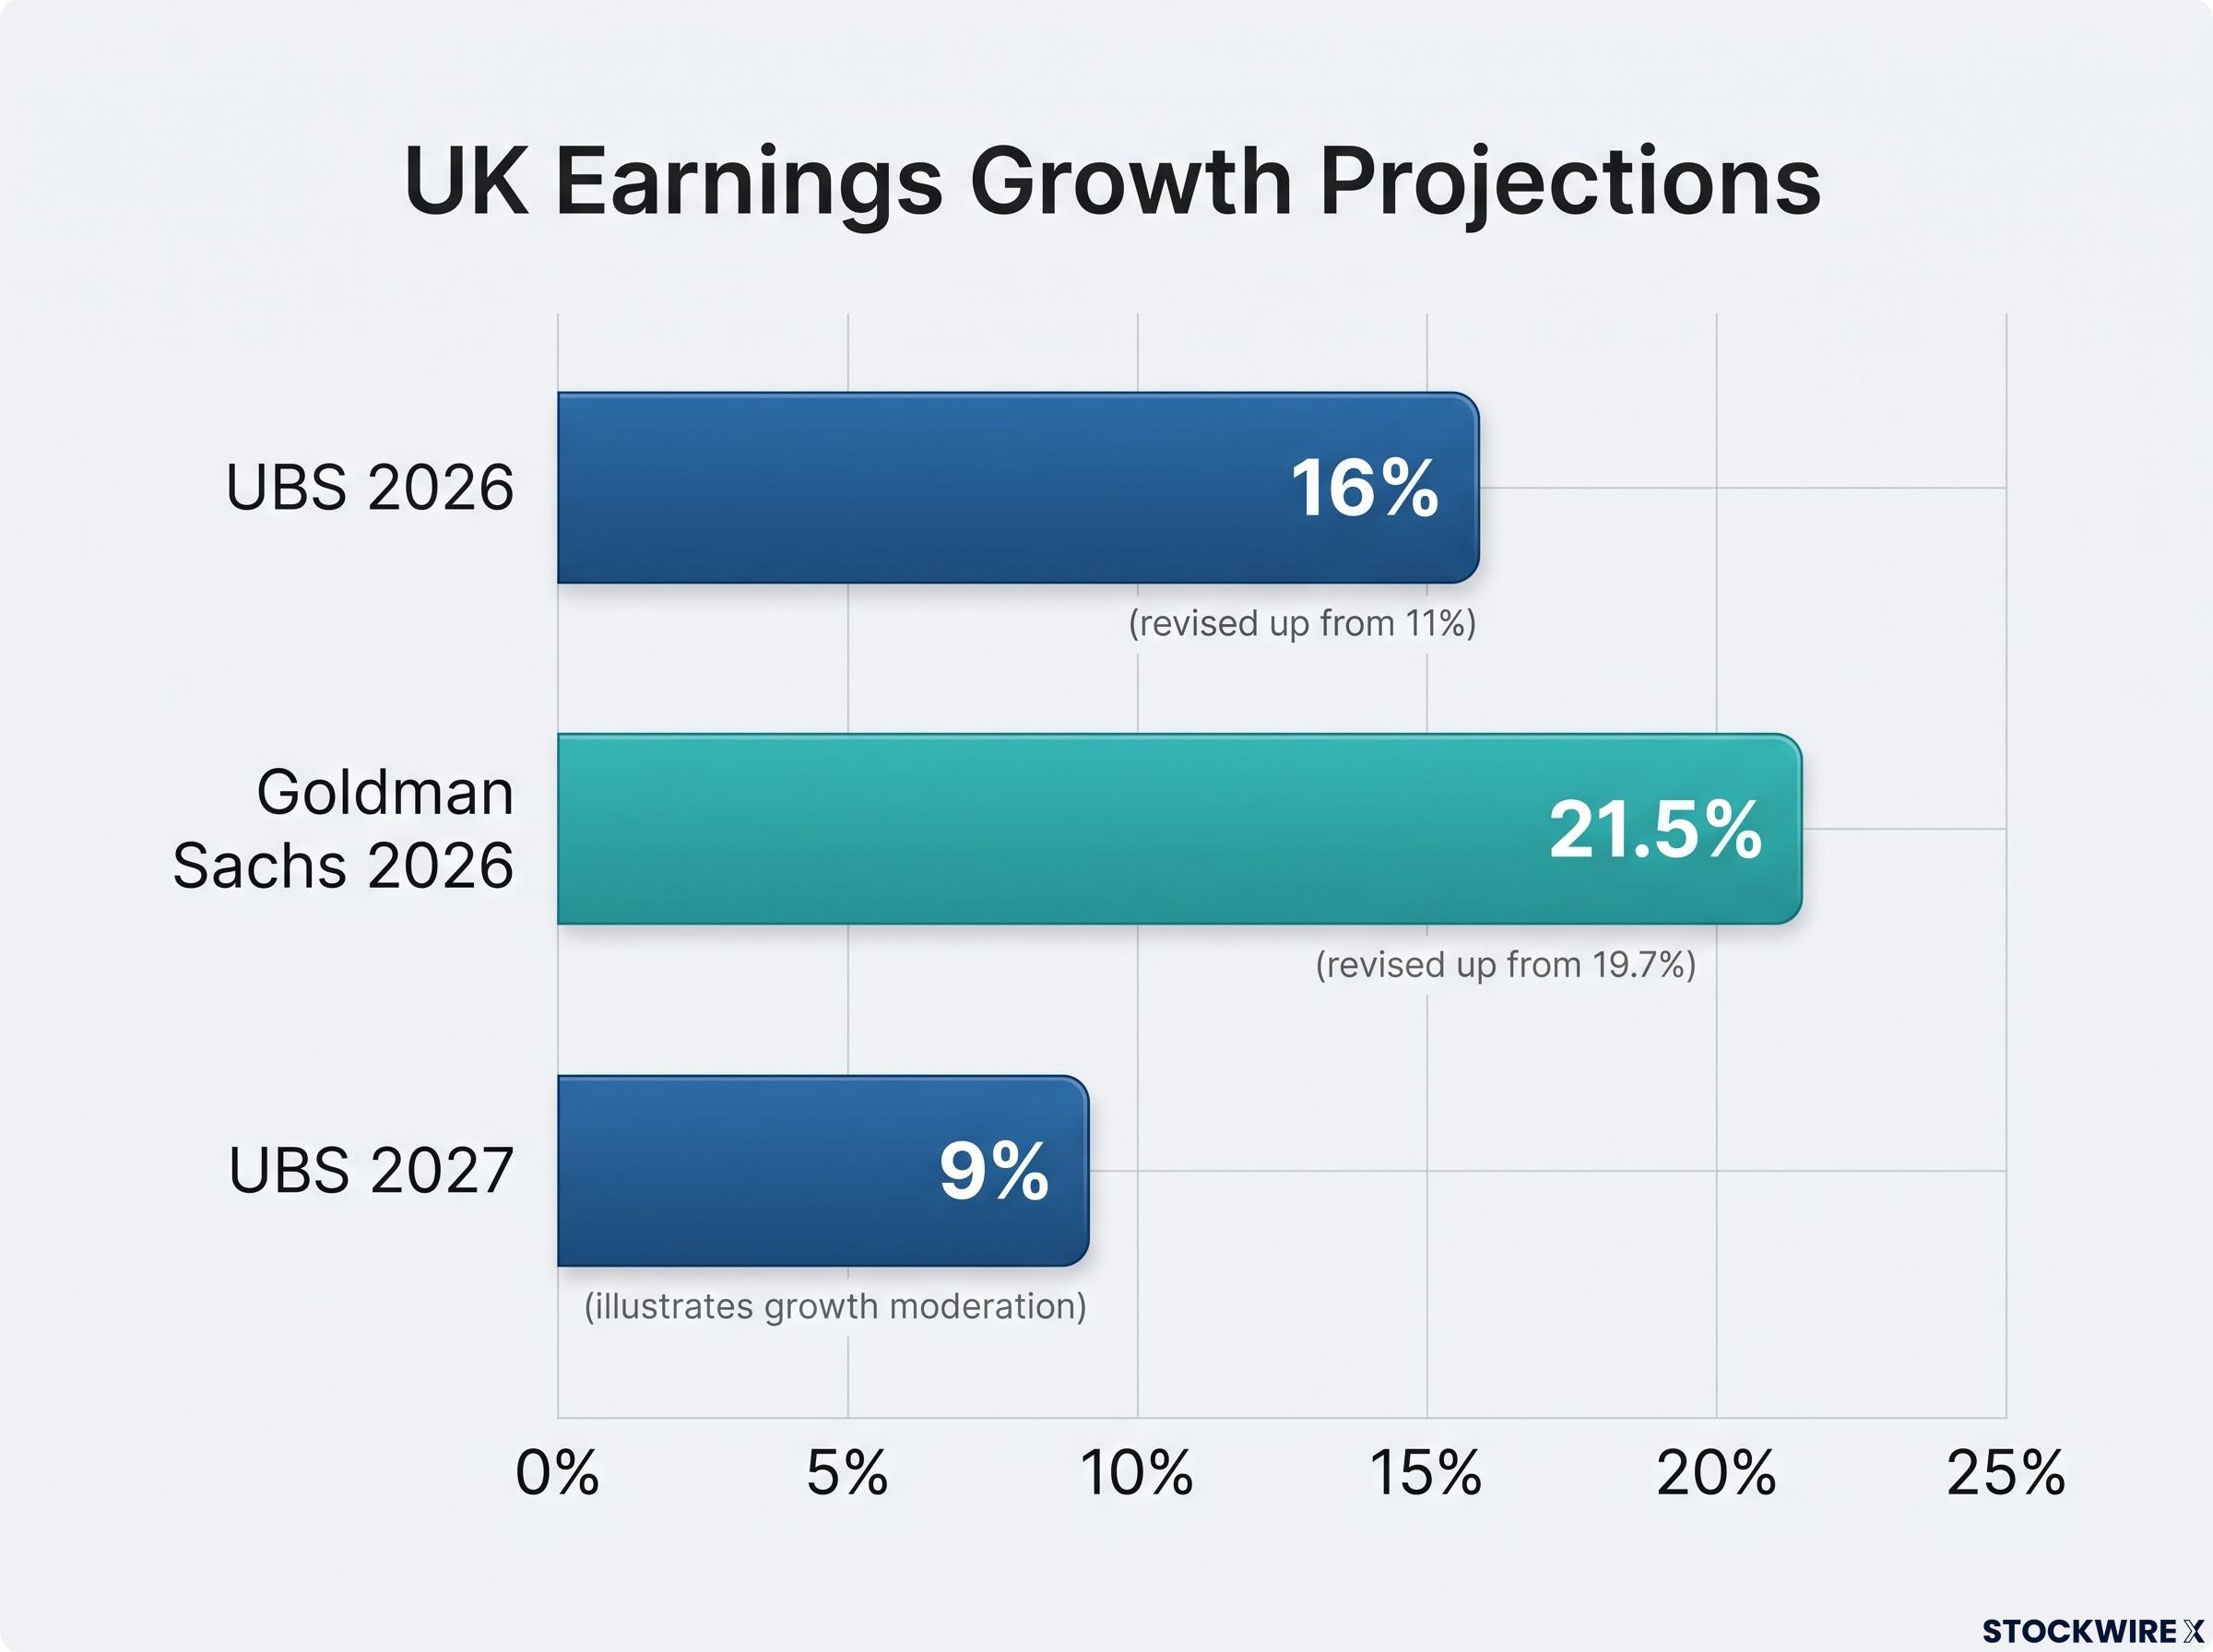
A 16% earnings year would normally justify a re-rating. The problem is where the growth comes from. It is largely borrowed from a commodity cycle rather than earned through structural productivity, which means the clock on this opportunity is already running, and sector exposure matters more than the headline number suggests.
The 2027 deceleration: what moderation to 9% actually signals
Moderating to 9% in 2027 is not a contraction. It is a return to trend, and on its own it would be unremarkable.
The risk sits in the gap between the two years. If markets price the current commodity-elevated run rate as the new normal, then a 9% print arriving alongside softer energy prices could force a downward re-rating precisely when the earnings tailwind thins.
The UK’s structural composition compounds this. With little technology or AI exposure to lean on, the index has limited ability to find an alternative earnings driver once commodity tailwinds ease. That is what makes the current window time-sensitive: enter early in the cycle and the risk profile looks very different from entering late, with the same index level but a very different runway ahead.
How UBS’s price targets frame the range of outcomes
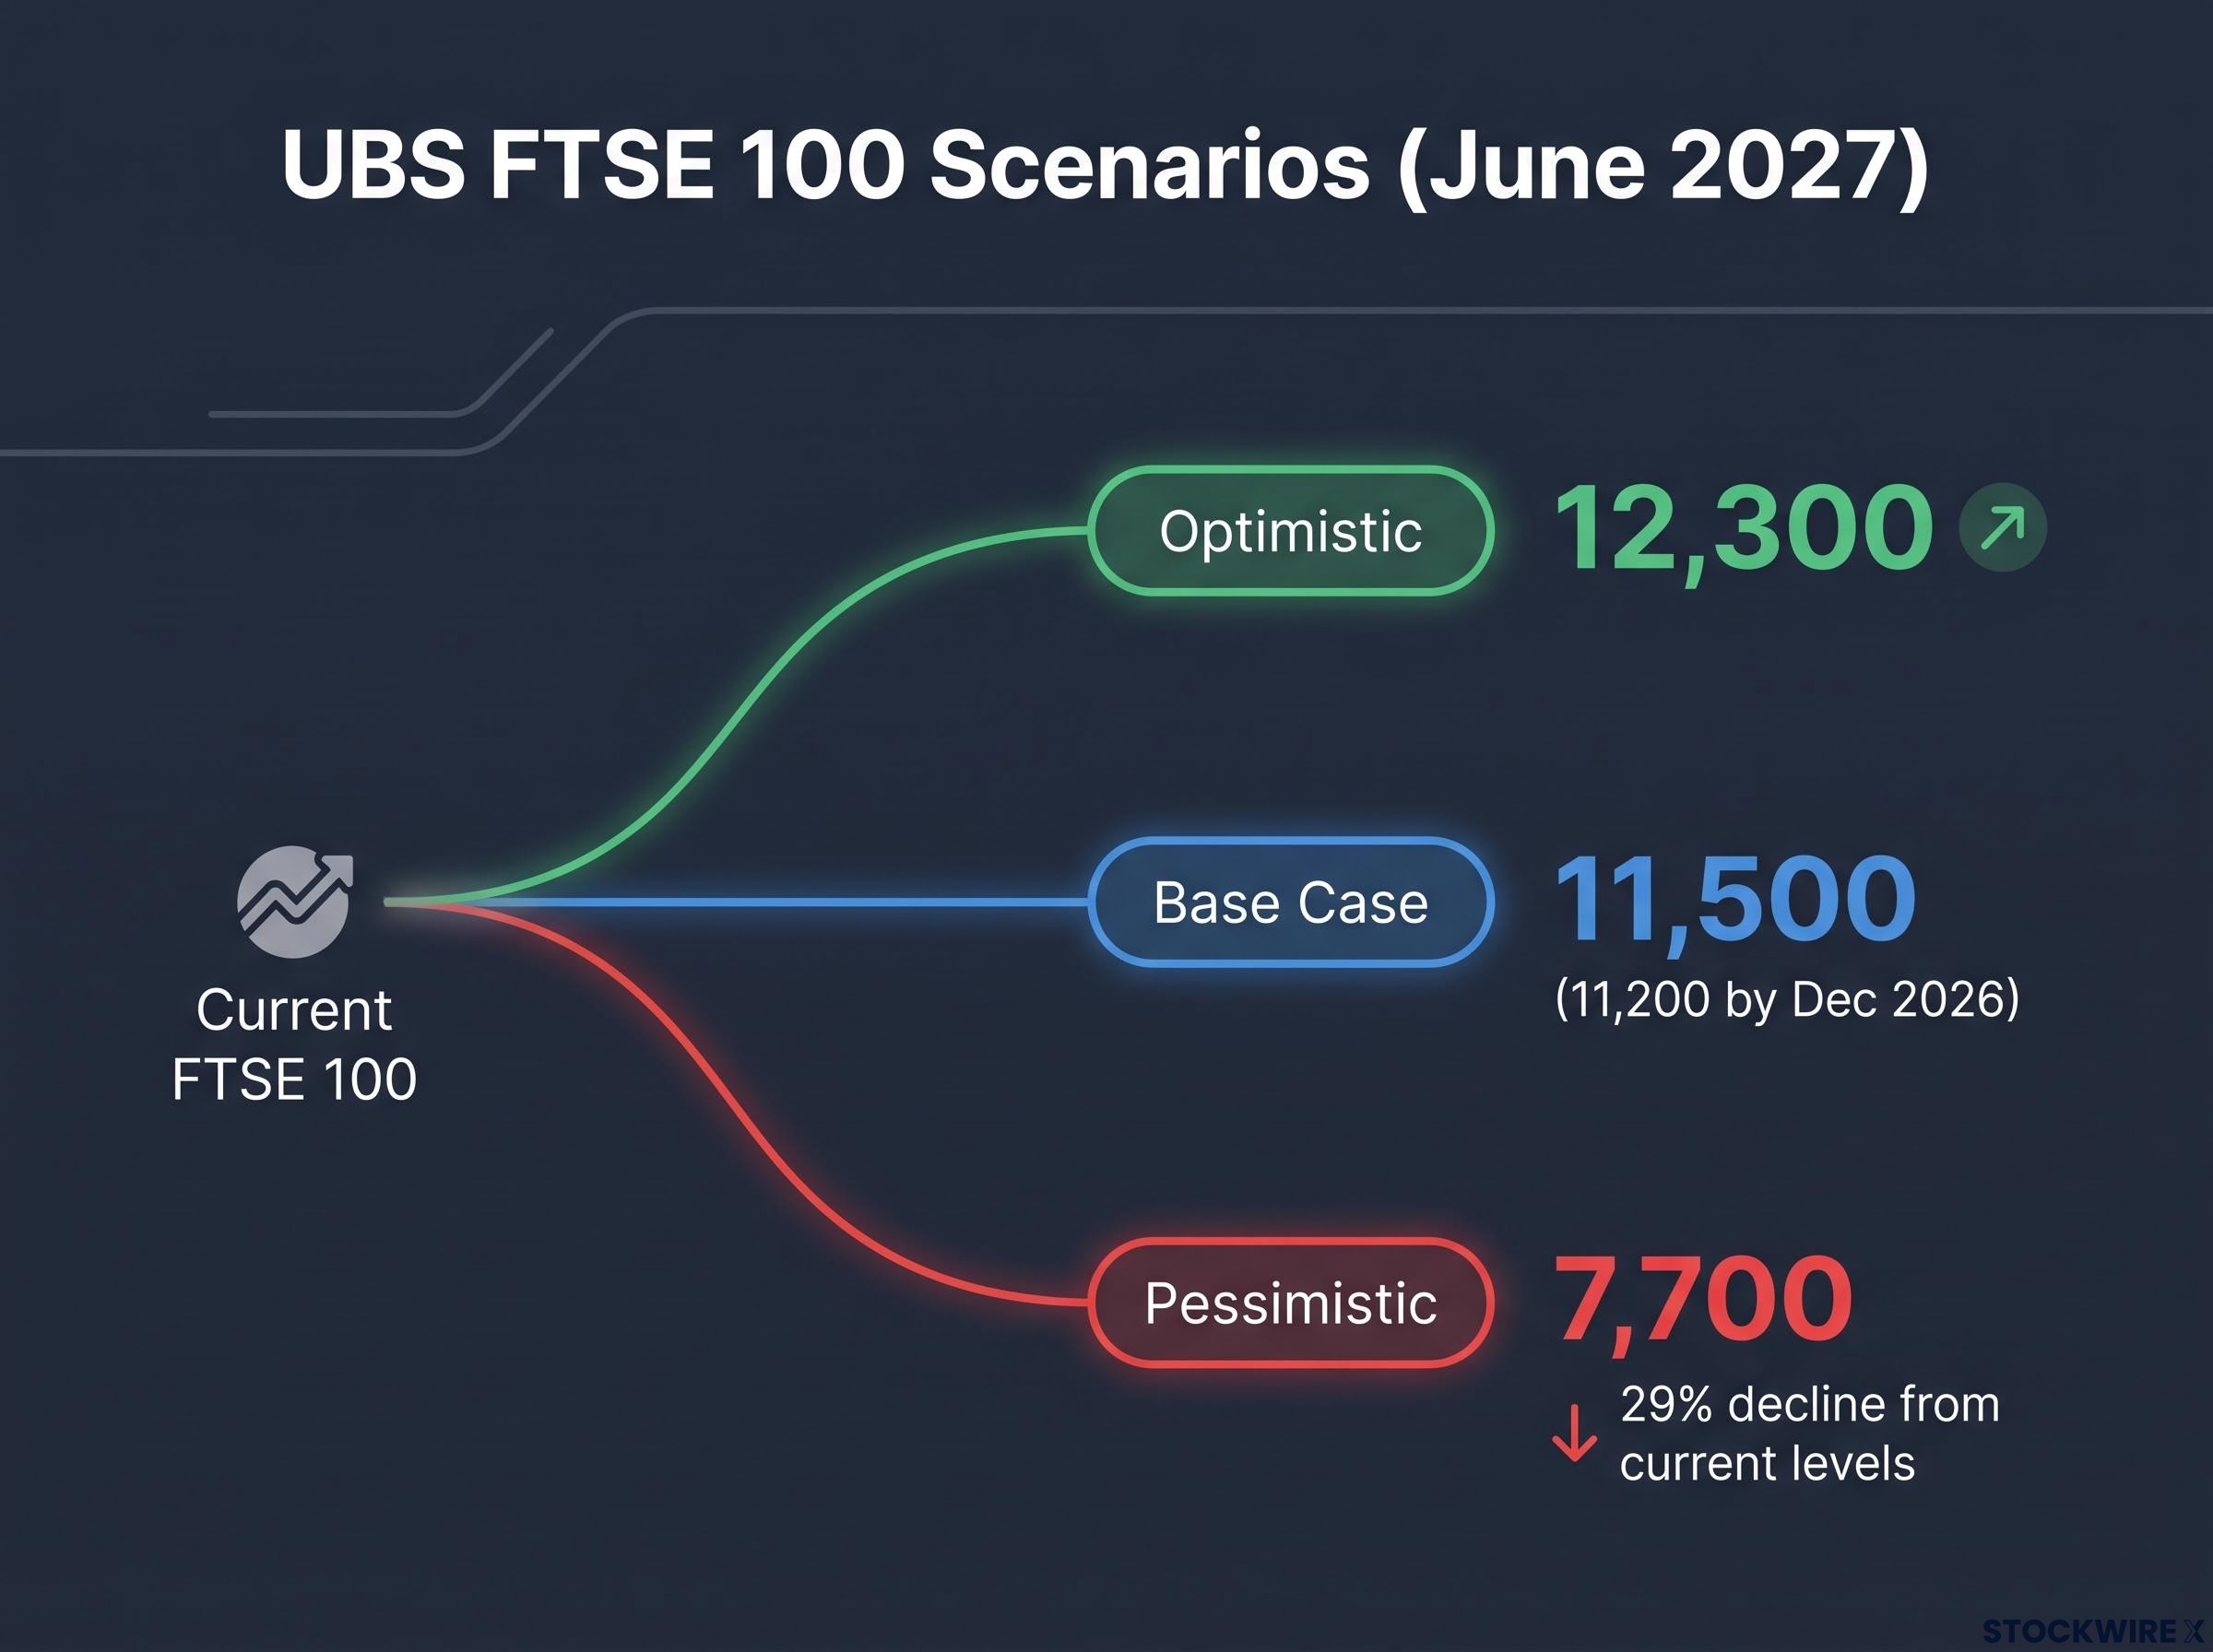
UBS’s three scenarios are not a menu of forecasts to pick from. They are a risk map, and each destination is wired to specific macro variables the reader can actually watch.
| Scenario | FTSE 100 target (June 2027) | Key conditions required | Primary risk factor |
|---|---|---|---|
| Base case | 11,500 (11,200 by Dec 2026) | Contained energy prices, limited duration of rate increases | Commodity cycle timing |
| Optimistic | 12,300 | Accelerated global growth, demand-driven commodity gains, sterling depreciation, more US allocation to UK, rate cuts | Dependent on factors outside domestic control |
| Pessimistic | 7,700 | Prolonged Middle East energy disruption, trade protectionism, falling commodity prices, higher bond yields, stronger sterling | All trigger conditions currently live |
The optimistic path to 12,300 leans heavily on things the UK cannot control. Sterling depreciation and a decision by US investors to allocate more to UK assets are both external levers, which makes the upside less a plan than a hope for favourable conditions.
The downside deserves equal attention, because it is not a statistical tail.
Pessimistic scenario: 7,700 by June 2027 A 29% decline from current levels, triggered by prolonged Middle Eastern energy disruption, renewed trade protectionism, declining commodity prices, higher bond yields, and an appreciating pound.
Every one of those triggers is observable right now. Thirty-year gilt yields recently reached roughly 5.81%, their highest since 1998. The Bank of England’s July 2026 Financial Stability Report warned that the risk of a sharp equity correction “remains high” on concentration grounds. Middle East tension is already in the oil price.
The Bank of England July 2026 Financial Stability Report flagged that the risk of a sharp equity correction ‘remains high’ on concentration grounds, a warning that sits directly alongside the valuation signals UBS and others cite when framing the UK opportunity.
So the 7,700 figure is not a hypothetical worst case pulled from a spreadsheet. Its conditions are live, which means position sizing should price that possibility explicitly rather than treating it as remote. The spread from 7,700 to 12,300 by mid-2027 is vast, and knowing which macro variables drive which outcome gives an early-warning framework rather than a reason to react after the move has already happened.
Where the broader institutional debate sits, and why the UK discount persists
UBS is far from the only voice here, and the institutional picture is more divided than a simple bullish-or-bearish read allows.
Goldman Sachs targets the FTSE 100 at 11,400 over 12 months, roughly 5.2% upside from mid-September levels, pointing to near-zero pairwise correlations between UK stocks, strong inbound M&A, and free cash-flow yields around 6%, among the highest globally. Barclays frames UK stocks as unloved but not a bad place to hide, arguing the FTSE’s sector mix suits an environment of AI and oil worries. BlackRock treats the UK as a diversifier, favouring banks, dividend-rich sectors, and miners.
The valuation gap they all cite is striking.
J.P. Morgan estimate The UK trades at roughly a 40% discount to global equities, with every UK sector at a double-digit P/E discount to its US counterpart.
Schroders sharpens the point at sector level: UK energy sits near 7.1x forward earnings against US energy at roughly 11.1x, a discount of about 36%. These are not modest gaps.
Why the valuation gap is structural, not sentimental
The temptation is to read a 40% discount as mispricing waiting to correct. The evidence points the other way.
The gap is largely a function of composition. The FTSE 100 is heavy in energy, materials, and financials and light in the technology and growth sectors that dominate the S&P 500. That mix mathematically locks in a lower structural growth rate and a persistent discount, regardless of investor sentiment.
The valuation gap they all cite is striking, but it sits on top of a longer structural story: UK equity underperformance relative to MSCI World stretches back to the 2016 Brexit referendum and reflects collapsing domestic ownership and a persistent IPO drought, not merely post-pandemic sentiment.
Long-run data from GMO reinforces this: commodity producers have traded at roughly a 20% discount to the S&P 500 on composite valuation metrics since the 1920s. This is not a recent anomaly waiting to revert. It is a century-old feature of the kind of businesses the UK index contains.
That reframes what the discount means for you. It is context for stock selection, not a signal to buy the index passively and wait for a gap that structural forces are actively holding open. The narrow leadership underlines the point: the FTSE 100 is up roughly 17% over 12 months, but the median UK stock only 8.8%, so index-level strength masks a much narrower reality.
Which is why UBS and others converge on active selection over passive beta, and their criteria are specific:
- Cash-return leaders: FTSE 350 names with forward dividend yields above roughly 3.5%, positive buyback yields, and forward free-cash-flow yields above 5%
- Under-owned small and mid caps: market caps below roughly $10bn with forward EV/EBITDA multiples below 9x, where modest operational gains translate into rapid price moves
- Inflation-resilient cyclicals: energy, materials, and financials with pricing power, plus industrials and healthcare names earning globally despite a UK listing
The opportunity, in other words, sits inside the index, in companies the discount misprices individually, not in the index-level gap itself.
What the UBS call actually means for UK investors deciding now
Strip everything back and the tension is clear. The upgrade is real and the entry point is genuine, but the opportunity is commodity-cycle-dependent, time-sensitive, and subordinate to better-ranked global alternatives in UBS’s own framework.
The scenarios map onto three variables you can actually monitor.
- Brent crude direction: roughly 18% of MSCI UK earnings runs through energy, so the oil price effectively sets the earnings ceiling
- Gilt yield trajectory: with 30-year yields near 5.81%, rising yields erode the income case and pressure valuations directly
- Sterling movement: a weaker pound feeds the optimistic scenario, a stronger pound feeds the pessimistic one
The income story carries a caveat worth naming. The FTSE 100’s dividend yield relative to UK government bonds recently fell to its lowest level in 19 years, so income-focused buyers are getting less of a cushion than the yield alone suggests.
Weigh the asymmetry honestly. UBS’s base case implies roughly 3.6% upside to the December 2026 target of 11,200 and about 6.3% to the June 2027 target of 11,500, against a pessimistic scenario that is 29% below current levels. A modest base-case upside set against a steep downside means the risk-reward is not uniformly compelling at the index level, which argues for disciplined position sizing rather than a blanket buy.
For investors wanting to translate the UK allocation question into a broader portfolio construction decision, our full explainer on UBS’s cash deployment framework covers the three-bucket separation between genuine liquidity needs and deployable capital, with worked examples for common portfolio structures.
A selective opportunity in a structurally constrained market
The dual rating is coherent, not contradictory, and grasping that distinction is itself the edge. “Attractive” says the UK is worth owning; “Least Preferred” says UBS would still rather own something else. Both hold, and the practical response lives in the space between them.
Three live constraints determine whether the base case or something worse arrives: gilt dynamics, commodity-cycle dependency, and narrow market leadership. A 12.4x forward multiple below its median, a 6% free cash-flow yield, and 16% earnings growth moderating to 9% in 2027 all sit inside that frame, not above it. The June 2027 range of 7,700 to 12,300 is the reminder of what is at stake.
The forward posture follows naturally. Active stock selection targeting cash-return leaders and under-owned small and mid caps offers a more defensible UK exposure than passive beta, and that is what the upgrade actually recommends even where the “Attractive” headline does not make it obvious.
Applying the UBS criteria within a portfolio context, rather than buying the index wholesale, is the lens this analysis leaves you with for evaluating UK equity exposure in September 2026.
This article is for informational purposes only and should not be considered financial advice. Investors should conduct their own research and consult with financial professionals before making investment decisions. Past performance does not guarantee future results. Financial projections are subject to market conditions and various risk factors, and the scenarios discussed are speculative and subject to change based on market developments.