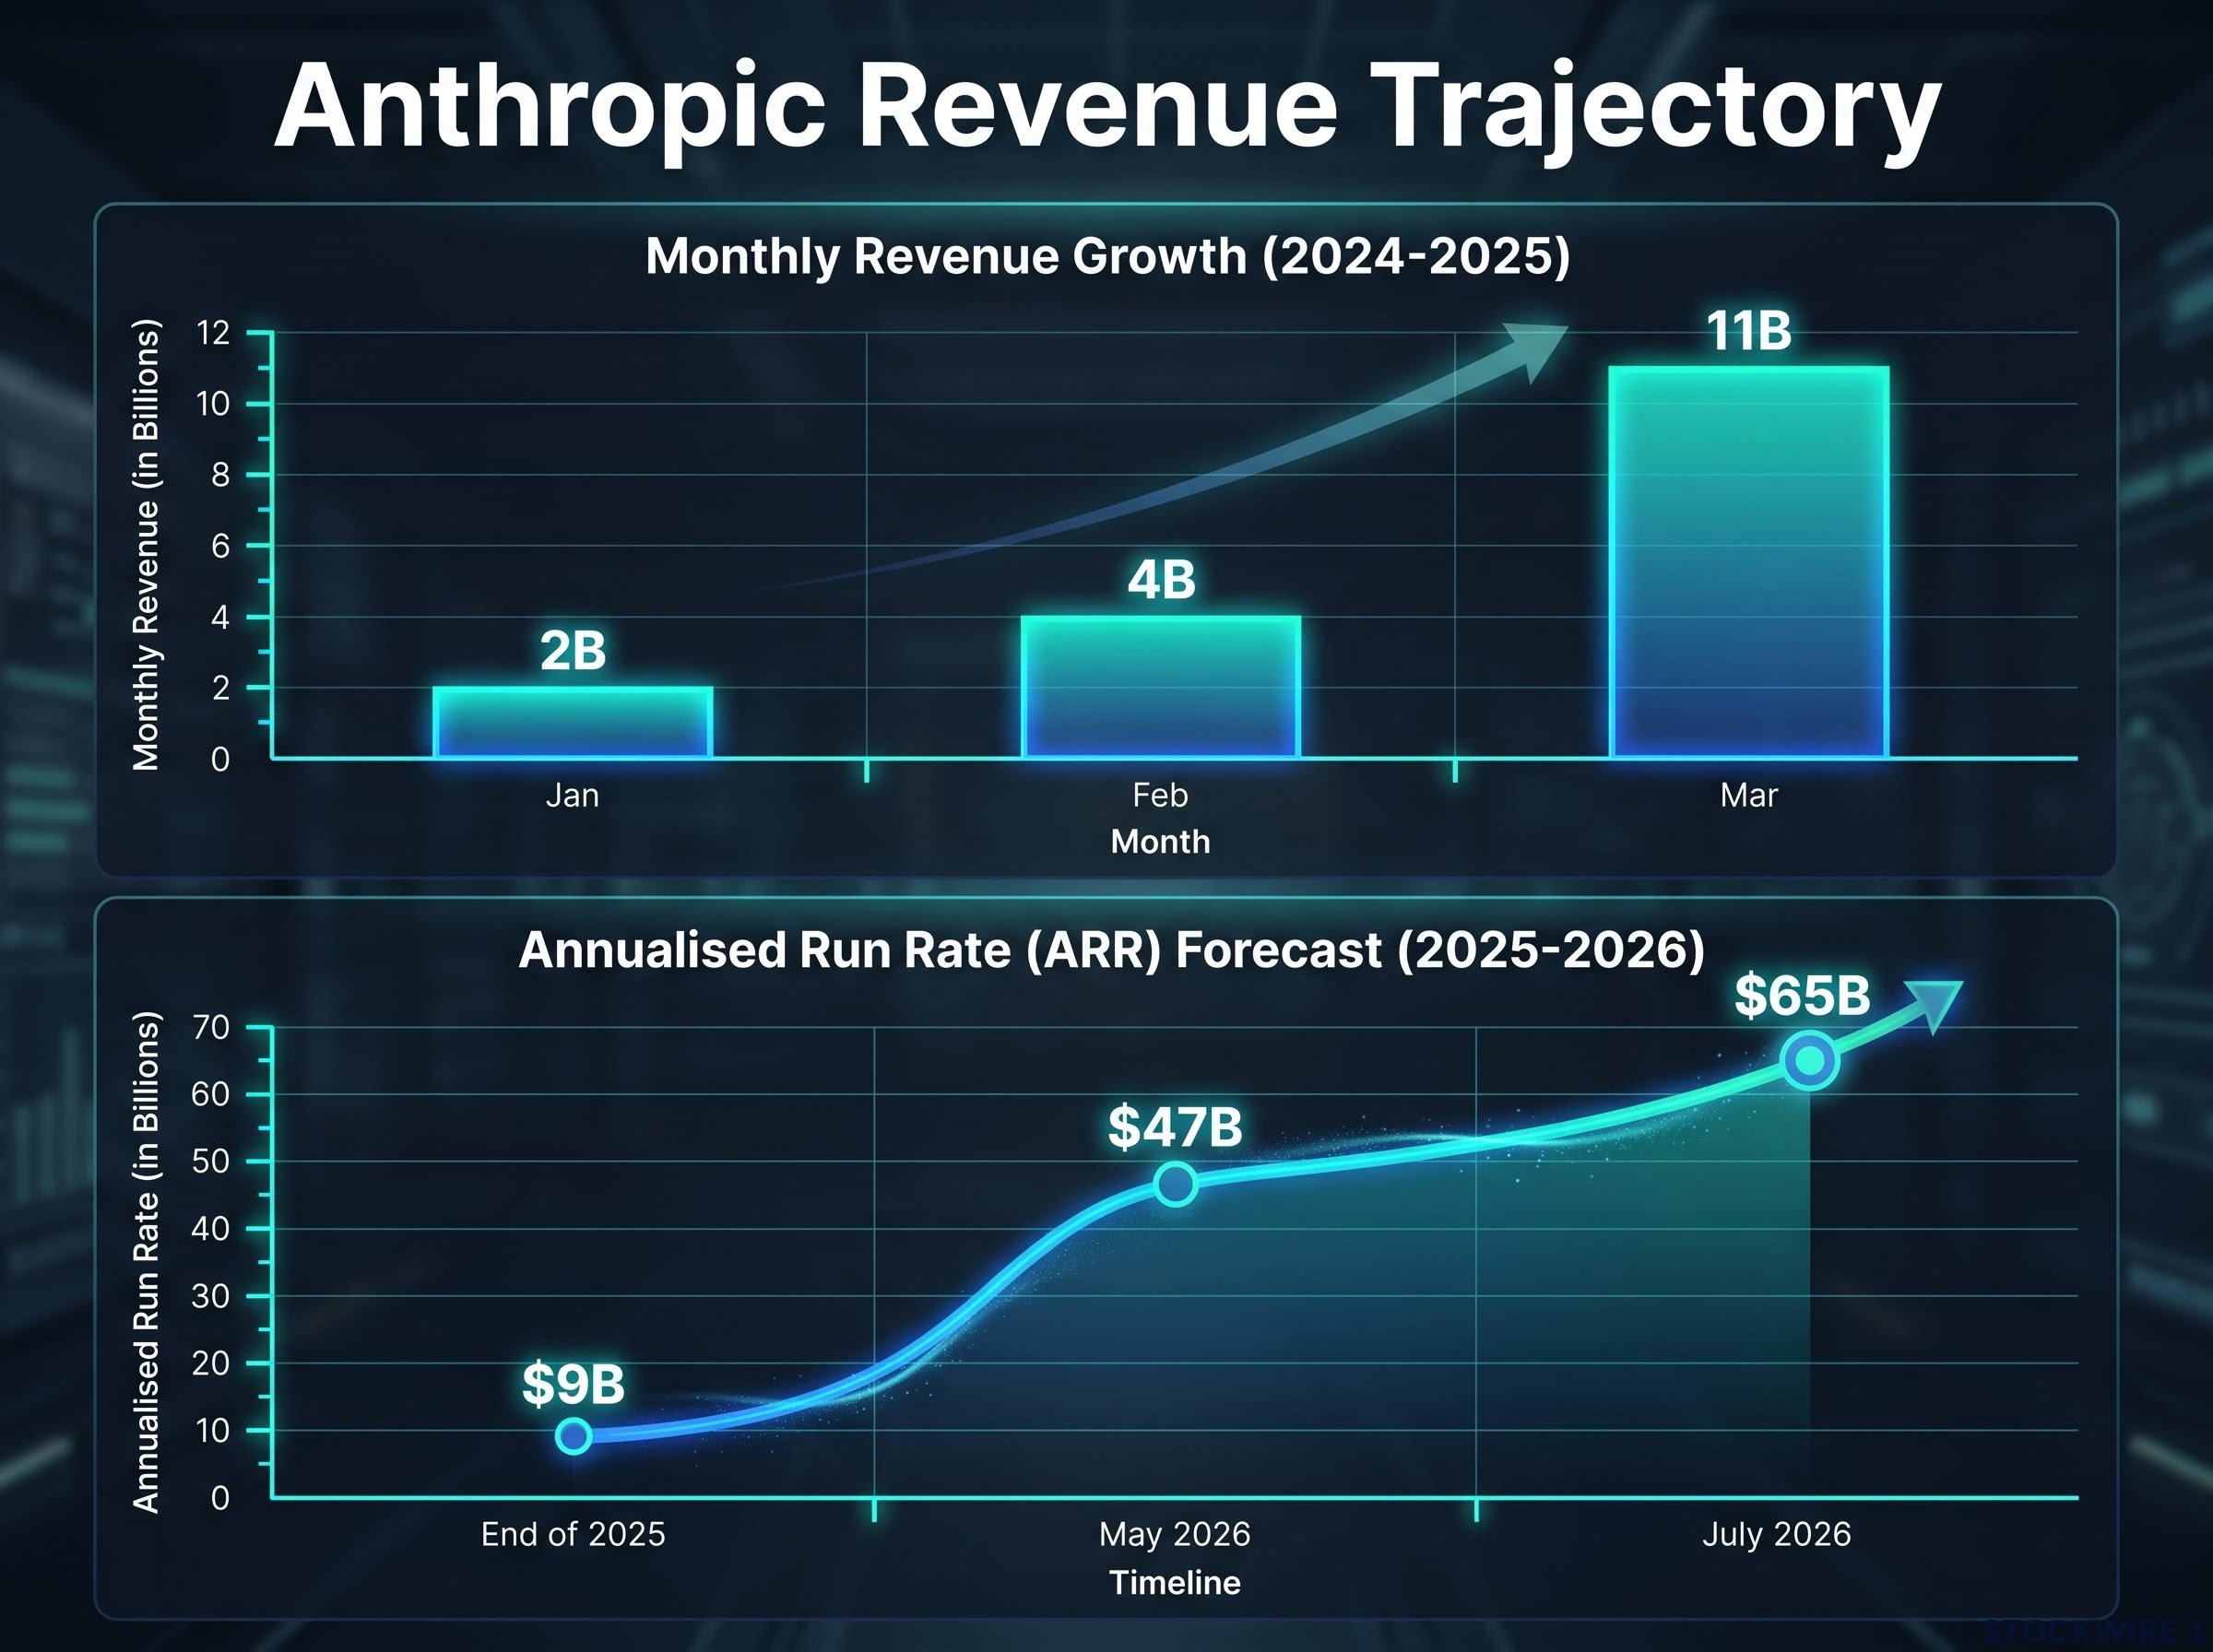
In January of this year, Anthropic’s monthly revenue sat at roughly $2 billion. By February it was $4 billion. By March, $11 billion.
Three months. That parabolic climb is the sequence that changed how the entire market reads the AI trade.
Here is why those monthly disclosures now carry so much weight. The AI infrastructure spending cycle, chip capex, cloud buildout, hyperscaler commitments, has no natural anchor other than the revenue flowing back through the labs themselves. When a lab reports a monthly figure, it is not just reporting its own performance; it is confirming or undermining the economic logic behind trillions of dollars of downstream investment.
The hyperscaler capex cycle provides the structural backdrop for why lab revenue figures carry such weight: Goldman Sachs projects cumulative AI-related spending of $7.6 trillion between 2026 and 2031, and at 94% of operating cash flow consumed by capex in 2026 alone, every dollar of lab revenue disclosed is being measured against an enormous, long-duration infrastructure bet.
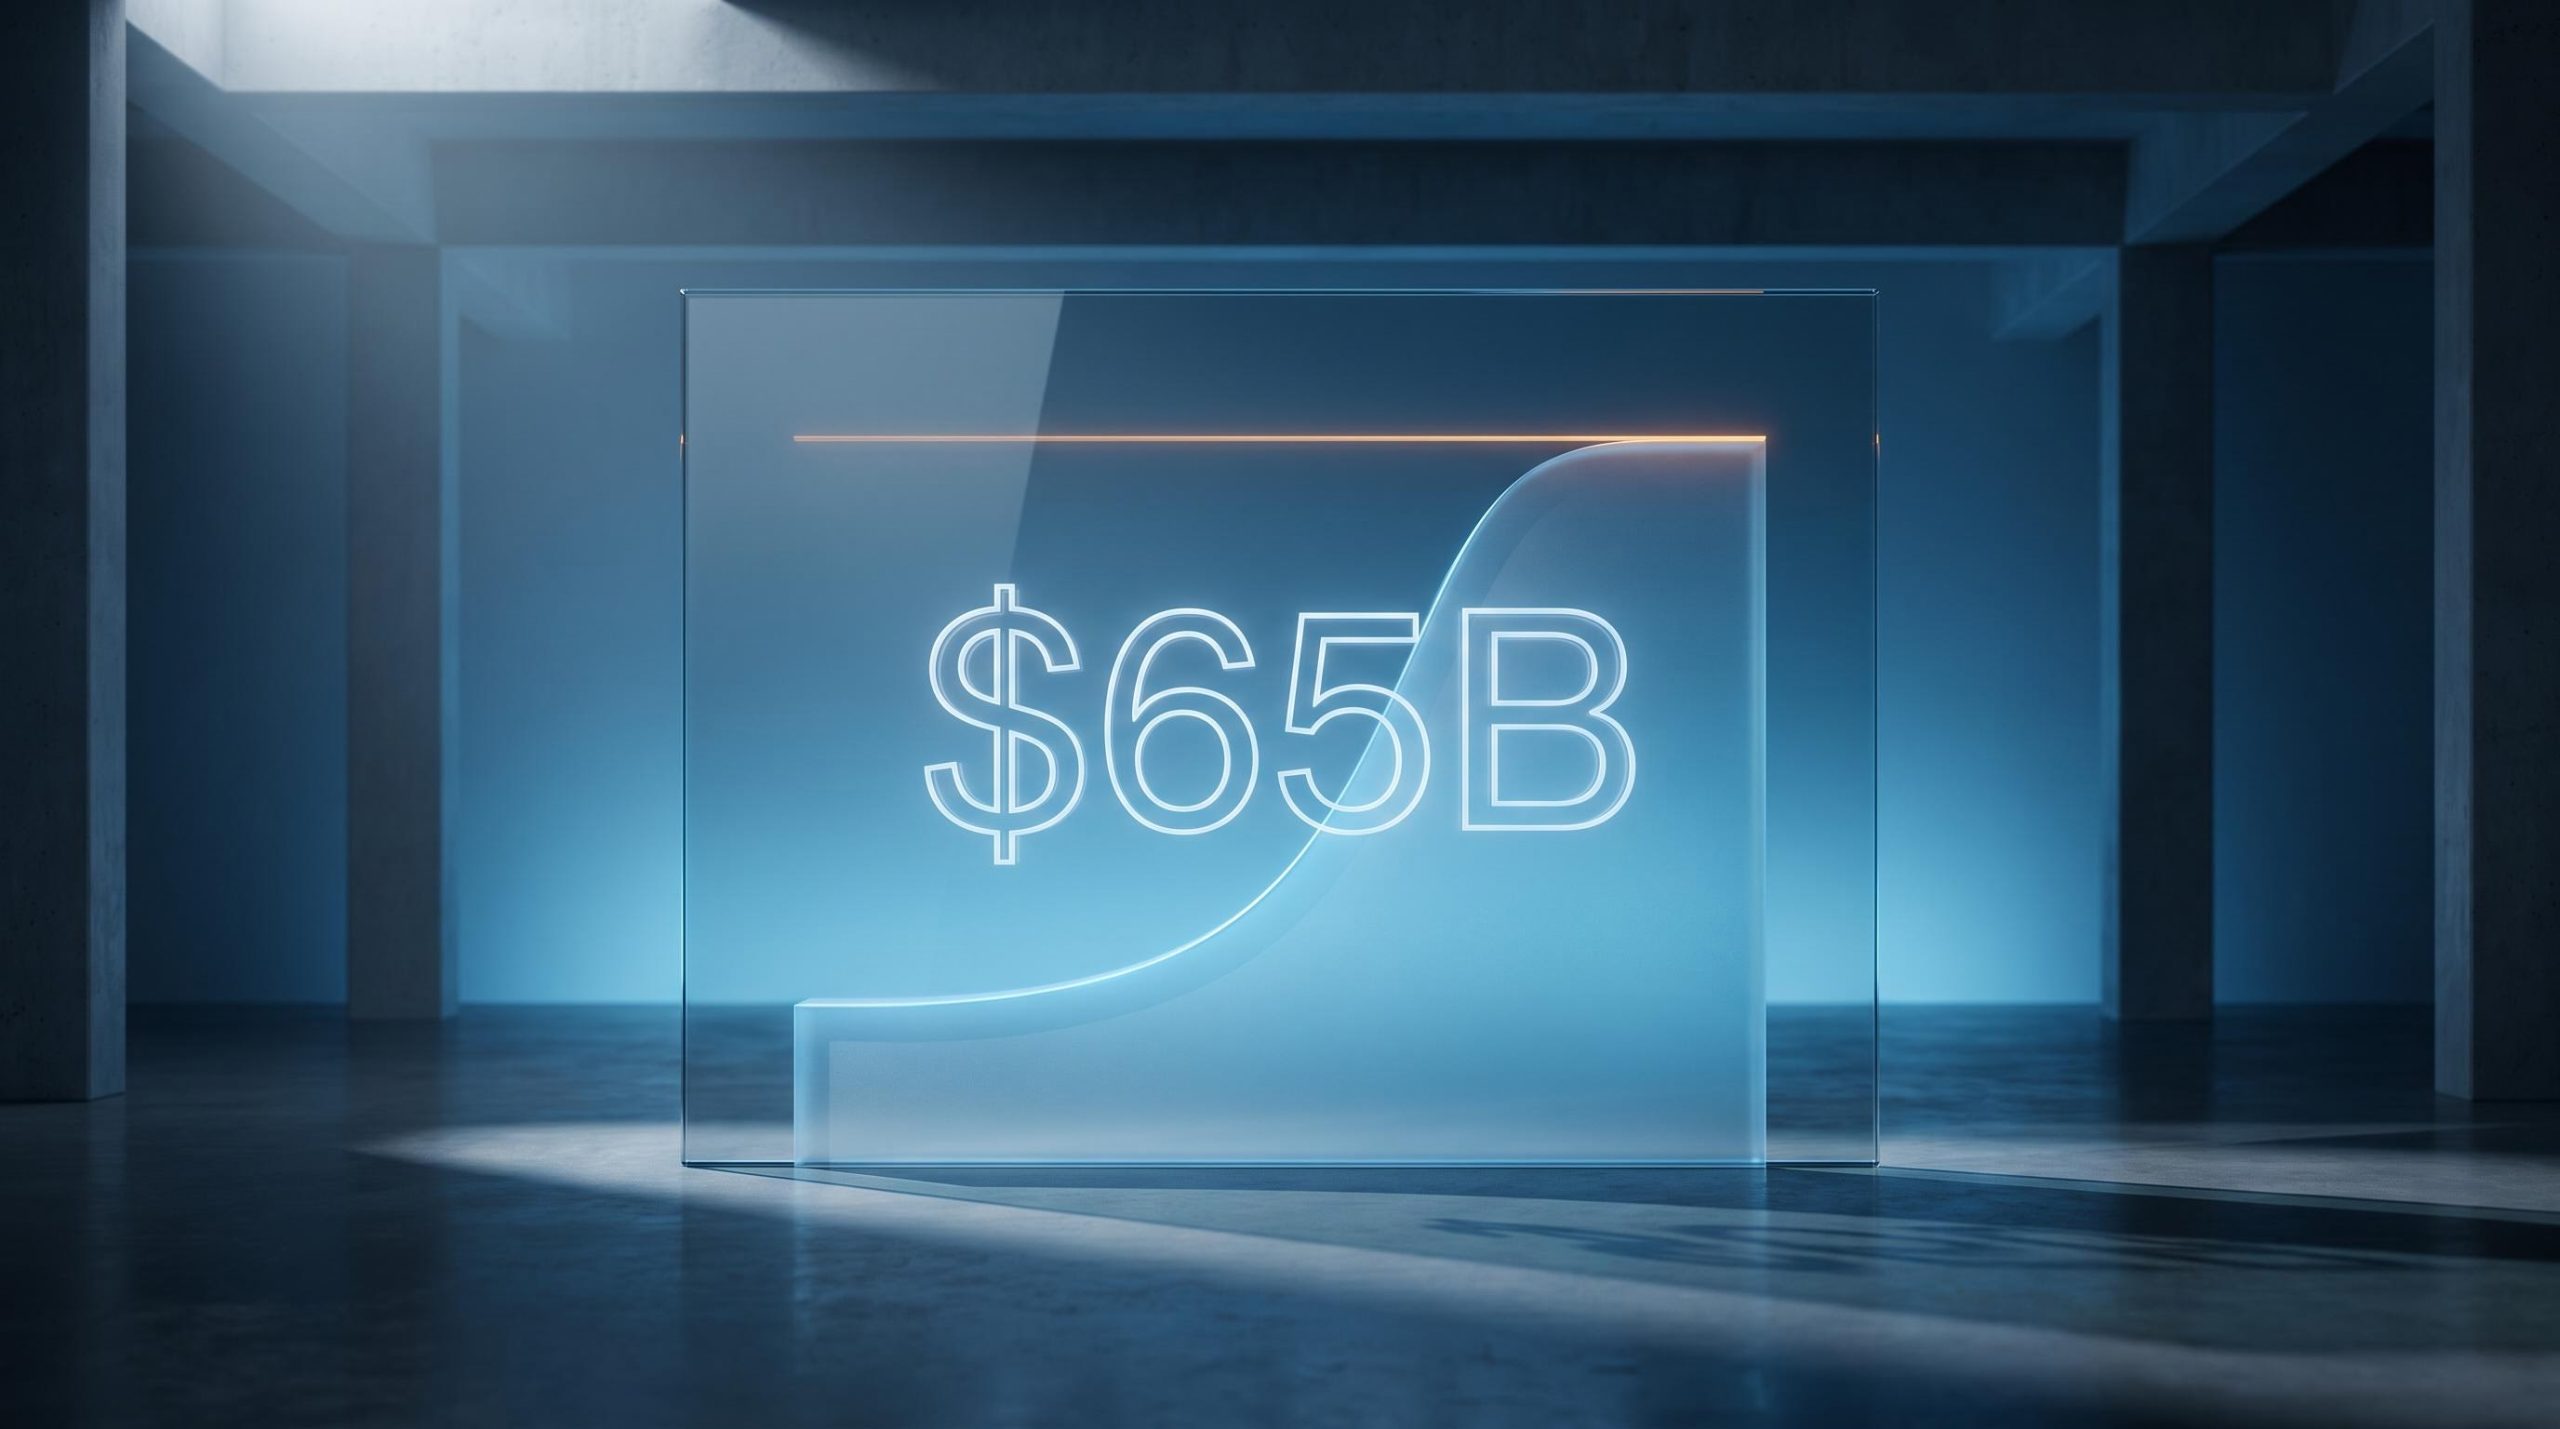
That is why Anthropic’s late-July run rate of $65 billion, measured against the roughly $75 billion some participants had anticipated, was enough to trigger mid-year market consolidation.
After this, you will be able to read the next AI lab revenue disclosure with a concrete framework: the threshold numbers that actually matter, the two interpretive camps analysts fall into, and the portfolio posture that follows from each scenario. This is practical navigation for a market where a single monthly figure can move everything downstream.
From $9 billion to $65 billion: the revenue trajectory that anchored the AI trade
Start at the beginning of the run, because the pace only makes sense as a sequence.
At the end of 2025, Anthropic’s annualised run rate sat at approximately $9 billion, according to reporting from Reuters and Bloomberg. That was already a strong software business by any historical measure. By May 2026, the run rate had reached roughly $47 billion. By the end of July 2026, it stood at approximately $65 billion.
The monthly figures explain the jumps. The move from $2 billion in January to $4 billion in February to $11 billion in March is the granular texture behind those run-rate leaps. Quarterly revenue tells the same story: approximately $4.8 billion in Q1 2026, rising to more than $11.5 billion in Q2 2026.
To calibrate just how far outside normal this sits, consider the historical benchmark. Reaching $1 billion in software revenue over four to five years has historically placed a company in the top 5% of software businesses. Anthropic moved from $9 billion to $65 billion annualised in roughly one year.
Anthropic’s chief executive Dario Amodei captured the strain of that pace directly.
After crossing $47 billion in annualised revenue in May 2026, Amodei described the company’s growth as “too hard to handle,” a phrase reported by Bloomberg and summarised by StartupHub.ai.
OpenAI’s parallel trajectory
This is not a single-company story. OpenAI’s numbers confirm the pattern across the sector.
At the end of February 2026, OpenAI’s annualised revenue run rate stood at approximately $25 billion, according to Reuters citing The Information. It then plateaued near that level through spring, a detail worth holding onto, before breaking out to roughly $40 billion by July-August 2026, based on leaked audited financials reported by Sacra and ValueAddVC.
The quarterly step-up matched the run-rate move: $5.7 billion in Q1 2026, then $6.7 billion in Q2 2026.
| Company | Period | Annualised Run Rate | Quarterly Revenue |
|---|---|---|---|
| Anthropic | End of 2025 | $9B | – |
| Anthropic | May 2026 | $47B | $4.8B (Q1) |
| Anthropic | July 2026 | $65B | >$11.5B (Q2) |
| OpenAI | February 2026 | $25B | $5.7B (Q1) |
| OpenAI | July-August 2026 | $40B | $6.7B (Q2) |
Combine the two, and the pair carry an annualised run rate of roughly $105 billion as of late summer 2026. Here is what that figure means for you as an investor: $105 billion is not a milestone the market celebrates and moves past. It is the new floor from which every future projection now extrapolates.
That reframes any deceleration. From a base this high, a slowdown will not be read as a business maturing naturally. It will be read as a structural problem. Anchor only to the current run rate without the trajectory behind it, and you will misjudge whether the next disclosure represents acceleration or a stall.
When big ASX news breaks, our subscribers know first
What “good” looks like: the $180 billion threshold and the $8 billion inflection point
If the trajectory sets the base, the next question is what number turns a disclosure into confirmation rather than a warning.
Brad Gerstner of Altimeter Capital has named the benchmark explicitly. The top three AI labs need to collectively reach at least $180 billion in annualised revenue by year-end to sustain the AI investment thesis. From the July baseline, that implies roughly $80 billion in additional growth is required across the leading labs in a matter of months.
The more actionable metric sits one level down. The scenario where individual lab monthly revenue approaches $8 billion per lab has been characterised as a potential “takeoff” threshold for the broader AI market. This is the figure to monitor, because per-lab monthly revenue reacts faster and more cleanly than aggregate annual totals, giving you a real-time read rather than a lagging one.
The gap between where the labs are and where the thesis needs them to be is closable, but only just. Anthropic’s investors expect the company to finish 2026 between $100 billion and $120 billion in annualised run rate, according to the Financial Times as reported by TechCrunch. Hit the upper end, and Anthropic alone contributes well over half of the collective target, leaving OpenAI and any third lab to close the remainder.
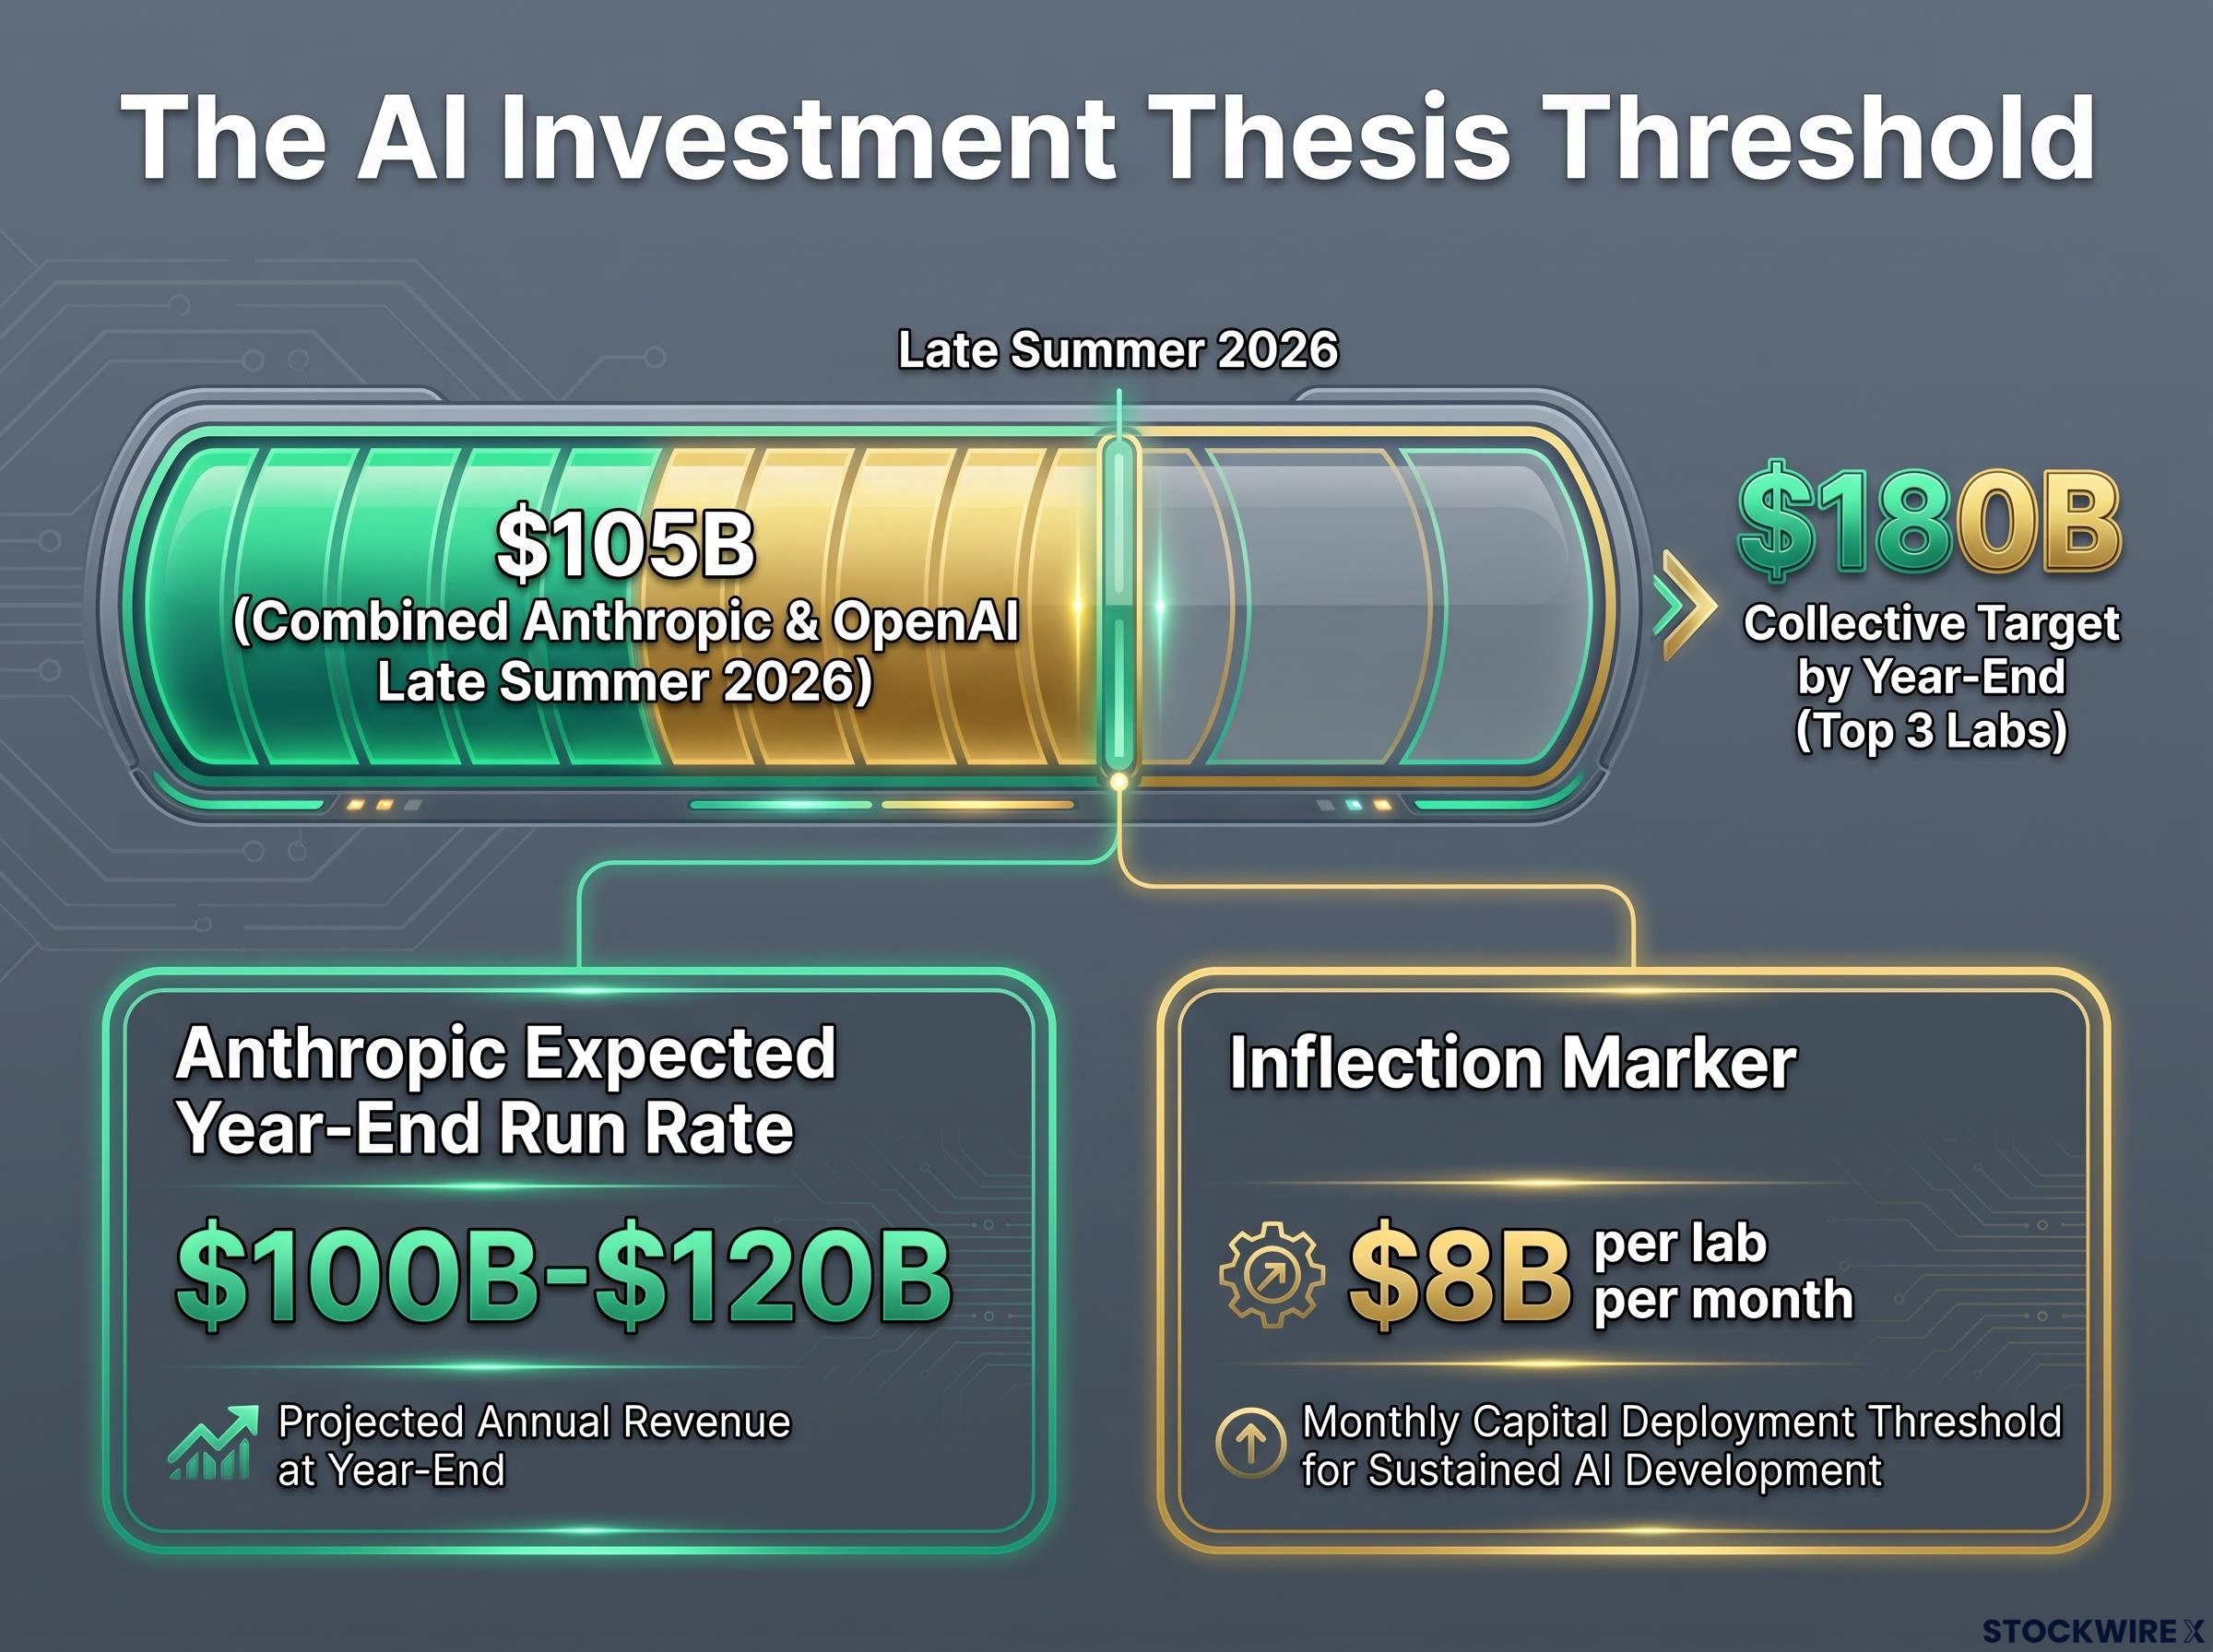
Here are the three numbers that define the test:
- $180 billion collective annualised revenue for the top three labs by year-end (the thesis-sustaining threshold)
- $8 billion per lab per month (the “takeoff” inflection marker to watch in each disclosure)
- $100-120 billion Anthropic’s investor-expected year-end run rate
For scale, an upper-bound scenario referenced in the research points to a $200 billion annualised exit rate for Anthropic, though that sits above consensus and should be treated as a ceiling, not a base case. OpenAI’s own longer-term ambition is a roughly $600 billion revenue target by 2030, useful only as a reminder of how large these companies expect to become.
The equity backdrop against which these thresholds are being set matters too: the NASDAQ is up approximately 12% year-to-date. For you, the practical takeaway is that the next monthly disclosure now has a specific pass mark. When per-lab monthly revenue tracks toward $8 billion, the thesis is confirming. When it lags, the timeline, not necessarily the thesis, is in question.
Why AI revenue gaps move markets: the two interpretive camps
The mid-year consolidation had a specific trigger. Anthropic’s $65 billion disclosed run rate landed below the roughly $75 billion some market participants had built into their estimates. Add concerns that open-source AI models are catching up to proprietary ones, and investors revised revenue expectations downward, sending markets sideways.
How you read that gap determines your entire posture. Analysts split into two camps, and each is anchored to real data.
The AI monetisation gap sits at the centre of every valuation debate: hyperscalers collectively projected to spend $635-$725 billion on AI infrastructure in 2026 while current AI monetisation is estimated at only $50-$150 billion, a discrepancy that directly triggered the July semiconductor selloff and framed the summer consolidation period.
The structural-friction camp reads shortfalls as evidence of a monetisation problem. Their strongest number comes from ValueAddVC: OpenAI’s 2025 operating loss of approximately $20.9 billion exceeded its $13.07 billion in revenue for the year. They point to the monetisation ratio, low revenue per user against enormous free usage, and to pricing pressure from competitive and open-source models as reasons the gap between adoption and profit stays wide.
OpenAI counts roughly 900 million weekly active ChatGPT users against approximately $2 billion in monthly revenue, a ratio the structural-friction camp cites as evidence that converting mass adoption into high-margin revenue remains genuinely difficult.
The timing-and-measurement camp reads the same gaps as snapshots, not verdicts. Their evidence is OpenAI’s own recent history: the ARR plateau near $25 billion through spring, followed by a clean break to $40 billion in July as enterprise sales connected. Stalls, in this reading, precede inflections rather than signal failure. They point to Anthropic’s investors explicitly expecting continuation to $100-120 billion by year-end as further confirmation the curve is lumpy but intact.
| Structural Friction Camp | Timing and Measurement Camp |
|---|---|
| OpenAI’s 2025 operating loss of ~$20.9B exceeded its $13.07B revenue | OpenAI’s ARR plateaued near $25B through spring, then broke out to $40B in July |
| 900M weekly ChatGPT users against ~$2B monthly revenue signals low monetisation per user | Anthropic investors explicitly expect $100-120B annualised by year-end |
| Pricing pressure from open-source and competitive models | Stalls reflect contract timing and product cycles, not structural limits |
| $852B OpenAI valuation against ~$24B ARR (March 2026) risks multiple compression | Anthropic Q2 revenue exceeded $11.5B, evidence the commercialisation curve is intact |
The competitive dimension sits underneath both readings. Anthropic’s Q2 revenue of more than $11.5 billion against OpenAI’s $6.7 billion shows the two are not moving in lockstep, and relative positioning is already shifting.
Here is what the $20.9 billion operating loss actually tells you. Even at $40 billion annualised revenue, OpenAI’s cost structure means profitability remains a future condition, not a present one. Sustained revenue growth is the only path that validates a $852 billion valuation. That is why the camp you land in is not academic: it dictates whether you treat the next shortfall as a buying opportunity or a warning.
The risks that complicate the revenue story in H2 2026
The risks that matter are not standalone. They compound, and it is the specific combination that would break the thesis.
Start with the central tension. When capex and operating losses scale ahead of revenue, even a fast-growing lab hits a structural window where cash burn outpaces commercialisation. OpenAI’s $20.9 billion operating loss on $13.07 billion of 2025 revenue is the benchmark case. The danger is not that revenue stops; it is that investors withdraw patience before the inflection arrives.
Operational scaling compounds that. Amodei’s “too hard to handle” comment at $47 billion annualised is a concrete signal that the bottlenecks at $65 billion and beyond are internal as well as market-facing: support, safety oversight, infrastructure reliability, and enterprise account management all strain at this pace.
Here are the lab-specific and market-wide risks in order of proximity to the revenue thesis:
- Infrastructure spending gap: operating losses and capex scaling ahead of revenue, with OpenAI’s $20.9B 2025 loss as the reference point.
- Operational scaling: growth “too hard to handle” at $47B suggests internal bottlenecks at higher run rates.
- Valuation multiple compression: OpenAI’s $852B valuation against ~$24B March ARR compresses sharply if growth decelerates.
- Competitive lab dynamics: Anthropic’s >$11.5B Q2 against OpenAI’s $6.7B shows relative positioning is already in play.
- Open-source pressure: cheaper open models catching up to proprietary ones, a named factor in mid-year consolidation.
- Macro rate environment: external variables that compress AI-trade multiples regardless of lab fundamentals.
Open-source commoditisation pressure has repeatedly closed the benchmark gap to prior-generation frontier models within 6-12 months of release, structurally compressing the pricing window that underpins high-margin API revenue, and Oracle’s $300 billion OpenAI contract sits directly in the path of that dynamic.
Macro variables beyond lab control
The final risk sits entirely outside the labs. Oil prices influence the direction of interest rates, and rate direction shapes equity multiples across the AI trade. Even if every lab delivers on revenue, a tightening rate environment driven by commodity pressure could compress valuations across the sector.
For a US equity investor, the risk that matters most is not that AI revenue stops growing. It is that revenue grows at a rate insufficient to justify the multiples already priced in. Infrastructure losses, operational friction, and macro rate pressure can each independently widen that gap. Treat revenue growth as necessary but not sufficient, and keep the external variables on the same watchlist as the internal ones.
How to position when AI revenue is the market’s most critical variable
The simple bet is over. From 2023 to 2025, a concentrated position on AI as a super cycle was enough, because the whole sector re-rated together. That trade has done its work; AI is now broadly priced into markets, and outcomes from here depend on specific facts, not a single directional thesis. That framing comes directly from Gerstner and Altimeter Capital.
What replaces conviction is a monitoring mechanism. Two variables carry most of the signal:
- Monthly AI lab revenues: the single most important near-term indicator, with $8 billion per lab per month as the specific trigger that separates a thesis-confirming disclosure from one that questions the timeline.
- Oil prices: the rate-direction signal, and the channel through which the AI trade can be disrupted even if lab revenue delivers.
The posture that follows is moderate exposure with genuine flexibility. Hold enough to capture upside if the collective $180 billion threshold comes into reach by year-end, but keep the positional and mental room to reduce if mid-year-style shortfalls recur.
Both outcomes remain live. The NASDAQ is up approximately 12% year-to-date, and both upside and downside scenarios are credible through year-end. That is precisely why a fact-based update mechanism beats a fixed conviction: the monthly revenue calendar is the most reliable input that mechanism has, and it now tells you more about the market’s direction than almost any other single number.
For investors wanting to map their existing portfolio against the spend-versus-profit divide before the next disclosure, our full explainer on AI capex versus monetisation walks through exactly which side of the capex-to-revenue gap each portfolio position sits on, including the passive index concentration most holders have not yet quantified.
This article is for informational purposes only and should not be considered financial advice. Investors should conduct their own research and consult with financial professionals before making investment decisions.
Past performance does not guarantee future results. Financial projections are subject to market conditions and various risk factors. Run-rate figures cited are projections, not audited full-year results, and are subject to change based on market developments and company performance.