The most aggressive forecast on Wall Street’s desk says the United States will add roughly 43 GW of AI compute capacity in 2027. To put that number in perspective, it would mean doubling every gigawatt of compute the country has ever installed, in a single twelve-month window.
The problem is not the ambition. The problem is that the physical infrastructure required to make it real, the transmission lines, the transformers, the interconnection approvals, is already running years behind schedule.
That gap matters right now, in September 2026, because hyperscaler capital is moving faster than the grid can absorb it. Combined capex across the four largest cloud operators is guided at roughly $730 billion for 2026 and is approaching $1 trillion for 2027. Capital is accelerating; the grid, the permitting queue, and the equipment supply chain are not.
If you hold exposure to AI-levered semiconductor names, infrastructure REITs, or the hyperscalers themselves, the supply-side constraint is not a distant risk. It is already visible in interconnection queue data today. What follows is a framework for judging which constraints will actually shape 2027 deployment, and what a serious shortfall would do to the equities priced for the bullish case.
The 43 GW projection is the baseline. Now interrogate it.
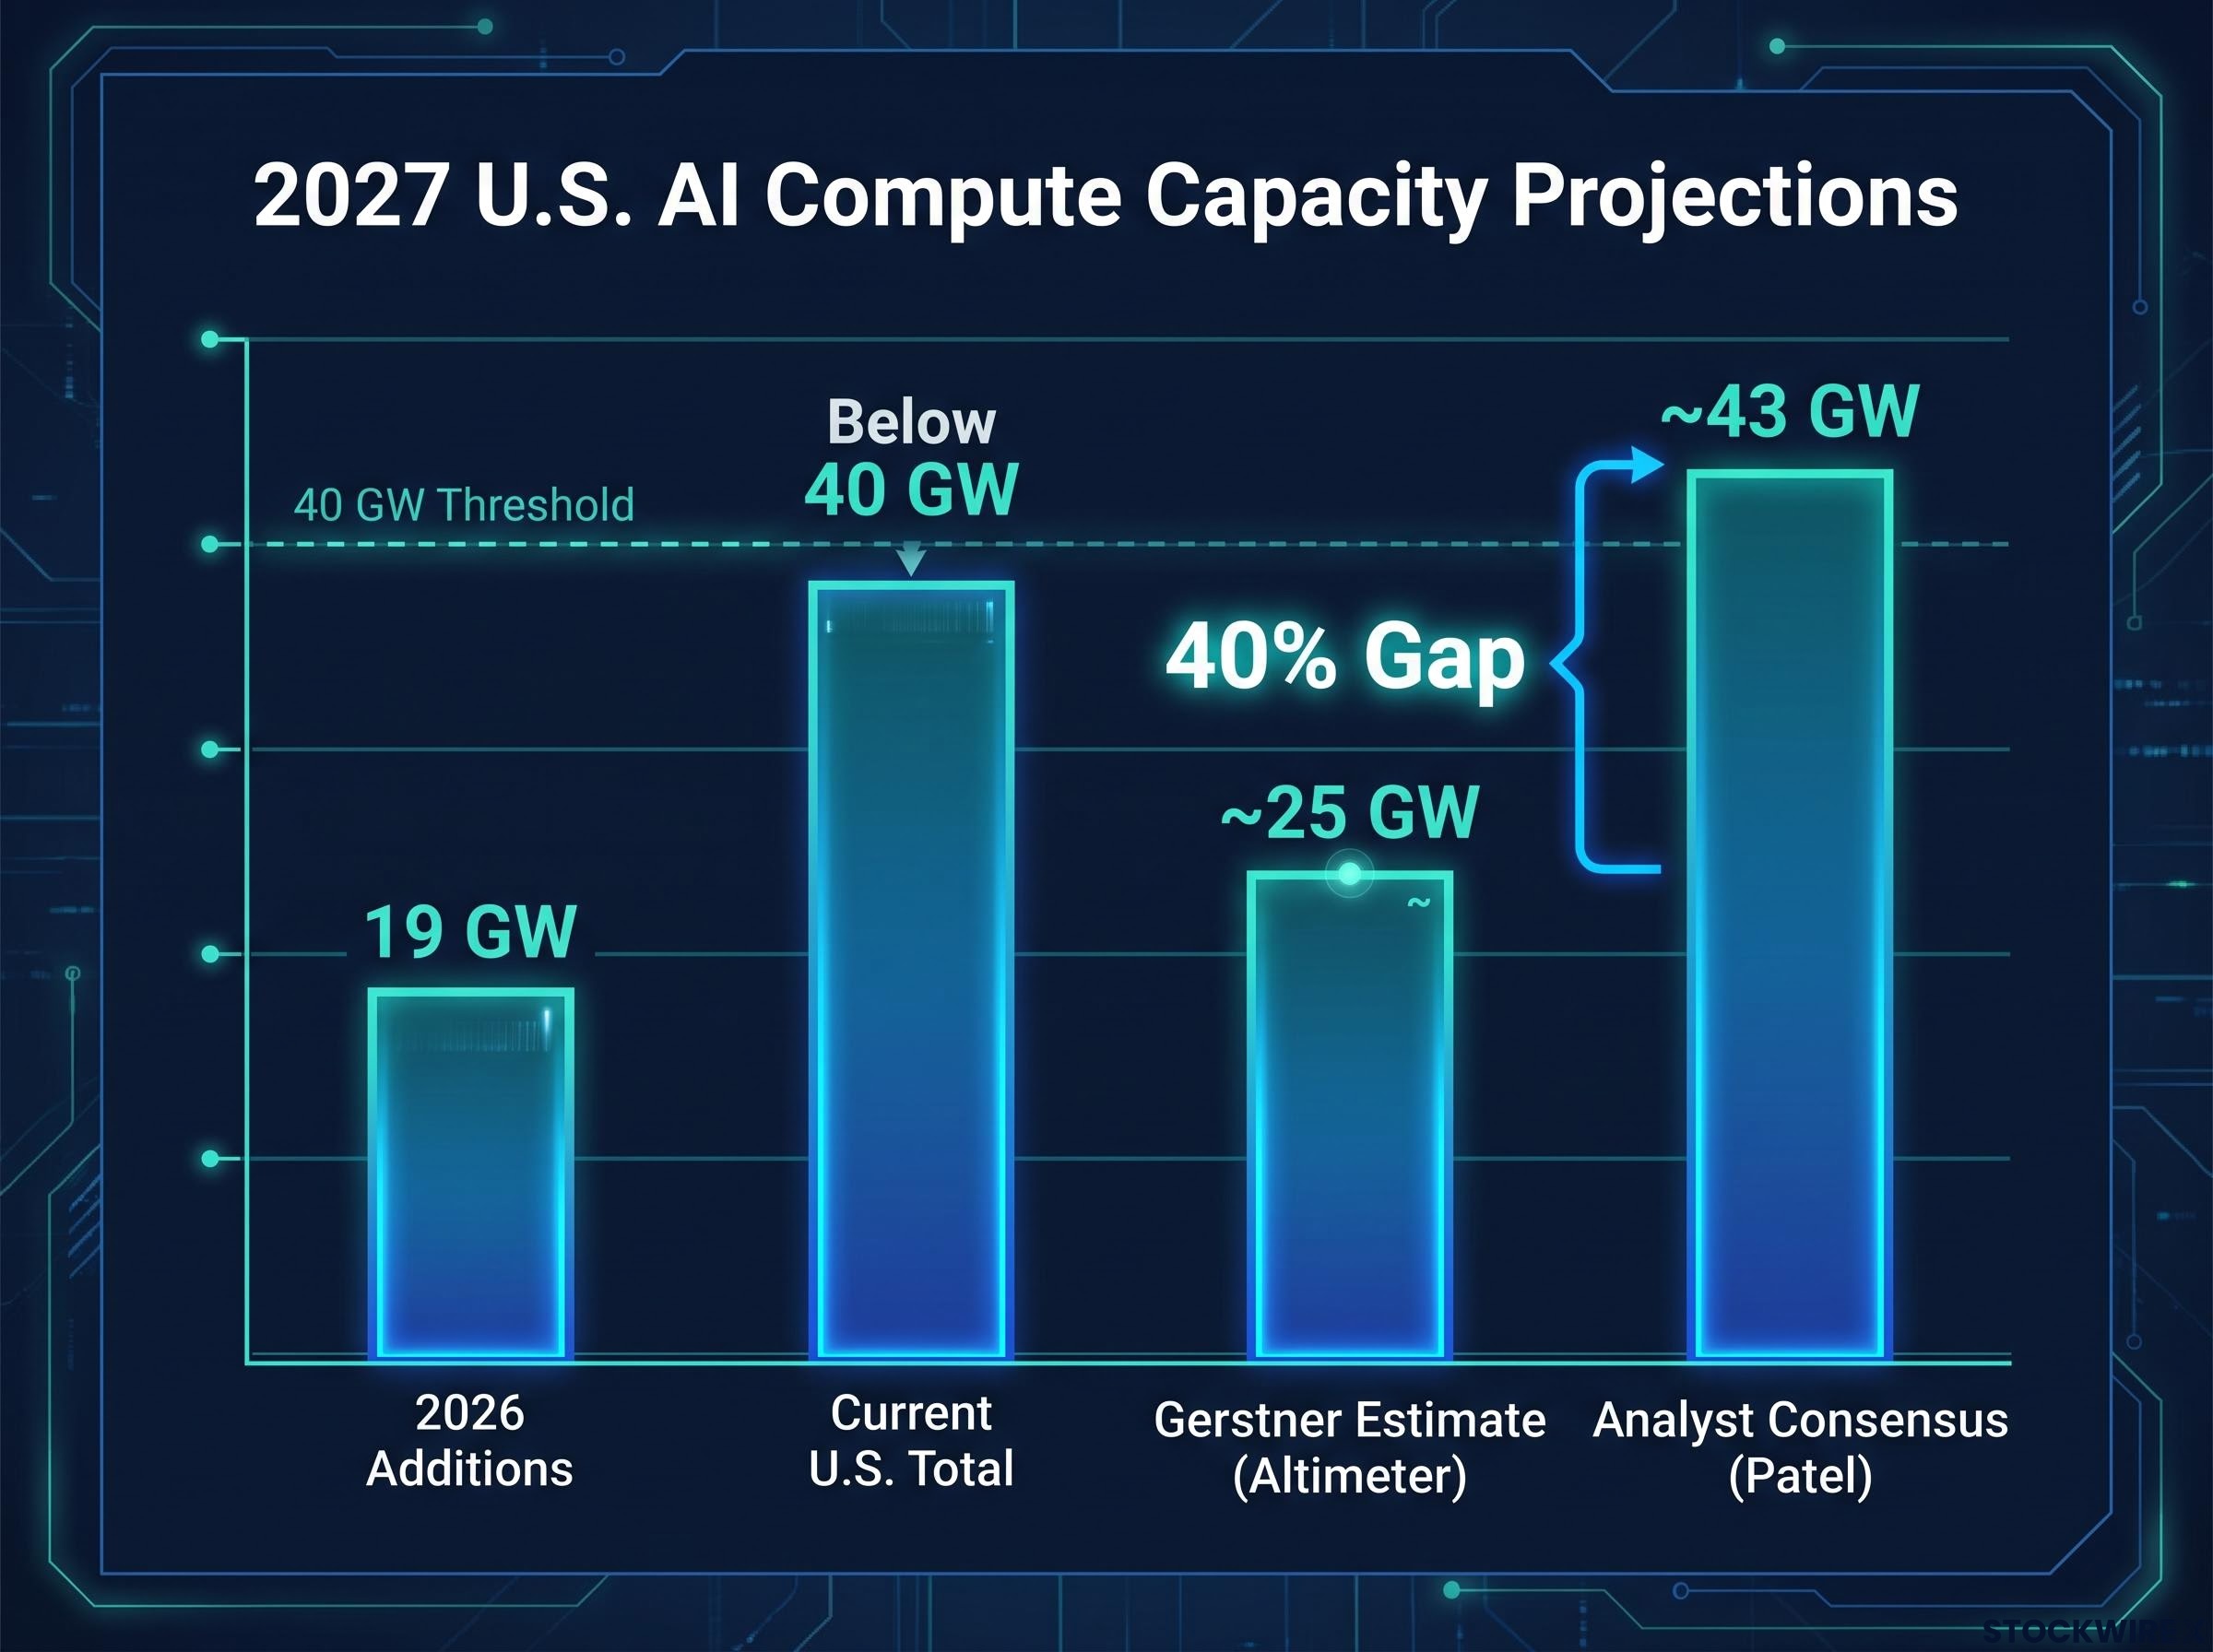
Start with the number everyone is anchored to. Dylan Patel of Semi Analysis projects around 43 GW of new compute capacity coming online in 2027. Total current U.S. compute capacity sits below 40 GW, according to Altimeter Capital. So the consensus forecast implies the country installs more compute in one year than it has accumulated across its entire history to date.
For context, 2026 additions landed at approximately 19 GW. The 2027 projection therefore asks the physical system to more than double its annual pace, on top of a base it took years to build.
Not everyone inside the investment ecosystem buys it. Brad Gerstner of Altimeter Capital, someone with direct capital at stake rather than an outside sceptic, puts his own estimate materially lower.
The counter-estimate Gerstner projects actual deployable compute in 2027 will be closer to 25 GW, roughly 40% below the analyst consensus, with about half of that capacity flowing to Anthropic and OpenAI.
That 40% gap is the central quantitative risk this piece is built around. It is not a forecasting quibble. A shortfall of that size directly compresses the revenue timelines baked into current valuations for GPU designers, infrastructure REITs, and every hyperscaler capex beneficiary.
Consider the scale of what each gigawatt represents. Anthropic currently generates its reported revenue on roughly 1.5 GW of compute. Altimeter estimates that adding 4-5 GW could theoretically support around $100 billion in incremental revenue. When the marginal gigawatt carries that kind of monetisation weight, an 18 GW deployment miss stops being an abstraction and starts rewriting growth curves.
Agentic AI workload demand adds a structural acceleration layer that the 43 GW 2027 projection does not fully capture; Citi’s September 2026 revised model, which more than tripled its 2031 global data centre load forecast to 370 GW, attributes much of that upward revision to agentic workloads consuming 20-30 times more compute per user than traditional generative AI applications.
| Scenario | 2027 Compute Additions (GW) | Relationship to Current U.S. Total |
|---|---|---|
| Analyst consensus (Patel / Semi Analysis) | ~43 GW | Roughly equal to entire current U.S. capacity |
| Gerstner estimate (Altimeter Capital) | ~25 GW | Roughly 63% of current U.S. capacity |
| Current U.S. total capacity (baseline) | Below 40 GW | Baseline |
The read here is simple. Before evaluating any single AI position, you need to know this range exists and what it is anchored to. The bull case and the bear case are already 40% apart, and the difference is physical, not financial.
When big ASX news breaks, our subscribers know first
Inside the grid bottleneck: why interconnection queues are a structural problem, not a backlog
The first place that gap shows up is the interconnection queue, and the numbers are difficult to overstate. Lawrence Berkeley National Laboratory’s end-2025 dataset counts 2,061 GW of generation and storage capacity actively waiting to connect to the grid, spread across nearly 40,000 interconnection requests.
AI energy demand is not growing linearly alongside general data centre expansion; AI accelerator racks draw three to five times more power per rack than traditional cloud workloads, which is why the interconnection queue pressure is concentrated in specific high-density corridors rather than spread evenly across the national grid.
By August 2026, a Carbon Direct white paper focused on PJM and ERCOT put the national figure above 2.2 TW, nearly twice the capacity of every power plant currently installed in the United States. That is not a backlog. That is a queue larger than the entire grid it is trying to join.
Now layer in the wait. FERC, the Federal Energy Regulatory Commission that oversees interstate transmission, targets an 8-11 month interconnection timeline. The actual national average is roughly 25 months. In PJM, the grid operator covering much of the eastern United States, the average stretches to around 40 months.
For projects in the data-center load-growth zones of PJM and ERCOT, the reality is worse still: 36-48 months, three to four years, just to reach an interconnection agreement.
ERCOT, the Texas grid operator, tells the same story from a different angle. The Interconnection.fyi tracker, updated 26 August 2026, shows large-load customers, a category that includes data centers, facing average waits of roughly 4.2 years, with about 238,600 MW of large-load capacity queued.
Here is what that means for you as an investor. If you hold a data center REIT or a hyperscaler with capacity committed in PJM or ERCOT, a 36-48 month interconnection timeline means infrastructure announced today will not generate revenue-supporting compute until 2029 at the earliest. That should shift how you read any near-term earnings projection tied to those sites.
| Region | FERC Target Wait | Actual Average Wait | Data-Center-Zone Wait |
|---|---|---|---|
| National average | 8-11 months | ~25 months | 36-48 months |
| ERCOT | 8-11 months | ~20 months | ~4.2 years (large-load) |
| PJM | 8-11 months | ~40 months | 36-48 months |
The gap between committed demand and raw queue makes the point at the utility level. American Electric Power holds firm commitments for 24 GW of new demand by 2030, including 18 GW from data centers, against roughly 190 GW sitting in its raw interconnection queue. Most of what is queued will never be built.
Three structural causes that outlast any reform order
The delays are not a processing hiccup that a faster clerk could fix. Carbon Direct and LBNL research point to three structural causes that reform orders alone will not resolve.
- Chronic underinvestment in high-voltage transmission into the fast-growing regions where data centers actually want to build, meaning the wires simply are not there.
- Cost-allocation rules that assign upgrade costs to individual projects, which rewards speculative queue entries and invites litigation that clogs the process further.
- Legacy first-come, first-served study processes designed for a far smaller project set and now overwhelmed by tens of thousands of requests.
The read for investors is that these causes are baked into how the grid was designed, not into any single year’s paperwork. Optimists see FERC reform pulling timelines toward one to two years by the late 2020s. More cautious analysts argue backlog normalisation waits until the early-to-mid 2030s in the high-growth corridors that matter most for AI.
The bottleneck stack: power, permits, equipment, and labor are failing simultaneously
Grid interconnection is only the most measurable layer. Underneath it sits a stack of constraints, and each one carries its own multi-year clock. The risk is that they are not independent problems to be solved in sequence; they are failing at the same time.
Ranked by how well the evidence documents them, the stack looks like this:
- Grid interconnection (the most documented layer, with the queue and wait-time data above).
- Permitting delays and community opposition, where timelines are real but not publicly quantified.
- Power equipment supply, where transformers and switchgear are reported sold out, with no public supply data available.
- Skilled labor scarcity, identified by Altimeter Capital as a genuine constraint but not measured in any available research.
The honest picture includes those gaps. Permitting timelines, equipment lead times, and labor shortages are cited by credible sources but not attached to hard numbers. That absence is itself part of the risk: you cannot price what nobody is measuring.
Now add the pressure multiplier. Combined hyperscaler capex ran to roughly $410-427 billion in 2025 across ValueAdd VC, Morgan Stanley, and RBC estimates, is guided near $730 billion for 2026, and consensus points to around $934.5 billion for 2027, per IO Fund, with Morgan Stanley’s top-five forecast reaching approximately $1.2 trillion. Capital is scaling. The physical systems that must absorb it are not.
Demand is climbing to meet that spend. S&P Global’s 451 Research found data center grid power demand rose roughly 22% in 2025.
The demand curve 451 Research projects data center grid power demand will nearly triple by 2030, implying a wave of new generation and transmission that the queue data suggests the grid cannot deliver on schedule.
Morgan Stanley’s July 2026 work flagged GPU and ASIC supply allocation as a key capex driver, which implies compute comes online more slowly than the capital pace suggests. Altimeter also notes a financing overhang: a 10-year Treasury yield at 5.5% would be a meaningful burden on equity valuations across the board.
Here is the interpretive core. When each layer of the stack carries its own independent multi-year resolution timeline, the odds that all four clear simultaneously in time for a 43 GW 2027 deployment are low. Capex measures intent. The stack measures delivery. The distance between them is exactly where your investment risk lives, and it means the AI buildout is not a single-variable story about chip supply.
The regulatory wildcard: what the nuclear precedent tells AI infrastructure investors
There is one more layer, and it is the one most investors wave away. Regulatory and community opposition rarely bans large infrastructure outright. It delays, reshapes, and occasionally kills projects that looked unstoppable, and the historical record is not kind to the assumption that it cannot happen here.
Altimeter Capital points to a specific precedent: activist-driven opposition contributed to the shutdown of 67 nuclear fission reactors in the United States. Nuclear was technically viable, federally supported, and economically compelling, and organised opposition still reshaped its trajectory over decades.
New York’s Executive Order No. 62, issued in July 2026, created the first statewide moratorium on hyperscale data centre construction in U.S. history, and Maine came within two legislative votes of its own ban, concrete evidence that regulatory risk to AI infrastructure has already moved from theoretical scenario to active permit constraint in two of the country’s most strategically important buildout markets.
The same dynamic has surfaced across other large energy infrastructure. The scannable list of precedents is worth holding in mind:
- Nuclear reactors, where 67 U.S. units were shut down under sustained activist pressure.
- Pipelines, including Keystone XL and the Atlantic Coast Pipeline, cancelled or derailed despite strong corporate and federal backing.
- Transmission lines, such as Northern Pass and the Plains and Eastern Clean Line, delayed or blocked by siting and land-use conflicts.
- Crypto mining facilities, where municipal and state moratoria over noise, power, and water use offer a recent template for high-density compute.
That last one matters most, because AI data centers share the exact profile, dense power draw, heavy water use, concentrated local impact, that triggered the crypto moratoria.
Local friction vs. national regulation: calibrating the probability
The mistake is treating this as a binary between “banned” and “unimpeded.” It is a gradient, and the two tiers carry very different probabilities.
The high-probability tier is local. Zoning fights, community opposition, and state-level moratoria are already happening and are rated by analysts as likely to delay or reshape specific projects, particularly in the constrained hubs where hyperscalers most want to build.
The lower-probability tier, for now, is broad national legislation capping the buildout. That looks less likely near-term, but the caveat is real: if data-center-driven rate increases, reliability events, or environmental flashpoints become politically salient, federal or state action could tighten permitting standards over the next decade.
Here is the calibration you should take from this. Investors who dismiss the risk because a federal cap seems remote are underweighting the more probable outcome, which is project-level siting conflict adding 12-24 months to individual sites that are already stuck in the interconnection queue. For REITs and infrastructure names with concentrated geographic exposure, that compounding effect is material, not theoretical.
Which equities carry the most deployment-gap exposure?
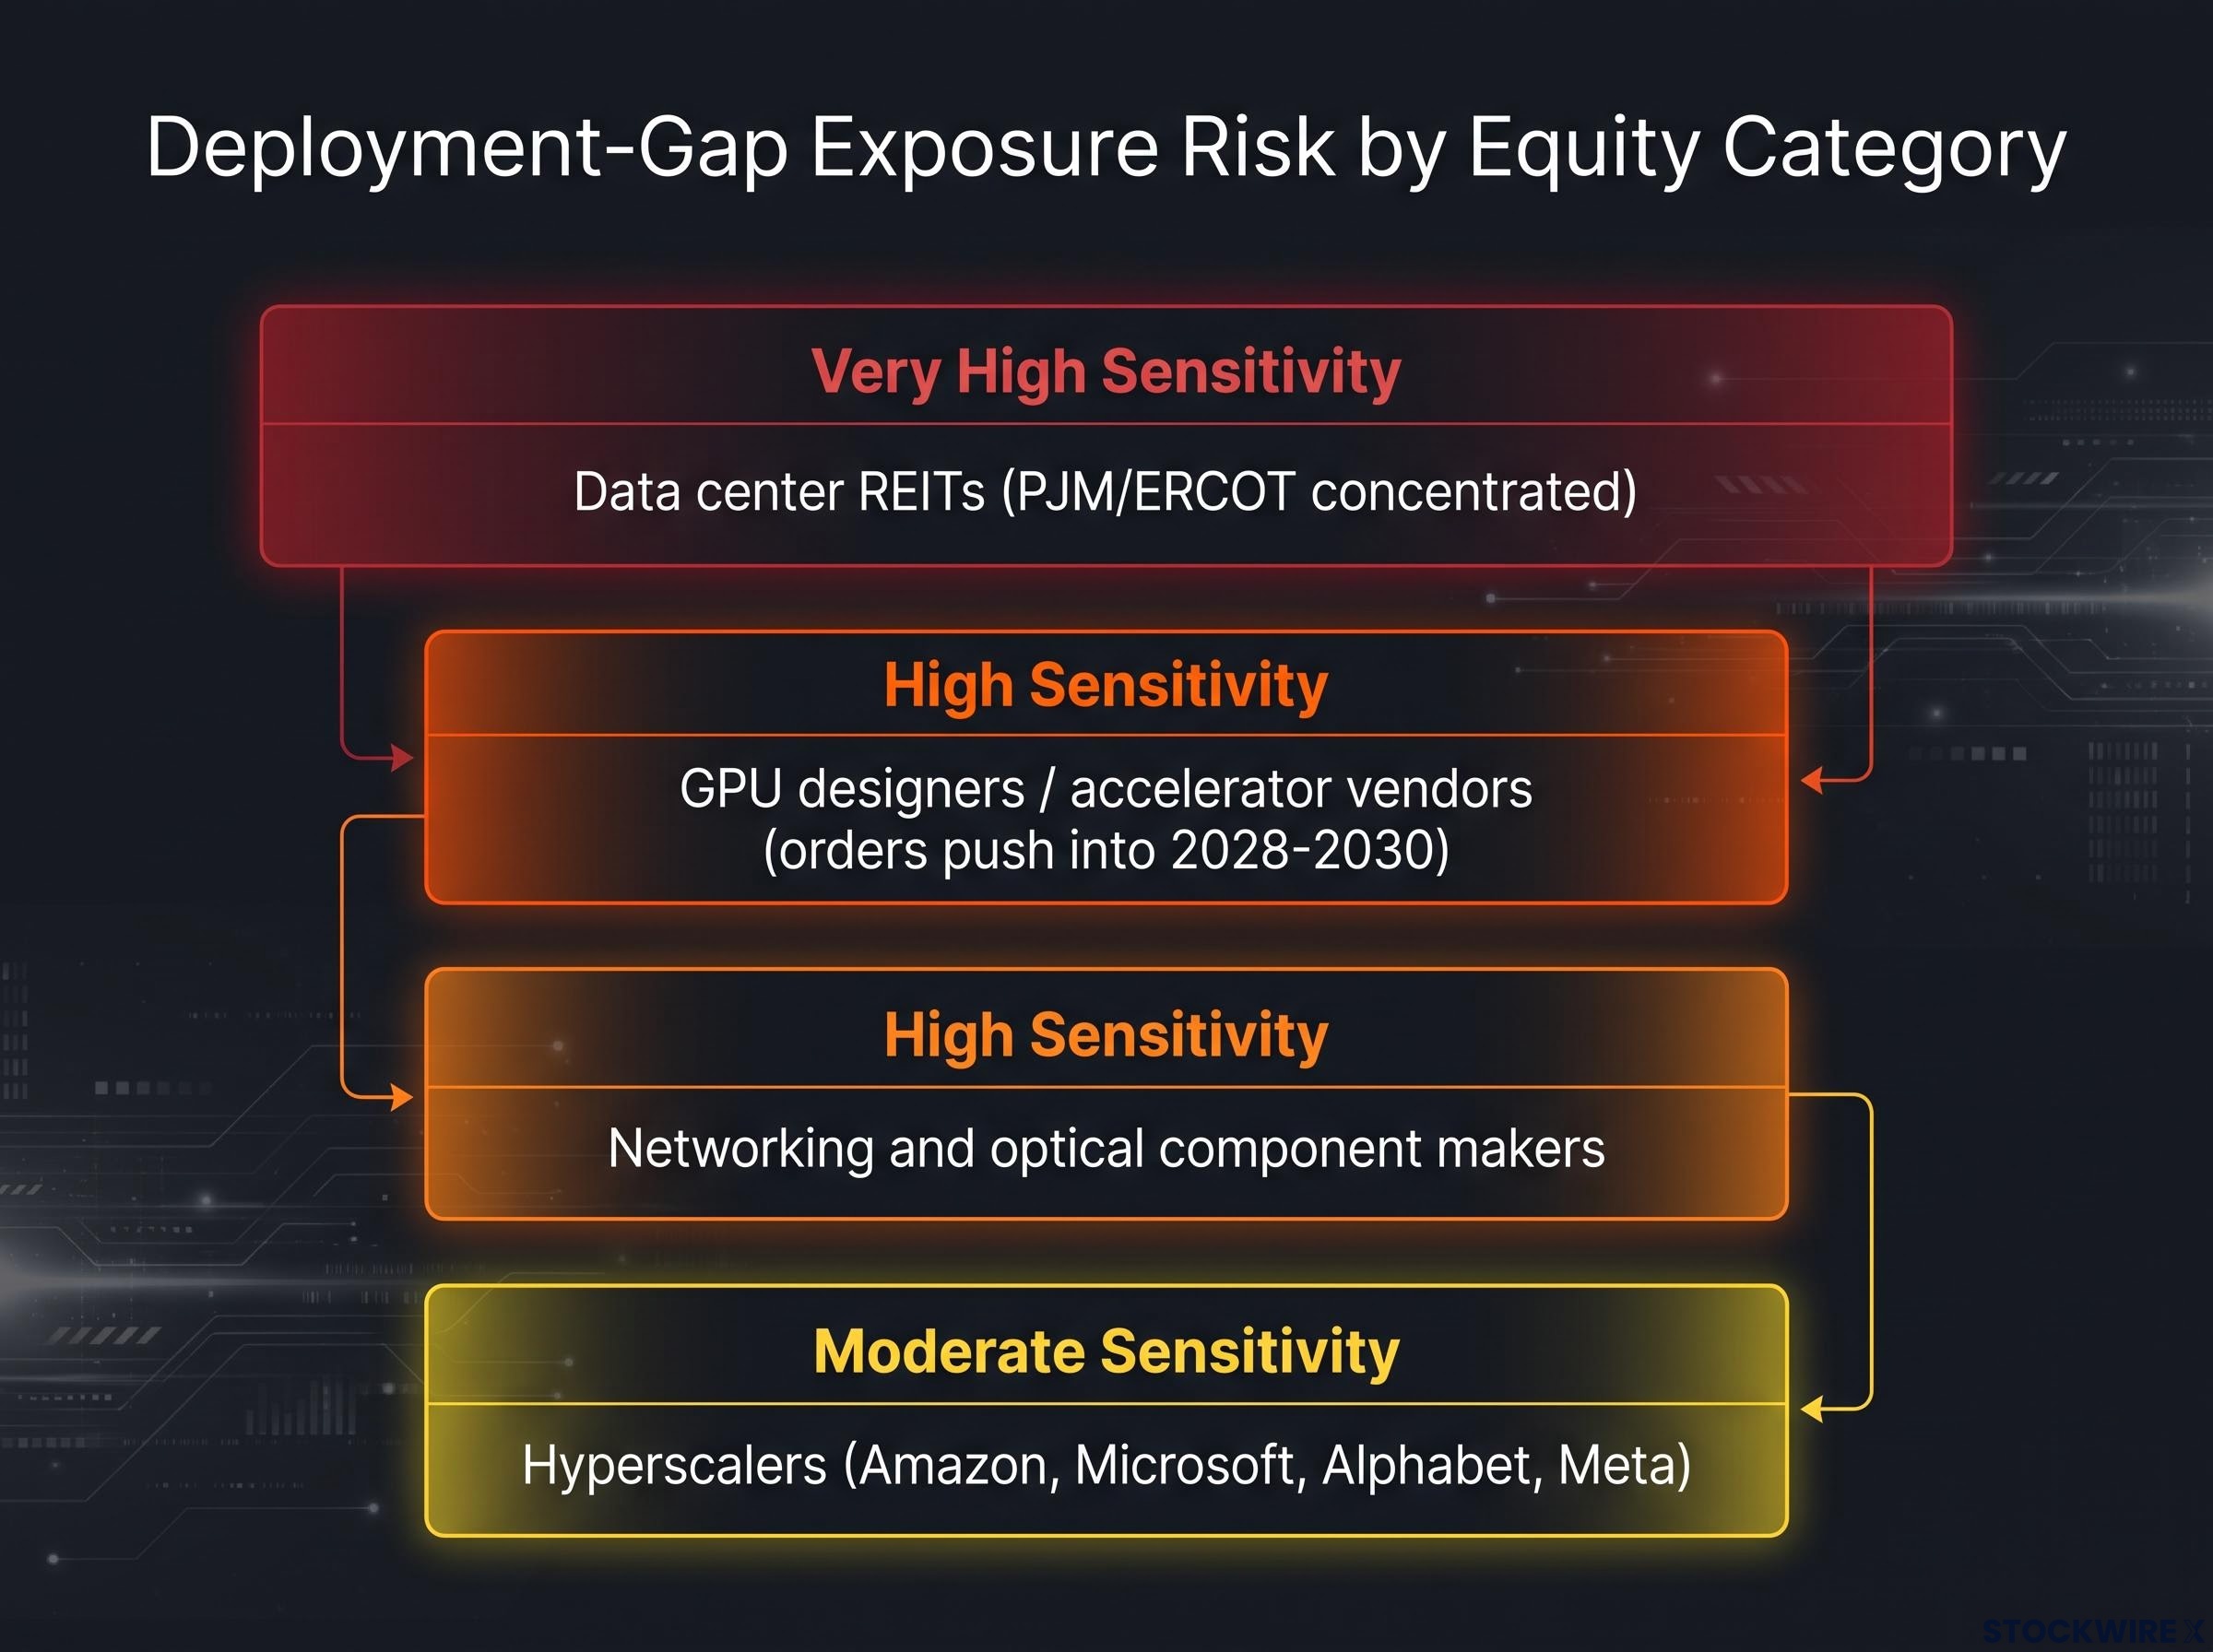
So how do you sort your own book by this risk? The deployment gap does not hit every AI-levered name equally. Four categories carry the most sensitivity, each through a distinct mechanism, and the differences matter for how much timeline slippage each can tolerate.
| Equity Category | Primary Exposure Mechanism | Bottleneck Sensitivity | Offsetting Factor |
|---|---|---|---|
| GPU designers / accelerator vendors | Delayed revenue recognition as chip orders push into 2028-2030 | High | Deep order backlogs may cushion near-term reporting |
| Networking and optical component makers | Revenue tied to build completion, not commitment | High | Retrofit and upgrade demand less deployment-dependent |
| Data center REITs (PJM/ERCOT concentrated) | Delayed occupancy and utilisation from interconnection waits | Very high | Pre-leased capacity locks some revenue regardless of timing |
| Hyperscalers (Amazon, Microsoft, Alphabet, Meta) | Free cash flow compression as capex precedes monetisation | Moderate | Most optionality to reallocate or defer capex |
The mechanism differs by category. For chip and component makers, the gap delays revenue recognition. For REITs, it delays occupancy and utilisation. For hyperscalers, it squeezes free cash flow, because the spend is incurred upfront while monetisation arrives later than current expectations imply if compute is late.
The spending trajectory frames the stakes. CryptoBriefing tracks combined capex climbing from $155 billion in 2022 to $226 billion in 2024, with $381 billion expected in 2025, and characterises the wave as “a trillion-dollar gamble.” IO Fund’s September 2026 read puts 2027 consensus near $934.5 billion, only about 7% shy of the trillion-dollar mark. Goldman Sachs has been cited estimating $5.3 trillion of cumulative capex from 2025 to 2030, though that figure is unverified and worth treating with caution.
Beyond the primary deployment gap sit three second-order risks worth holding separately:
- Stranded or underutilised assets if delays or AI efficiency gains leave data centers and grid upgrades short of the demand current plans assume.
- Oversupply where multiple hyperscalers build overlapping capacity in the same corridors, depressing utilisation and returns.
- Ratepayer cost shifting, where utilities overbuild for speculative load, then recover costs through general tariffs, triggering the exact political pushback that feeds the regulatory wildcard.
The filter to carry away is this. Most AI research is organised around capex levels and chip supply. Ask instead: is this position’s valuation built on 43 GW deploying in 2027, and what happens to its growth multiple if actual deployment lands closer to 25 GW? That weights physical delivery over capital commitment, which is where the least-priced risk sits.
For investors stress-testing their broader equity exposure, our deep-dive into AI capex concentration risk examines how semiconductor companies reached a record 13% of the U.S. equity market by April 2026 and what a hardware-revenue disconnect would do to indices carrying that concentration.
What the deployment gap changes for investors building positions now
Pull the threads together and the finding is straightforward. Front-loaded capex, multi-year interconnection backlogs, and a multi-layer physical constraint stack combine into a credible scenario where 2027 compute deployment undershoots consensus by a material margin. That risk does not appear to be visibly priced into the most AI-levered equities.
This is a calibration exercise, not an exit signal. You do not need to make a binary call on AI infrastructure to act on it. You need to know what to watch, and when a shortfall would start showing up in the data.
Three leading indicators will give you an early read before 2027 deployment figures are ever reported:
- Interconnection queue movement in PJM and ERCOT, specifically whether data-center-zone wait times compress or hold at 36-48 months.
- Power equipment delivery signals from major transformer and switchgear suppliers, which will telegraph whether the equipment layer is easing or tightening.
- Hyperscaler guidance language on compute availability, as distinct from capex commitment, because what they can bring online matters more than what they plan to spend.
For ongoing monitoring, the Interconnection.fyi tracker, updated 26 August 2026, gives you a publicly accessible window into queue trends in real time.
The asymmetry The bull case (43 GW deploying on schedule) requires every layer of the bottleneck stack to clear faster than current data suggests. The bear case (25 GW or below) requires only that the documented structural delays persist, which is the lower-friction outcome.
That asymmetry is the whole point. The resolution timeline itself spans a wide range, from late-2020s optimism on FERC reform to early-to-mid-2030s pessimism on backlog normalisation. Watching the queue data, equipment signals, and guidance language will hand you a materially earlier read on which end of the 25-to-43 GW range 2027 is tracking toward, well before consensus revisions force the adjustment.
This article is for informational purposes only and should not be considered financial advice. Investors should conduct their own research and consult with financial professionals before making investment decisions. Past performance does not guarantee future results. Financial projections are subject to market conditions and various risk factors, and forward-looking statements are speculative and subject to change based on market developments.