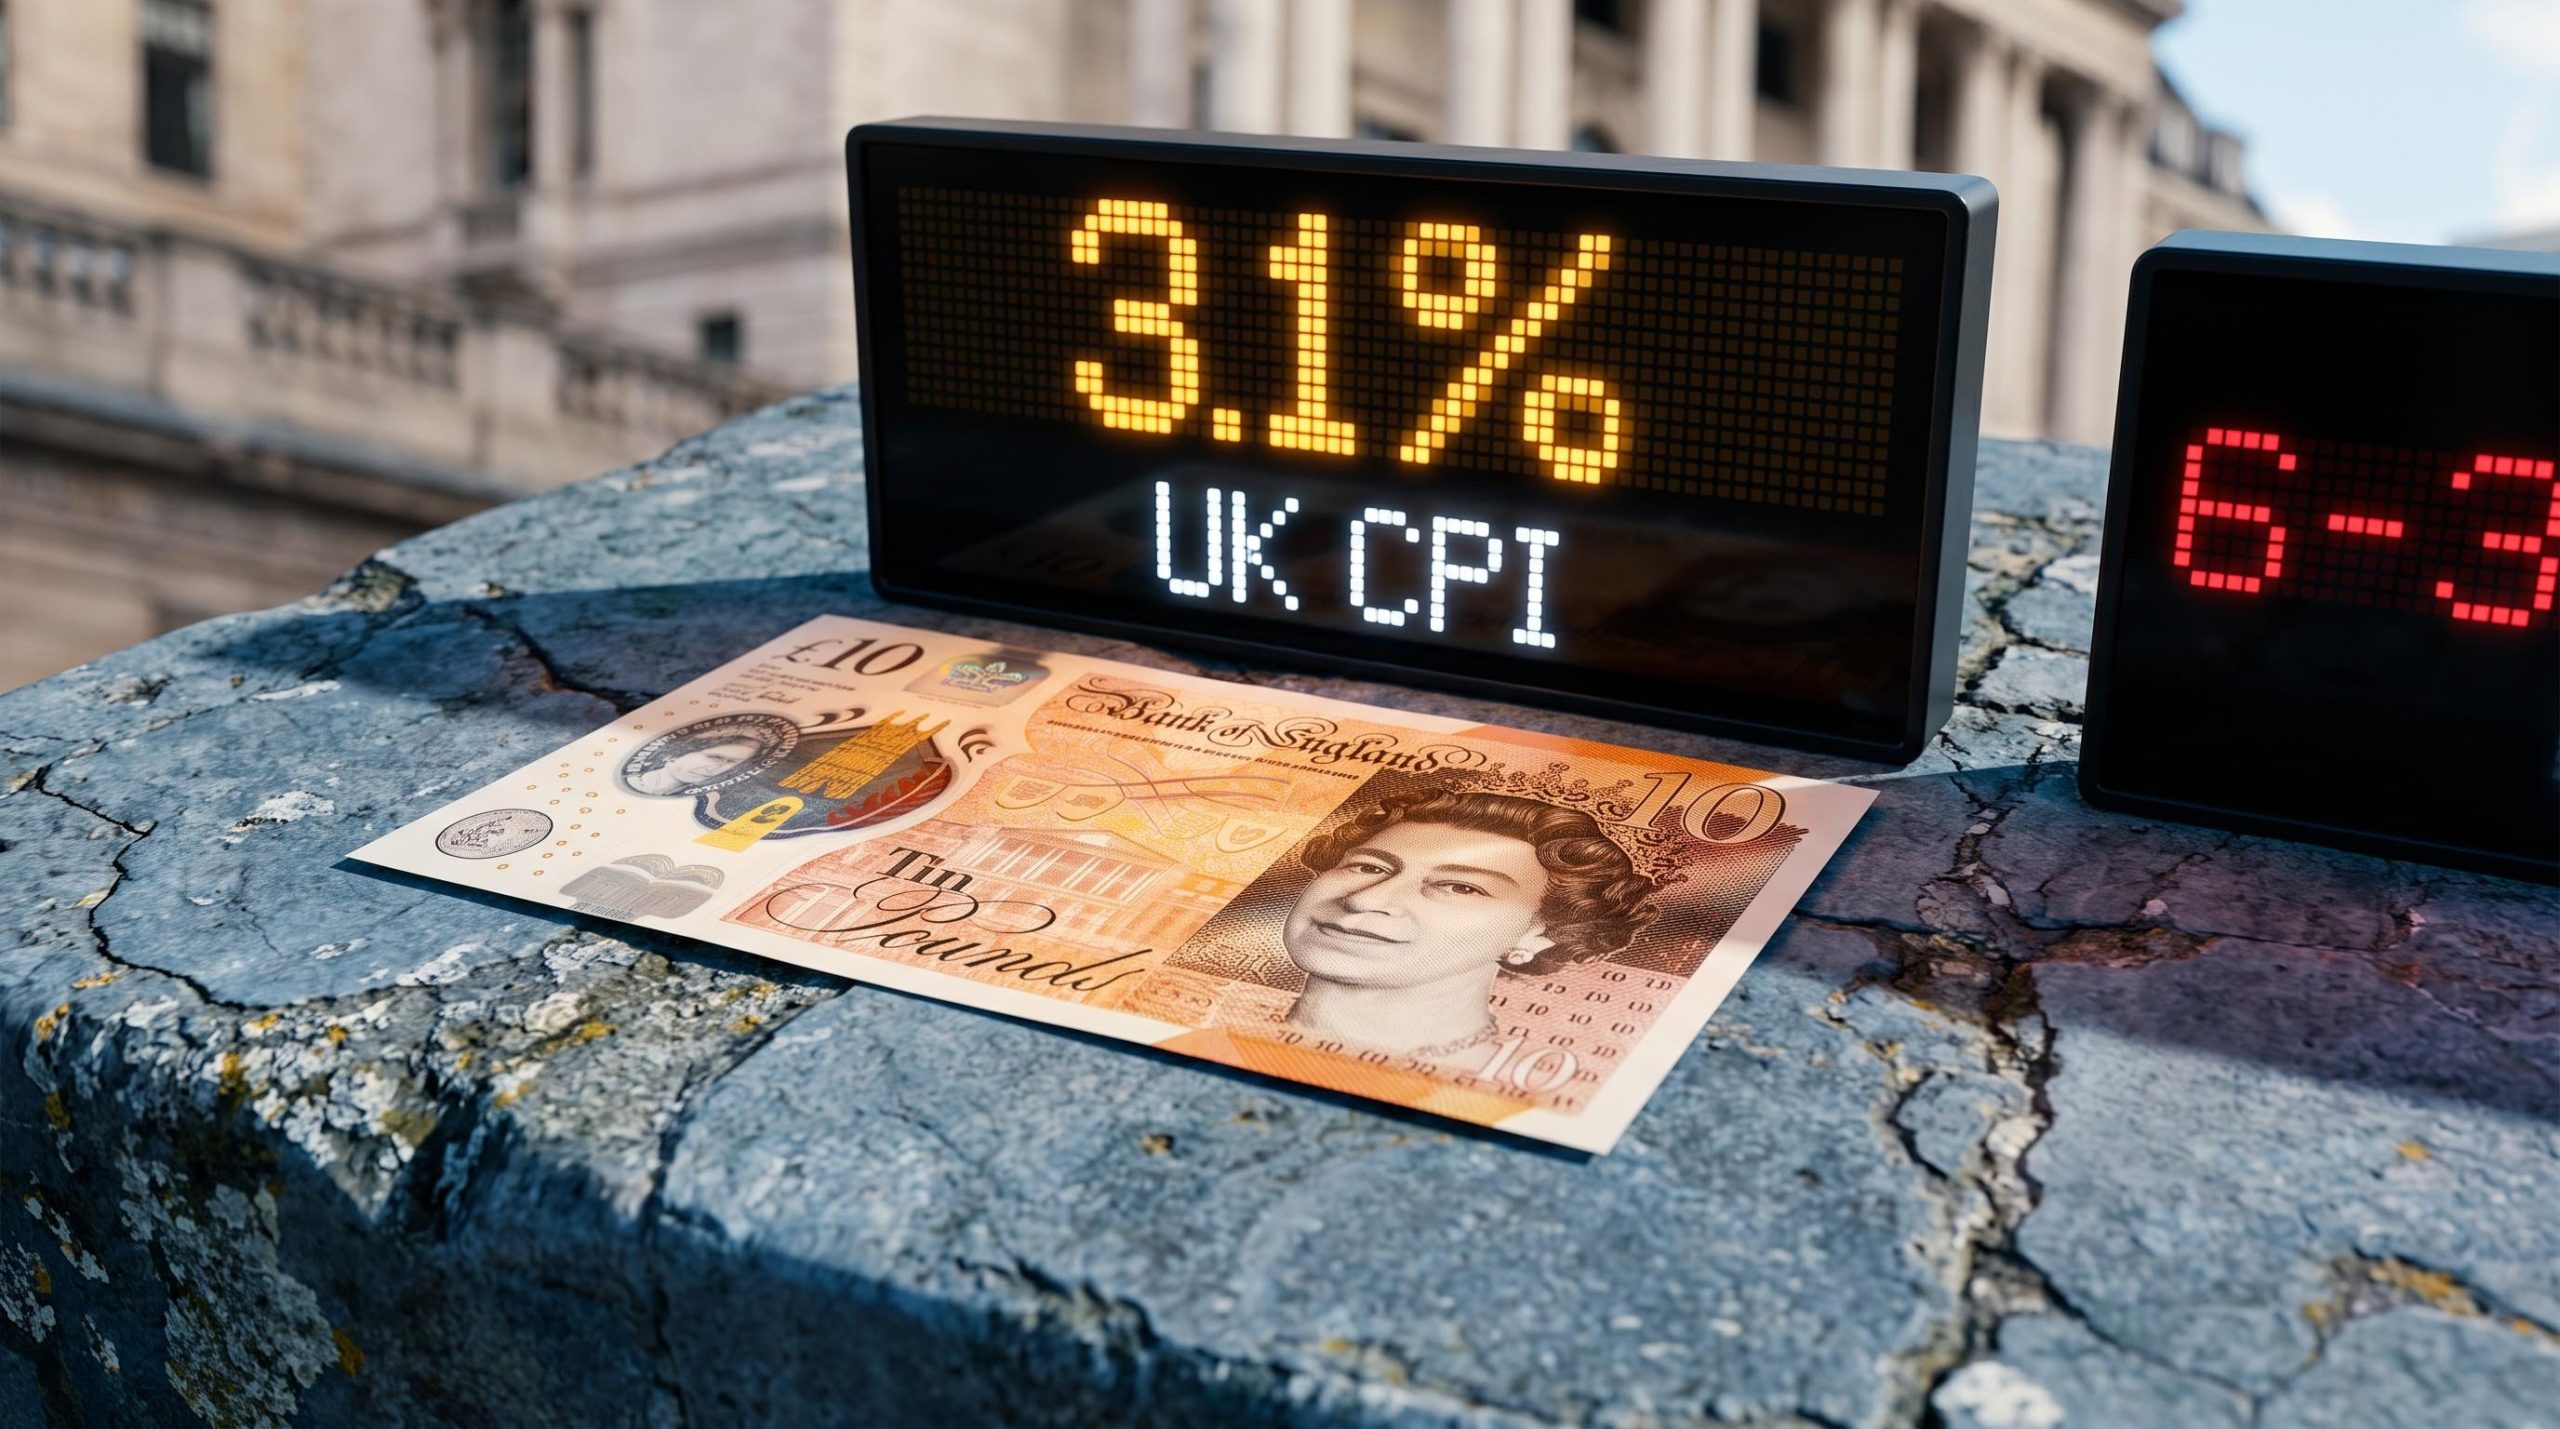
UK headline CPI climbed to 3.1% in August 2026, its highest reading in nine months, and the Bank of England’s own forecasts are already running behind the data. Energy costs drove the bulk of the move, but the more uncomfortable story sits underneath the headline: services inflation, private rents, and catering prices are all pushing higher in ways that do not resolve in a single season.
The timing matters. The August print lands just before a contested Monetary Policy Committee decision on 17 September 2026, with the committee already split 6-3 in favour of holding at 3.75% at its July meeting. Three members voted to hike. With inflation above the Bank’s projections on both the headline and services measures, the margin between a hold and a hike is narrower than markets assumed six weeks ago.
Here is what the data actually tells you about where UK inflation is heading, why the Bank is under more pressure than the hold consensus suggests, and what the current environment demands from your gilt holdings, mortgage decisions, and cash savings over the months ahead.
What the August data actually shows, and where it came from
Headline CPI rose to 3.1% year-on-year in August 2026, up from 2.9% in July, according to ONS data reported by RTÉ and Reuters. That is the highest reading since roughly December 2025, and it matched what most forecasters had penned in.
3.1% CPI in August 2026, the highest in nine months.
Energy was the single biggest driver. Deutsche Bank analyst Sanjay Raja notes that monthly pump prices rose 7% and heating oil jumped 13% on a month-on-month basis, with ongoing Brent crude pressure hinting at more to come. On its own, that would be an uncomfortable but familiar energy story.
What sits beneath the headline is the part that should hold your attention. Private rental costs posted their steepest monthly rise since November 2024, and catering prices recorded their sharpest jump since February 2026. These are domestic services components, and they are re-accelerating independently of the pump.
The July CPI divergence between a headline jump and falling core and services measures was the setup that made the August data so important: when headline and services components re-accelerated together in August, it removed the argument that the MPC could look through the energy noise.
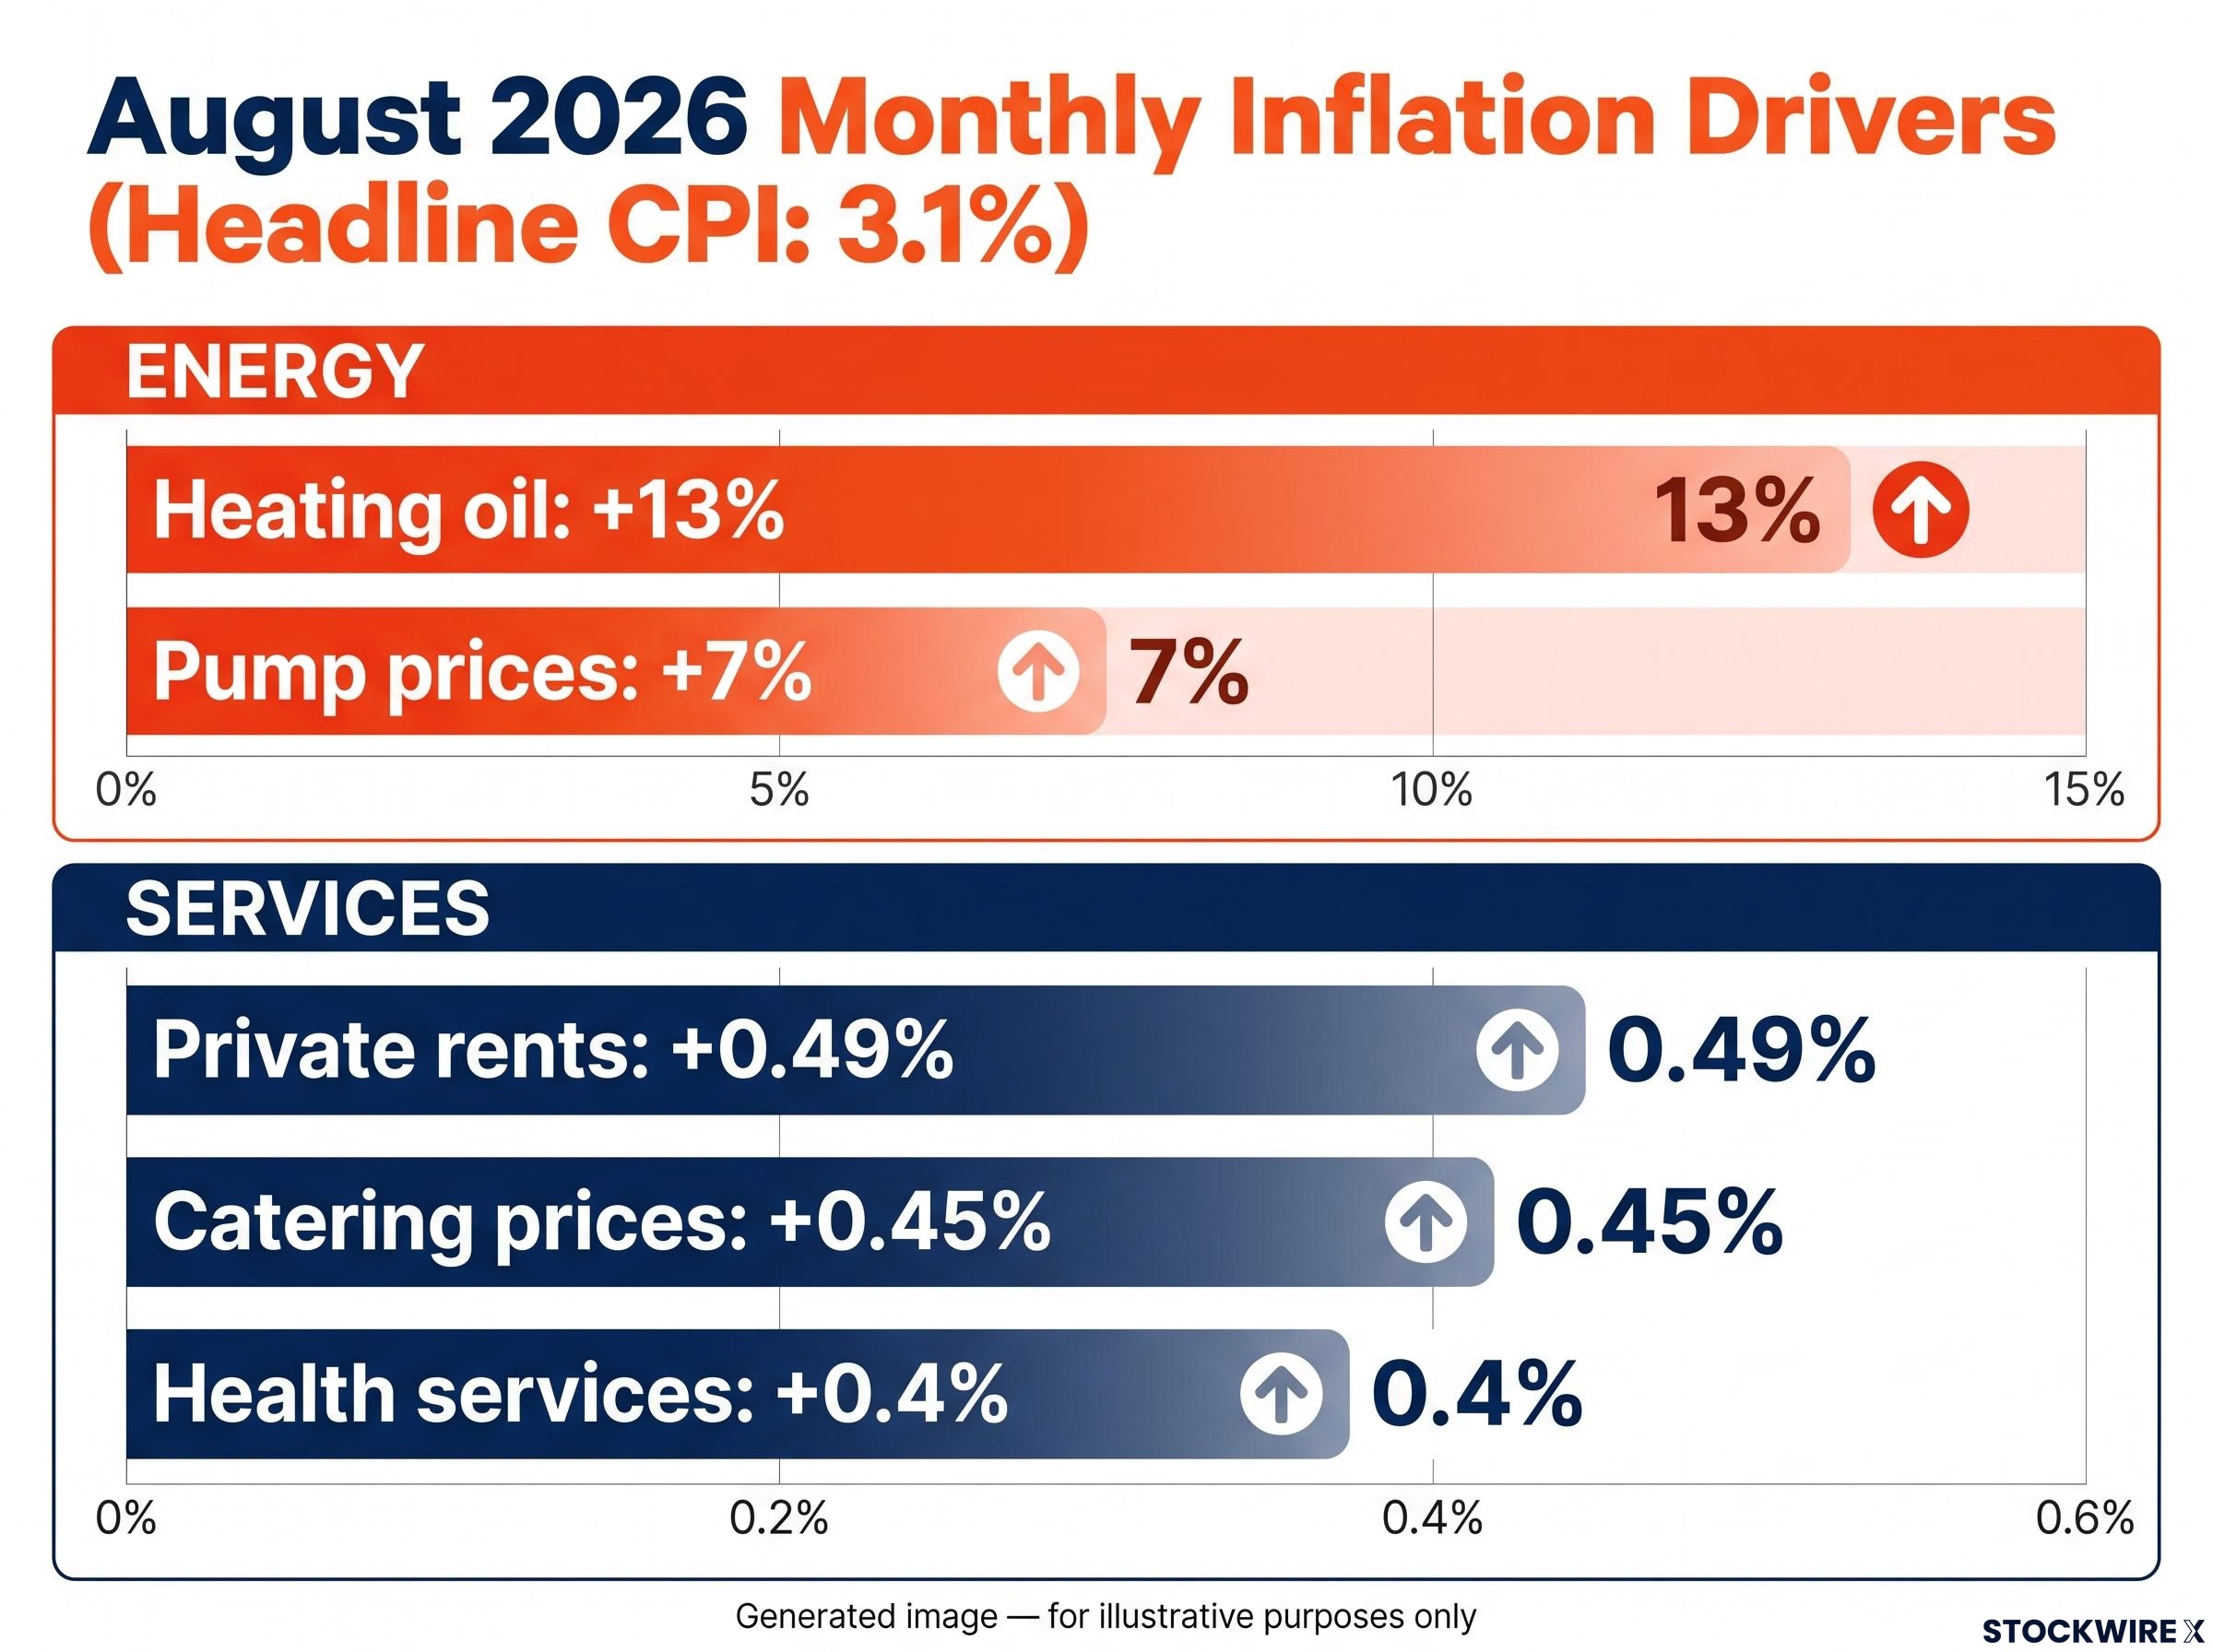
| Component | Monthly Change | Year-on-Year Context | Investor Relevance |
|---|---|---|---|
| Pump prices | +7% | Main headline driver | Energy-led, potentially one-season |
| Heating oil | +13% | Sharp seasonal move | Sensitive to Brent and geopolitics |
| Private rents | +0.49% | Steepest since November 2024 | Structural, hard for the Bank to look through |
| Catering prices | +0.45% | Sharpest since February 2026 | Signals broader domestic re-pricing |
Health services costs also rose 0.4% on the month, while food inflation including non-alcoholic beverages held steady at 1.3% year-on-year, acting as a partial offset. Core CPI, which strips out volatile energy and food, stood at 2.6% in July, the latest reading available.
The split between an energy-driven headline and independently rising services components is the whole story for you as an investor. If this were purely a heating-and-fuel event, the Bank could look through it and wait for the seasonal effect to fade. The fact that rents and catering are climbing on their own suggests a broader re-pricing of domestic costs, which is structurally more persistent and far harder to dismiss.
When big ASX news breaks, our subscribers know first
Why UK inflation keeps outrunning the forecasts
The most telling feature of the August data is not the level of inflation but the gap between the data and the Bank’s own projections. According to Deutsche Bank’s Sanjay Raja, headline CPI is running about 0.25 percentage points above the Bank of England’s forecast, and services CPI is roughly 20 basis points above projection. Food inflation is the one area running below forecast, by around 0.7 percentage points, offering only partial reassurance.
Those are not rounding errors. When inflation surprises to the upside on both the headline and the services measure at the same time, it points to something in the structure of the economy rather than a one-off miss in a spreadsheet.
The wage channel and why it outlasts the energy shock
The Office for Budget Responsibility’s June 2026 Forecast Evaluation Report identifies the 2022 energy shock as the key reason inflation departed from earlier forecasts. Higher energy prices, the OBR argues, drove stronger-than-expected nominal wage growth in an already tight labour market.
That wage growth fed directly into services prices, where labour is the dominant cost. Once pay settlements reset higher, they do not unwind quickly, which is why this transmission runs for years rather than months.
The Bank of England has added its own layer to this. Its Monetary Policy Reports through 2025 flagged higher non-wage labour costs, including increased employer National Insurance contributions, as an additional force keeping services inflation elevated even as goods prices normalised.
Indexed and regulated prices: the structural floor under services CPI
The second amplifier is uniquely British, and it is arguably more important. The Bank of England points to a range of regulated and formula-linked services costs that uprate mechanically in line with past inflation.
- Sewerage and water charges
- Broadband and phone contracts
- Bus fares and vehicle excise duty
- Utility standing charges
- VAT on private school fees
These price-setting mechanisms bake yesterday’s inflation into tomorrow’s bills. That creates inertia, a structural floor under services CPI that persists long after the original shock has passed. The Bank’s February 2026 Monetary Policy Report noted underlying services inflation still running around 4% annualised, and its July 2026 report projects services CPI reaching roughly 3.8% by October.
Deputy Governor Clare Lombardelli told reporters in June 2025 that services inflation “continues to remain sticky.”
The contrast with the euro area sharpens the point. The IMF notes that euro-area headline inflation had broadly returned to around 2% by mid-2025, while UK inflation stayed materially above target because of these domestic regulatory and labour-market dynamics.
For you, the practical takeaway is a reframing. This is not a situation where the Bank can wait for one or two clean prints and then move. The structural amplifiers mean upside surprises are the expected condition, not the exception, and that should shape how long you assume rates stay elevated.
Where rates go from here, and how divided the Bank of England actually is
The rate debate is not a simple hold-or-hike question. It is a genuine analytical disagreement among serious forecasters, and the range of plausible outcomes is wider than the market consensus implies.
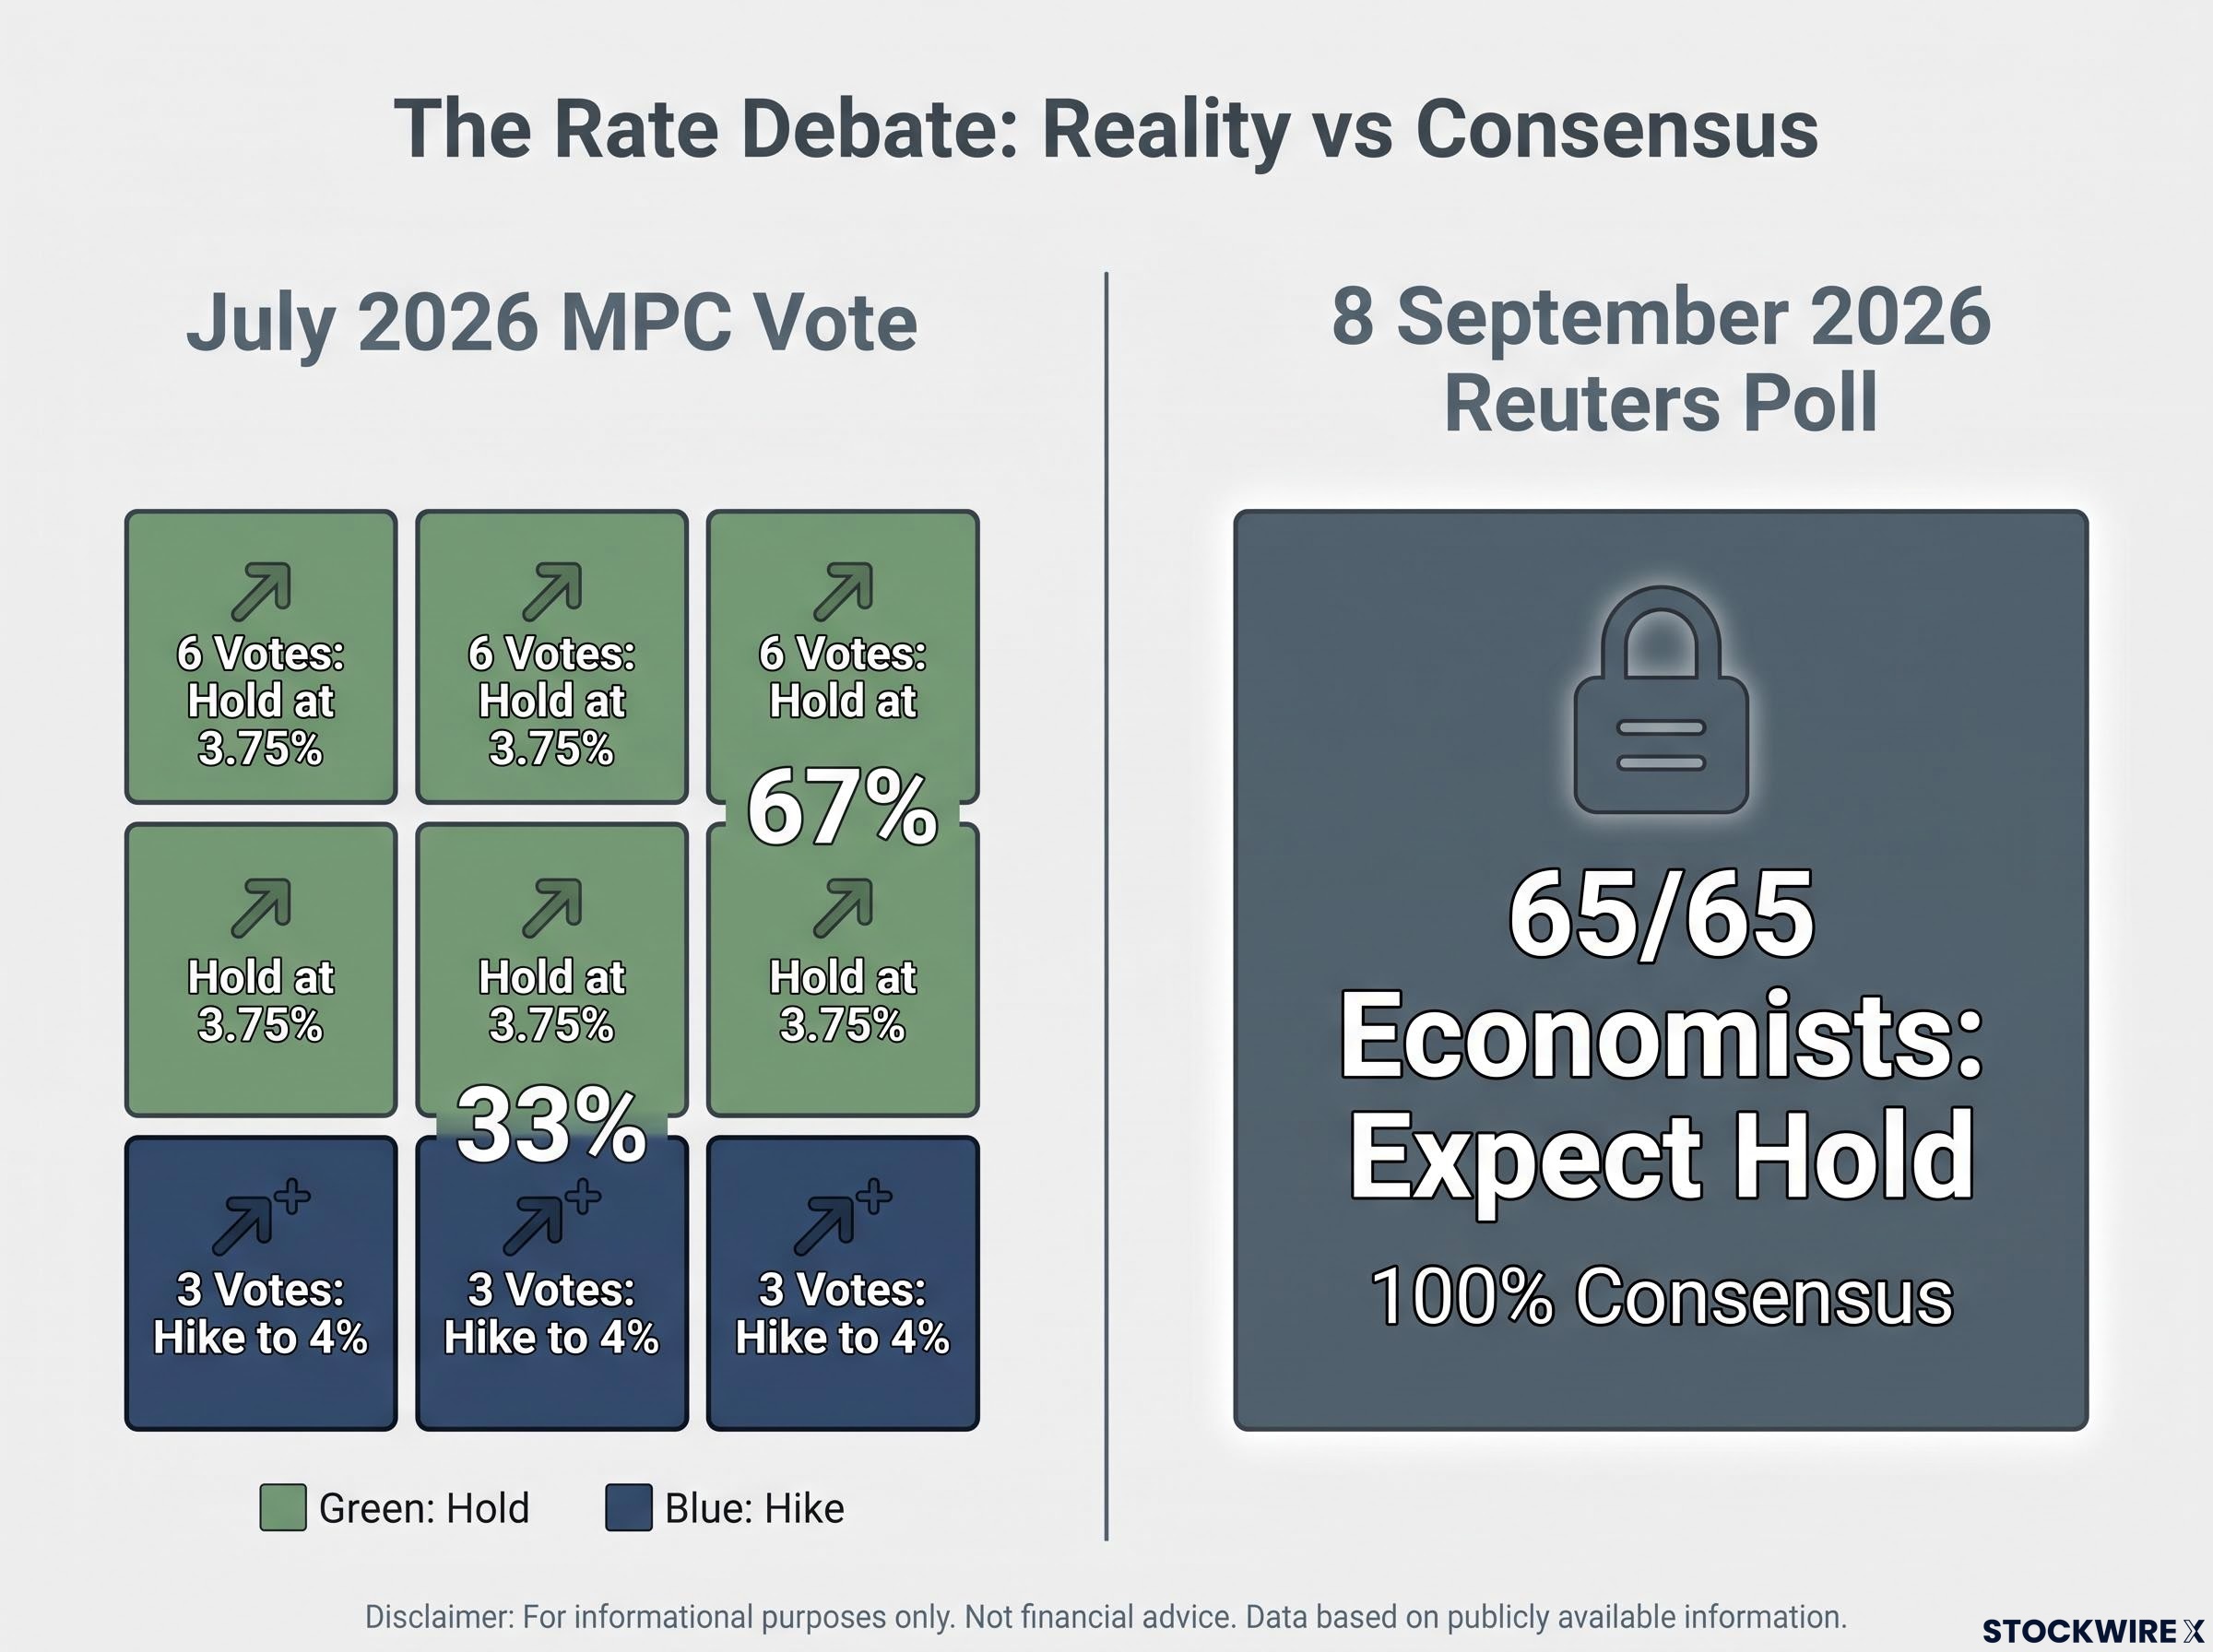
At its July 2026 meeting, the MPC voted 6-3 to hold Bank Rate at 3.75%, with three members preferring a hike to 4%.
That dissent is material and recent. Set against it is a near-unanimous economist consensus: a Reuters poll published on 8 September 2026 found all 65 economists surveyed expected a hold on 17 September, with the median forecast seeing rates unchanged through at least mid-2027. These forecasters argue inflation is elevated but not strong enough to justify renewed tightening given growth uncertainty and the lagged effect of past hikes.
The MPC hawkish bloc grew from one dissenter in April 2026 to three by July, meaning the committee’s internal balance has shifted materially in a single quarter, and five-year swap rates crossing 4.52% show mortgage markets are already repricing ahead of any official move.
| Camp | Representative Forecasters | Central Case | Key Trigger |
|---|---|---|---|
| Hold for longer | Reuters poll consensus, Oxford Economics | Hold at 3.75% through 2026, well into 2027 | Inflation stays contained near forecast |
| Hike risk | Deutsche Bank (Raja), three dissenting MPC members | Hold base case, but rising odds of a move to 4% | Energy surprise or above-forecast services print |
| Delayed cut | UBS (Anna Titareva, unverified) | First cut, but pushed to November 2026 or later | Inflation returning close to 2% target |
Deutsche Bank’s Raja holds a base case for a hold through 2026, but argues the risks of “early and multiple hikes no longer look misplaced.” Oxford Economics, cited by MoneyWeek on 15 September 2026, sits firmly in the hold camp, projecting a peak near 3.2% in Q4 2026 and rates steady into 2027.
The upside risk centres on energy. Raja flags an estimated 9% rise in the Ofgem price cap in January, though that figure is a Deutsche Bank estimate not independently confirmed. Combined with continued Brent pressure and Middle East geopolitical risk, that trajectory feeds a year-end CPI path Raja puts near 3.5%. Some spring and early-summer Reuters polls had already shown 30-40% of respondents expecting at least one 25 basis-point hike by year-end.
If you carry any rate-sensitive exposure, whether a variable mortgage, a savings decision, or short-duration bonds, the 6-3 split is the number that matters most here. It tells you the Bank is not uniformly comfortable holding, and a single further energy surprise or another hot services print could tip the balance.
What rising inflation and the rate plateau mean for gilts, mortgages, and savings
Macro analysis is only useful when it reaches your portfolio. The combination of high nominal yields and above-target inflation reshapes three of the most common UK household financial decisions right now.
Gilt markets and what elevated yields signal for bond investors
UK gilt yields have climbed sharply. The UK Debt Management Office’s 2025-26 Annual Review records 10-year par yields around 4.92% and 30-year yields near 5.49% by the end of the financial year, with episodes above 5% on the 10-year through 2026. Bank of England analysis shows 10-year yields up roughly 20 basis points to around 4.8% and 30-year yields up about 50 basis points to around 5.7% between January and early September 2025.
The Resolution Foundation’s September 2025 work on “UK exceptionalism” ties these elevated yields directly to sticky domestic inflation, which has pushed UK borrowing costs above international peers. For existing bondholders, rising yields mean falling prices on what you already own. For new buyers, those same yields lock in a higher income, but only if inflation eventually cools rather than climbing further.
Long-end gilt yields have been pushed to multi-decade highs by a combination of sticky domestic inflation and the Bank’s own quantitative tightening programme, and reports that the BoE is moving to scrap active sales of 20- and 30-year bonds suggest the institution is already managing the tension between rate policy and long-end market stability.
Mortgages and savings in a rate-plateau environment
The financial choices come down to three questions.
- Gilts: Yields near multi-year highs look attractive on paper, but the 6-3 hike risk means locking in long duration now carries the danger of further price falls if the Bank moves. New buyers capture income; existing holders wear the mark-to-market.
- Mortgages: Variable and tracker holders already carry the cost of 3.75%. Fixing now might capture a peak, or it might lock you in just before a hike. The MPC split argues against assuming the peak has passed.
- Savings: The base rate has kept nominal savings returns reasonable, but with CPI at 3.1% and some forecasts pointing to 3.5%, the real return on cash is thin and could turn negative if inflation surprises again.
The uncomfortable read is this. High nominal yields on gilts and cash disguise a much smaller, and potentially negative, real return once above-target inflation is stripped out. The OBR notes the 2022 shock’s second-round effects have extended the real-income squeeze on households across several years, and that gap between headline and real is what you need to factor into any allocation call.
What the rate plateau ends and what breaks first
The question that matters for planning is not the current direction of inflation but what would have to change for it to resolve. Three forward-looking variables will decide whether this story settles in 2027 or extends further.
- The January Ofgem price cap: Deutsche Bank estimates a 9% rise (unverified). A smaller-than-feared increase would ease the headline; a larger one keeps energy driving CPI higher into next year.
- The services CPI trajectory: The Bank’s July 2026 report projects services inflation reaching about 3.8% by October. Sustained movement below that path is the signal the domestic re-pricing is fading.
- Food price risk: Raja flags extreme heat, drought, and a potential El Niño event as upside risks to currently subdued food prices. A clean season keeps this offset in place; a bad one removes it.
The resolution condition is clear enough. The Bank shifts from hold to cut only when services inflation and wage settlements move durably lower, and neither is visible in the current data.
The IMF’s 2026 World Economic Outlook expects UK inflation to approach approximately 4% before returning to target as energy effects fade and the labour market weakens.
The euro area offers the reference path. IMF and ECB data show euro-area headline inflation returning to around 1.9-2.1% in 2025 as energy turned disinflationary and wages moderated. The UK route exists, but it requires both conditions to align at once.
For anyone weighing when to fix a mortgage, extend bond duration, or add equity exposure, that is the crux. Relief depends on energy stabilising and services moderating simultaneously, and neither has appeared yet, which makes 2027 the more realistic planning horizon than year-end.
This article is for informational purposes only and should not be considered financial advice. Investors should conduct their own research and consult with financial professionals before making investment decisions. Past performance does not guarantee future results. Financial projections are subject to market conditions and various risk factors, and forward-looking statements are speculative and subject to change.
Making a proportionate call in an inflation-plateau environment
The picture that emerges is coherent. UK inflation is running above the Bank’s own forecasts, amplified by structural forces that models keep underestimating, and heading into a period of genuine energy-driven upside risk. The Bank of England is more divided than the near-unanimous hold consensus suggests, and the 6-3 July vote is the proof.
For your finances, that resolves into three practical realities. The real return on cash and short gilts is far thinner than the nominal yields imply. The mortgage fix-or-float decision carries a real, not negligible, hike risk that argues against assuming the peak is in. And meaningful relief depends on services moderation and energy stabilisation arriving together, which points toward 2027 rather than late 2026.
The evidence supports caution and monitoring over decisive moves in either direction. Watch the January Ofgem cap, the services CPI trajectory, and food prices. Those three variables are what signal the shift before it shows up in the headline.
For readers wanting to track the November MPC meeting as the next live decision point, our full explainer on reading a Bank of England rate decision covers the specific data variables the committee conditions its votes on and how to interpret different vote split outcomes before markets move.