During the FY26 August reporting season, the companies that announced the largest dividends did not always deliver the strongest share price returns. That gap is not a rounding error. Understanding why it exists is the difference between income investing and income trapping.
Around 200 ASX-listed companies reported full-year results for the 12 months ended 30 June 2026, and they did so against a shifting backdrop: 10-year Australian government bond yields above 5%, capital gains tax policy changes from the May 2026 federal budget, and three years of healthcare underperformance ending abruptly. These forces are not sequential. They are reshaping the calculus for ASX investors all at once.
Here is a structured framework for reading what the FY26 season actually signals about where returns are likely to come from in FY27, sector by sector and balance sheet by balance sheet.
What the FY26 season tells you about corporate Australia’s financial health
The headline is reassuring and slightly misleading. Results broadly met analyst expectations, which sounds like a quiet season. Underneath that aggregate, the variation was anything but quiet.
Board-level caution through the first half of FY26, a response to market turbulence, meant many companies set a low bar going into results. When underlying performance came in ahead of that cautious guidance, the aggregate outcome looked more modest than the actual company strength warranted.
The understated story sits on the balance sheet. Corporate debt landed lower than the market had estimated, and interest coverage ratios beat forecasts. That combination gave boards the confidence to lift dividends above expectations.
Here are the aggregate findings worth anchoring to:
- Approximately 200 ASX-listed companies reported full-year results for the year ended 30 June 2026
- Over one-third of them saw share price moves exceeding plus or minus 5% on results day
- Dividend payouts came in marginally above forecasts
- ASX 200 dividend growth is projected at approximately 4% for FY27
- Companies declaring inaugural dividends performed particularly strongly on announcement day
What this tells you is that markets rewarded capital discipline specifically, not earnings growth broadly. The same earnings result produced very different reactions depending on a company’s debt profile and dividend trajectory. For FY27 stock selection, that means weighting financial conservatism more heavily than in prior cycles.
Why dividend signals carried more weight than usual in August 2026
The capital gains tax changes announced in the May 2026 federal budget lifted demand for franking credits among retirees and pensioners. Franking credits are the tax offsets attached to dividends paid from company profits that have already been taxed, and they are worth more to income-focused investors than the headline yield alone suggests.
Franking credit value varies substantially across investor structures: for SMSF pension-phase members, excess credits are refunded in full as cash by the ATO, making a fully franked 4% yield worth materially more than the same headline yield from an unfranked source.
The ATO capital gains tax reform detail confirms the specific policy shift that elevated the relative value of franked dividend income for retirees and pension-phase investors, giving the structural demand argument regulatory grounding beyond assertion.
That structural demand shift amplified the share price response to dividend announcements well beyond what earnings quality alone would have justified. When a large buyer base is actively hunting franked income, a dividend beat becomes a stronger signal than the same beat would have sent a year earlier.
When big ASX news breaks, our subscribers know first
Bond yields above 5% and what they mean for how you value ASX equities
For most of the past decade, the arithmetic favoured equities in one simple way: ASX dividend yields sat above what a 10-year Australian government bond would pay you. Owning shares gave you a higher income stream and the prospect of capital growth on top. Since mid-2023, that relationship has flipped.
Persistent inflation and energy cost pressures have pushed the Australian 10-year government bond yield above 5% during the reporting period, reaching multi-year highs in mid-September 2026. Trading Economics reported a yield of 5.38% on 15 September 2026, and ABC News noted yields above 5.35% on 11 September 2026 (both figures unverified). Markets are pricing at least one further rate increase this year.
Now run the comparison. A sample ASX dividend basket recently yielded around 4.1%, trailing a bond yielding roughly 4.8% to 5.4% (unverified).
The inversion in plain terms: an ASX dividend basket yielding around 4.1% now sits below a 10-year government bond yielding above 5%. For most of the past decade, that relationship ran the other way.
The mechanics follow logically. A rising risk-free rate lifts the equity risk premium, the extra return investors demand for holding shares instead of safe government debt, and it raises the discount rate used to value future company cash flows. Higher discount rates compress valuations most severely for long-duration and heavily indebted sectors, and they push capital toward fixed income and cash-rich defensive names.
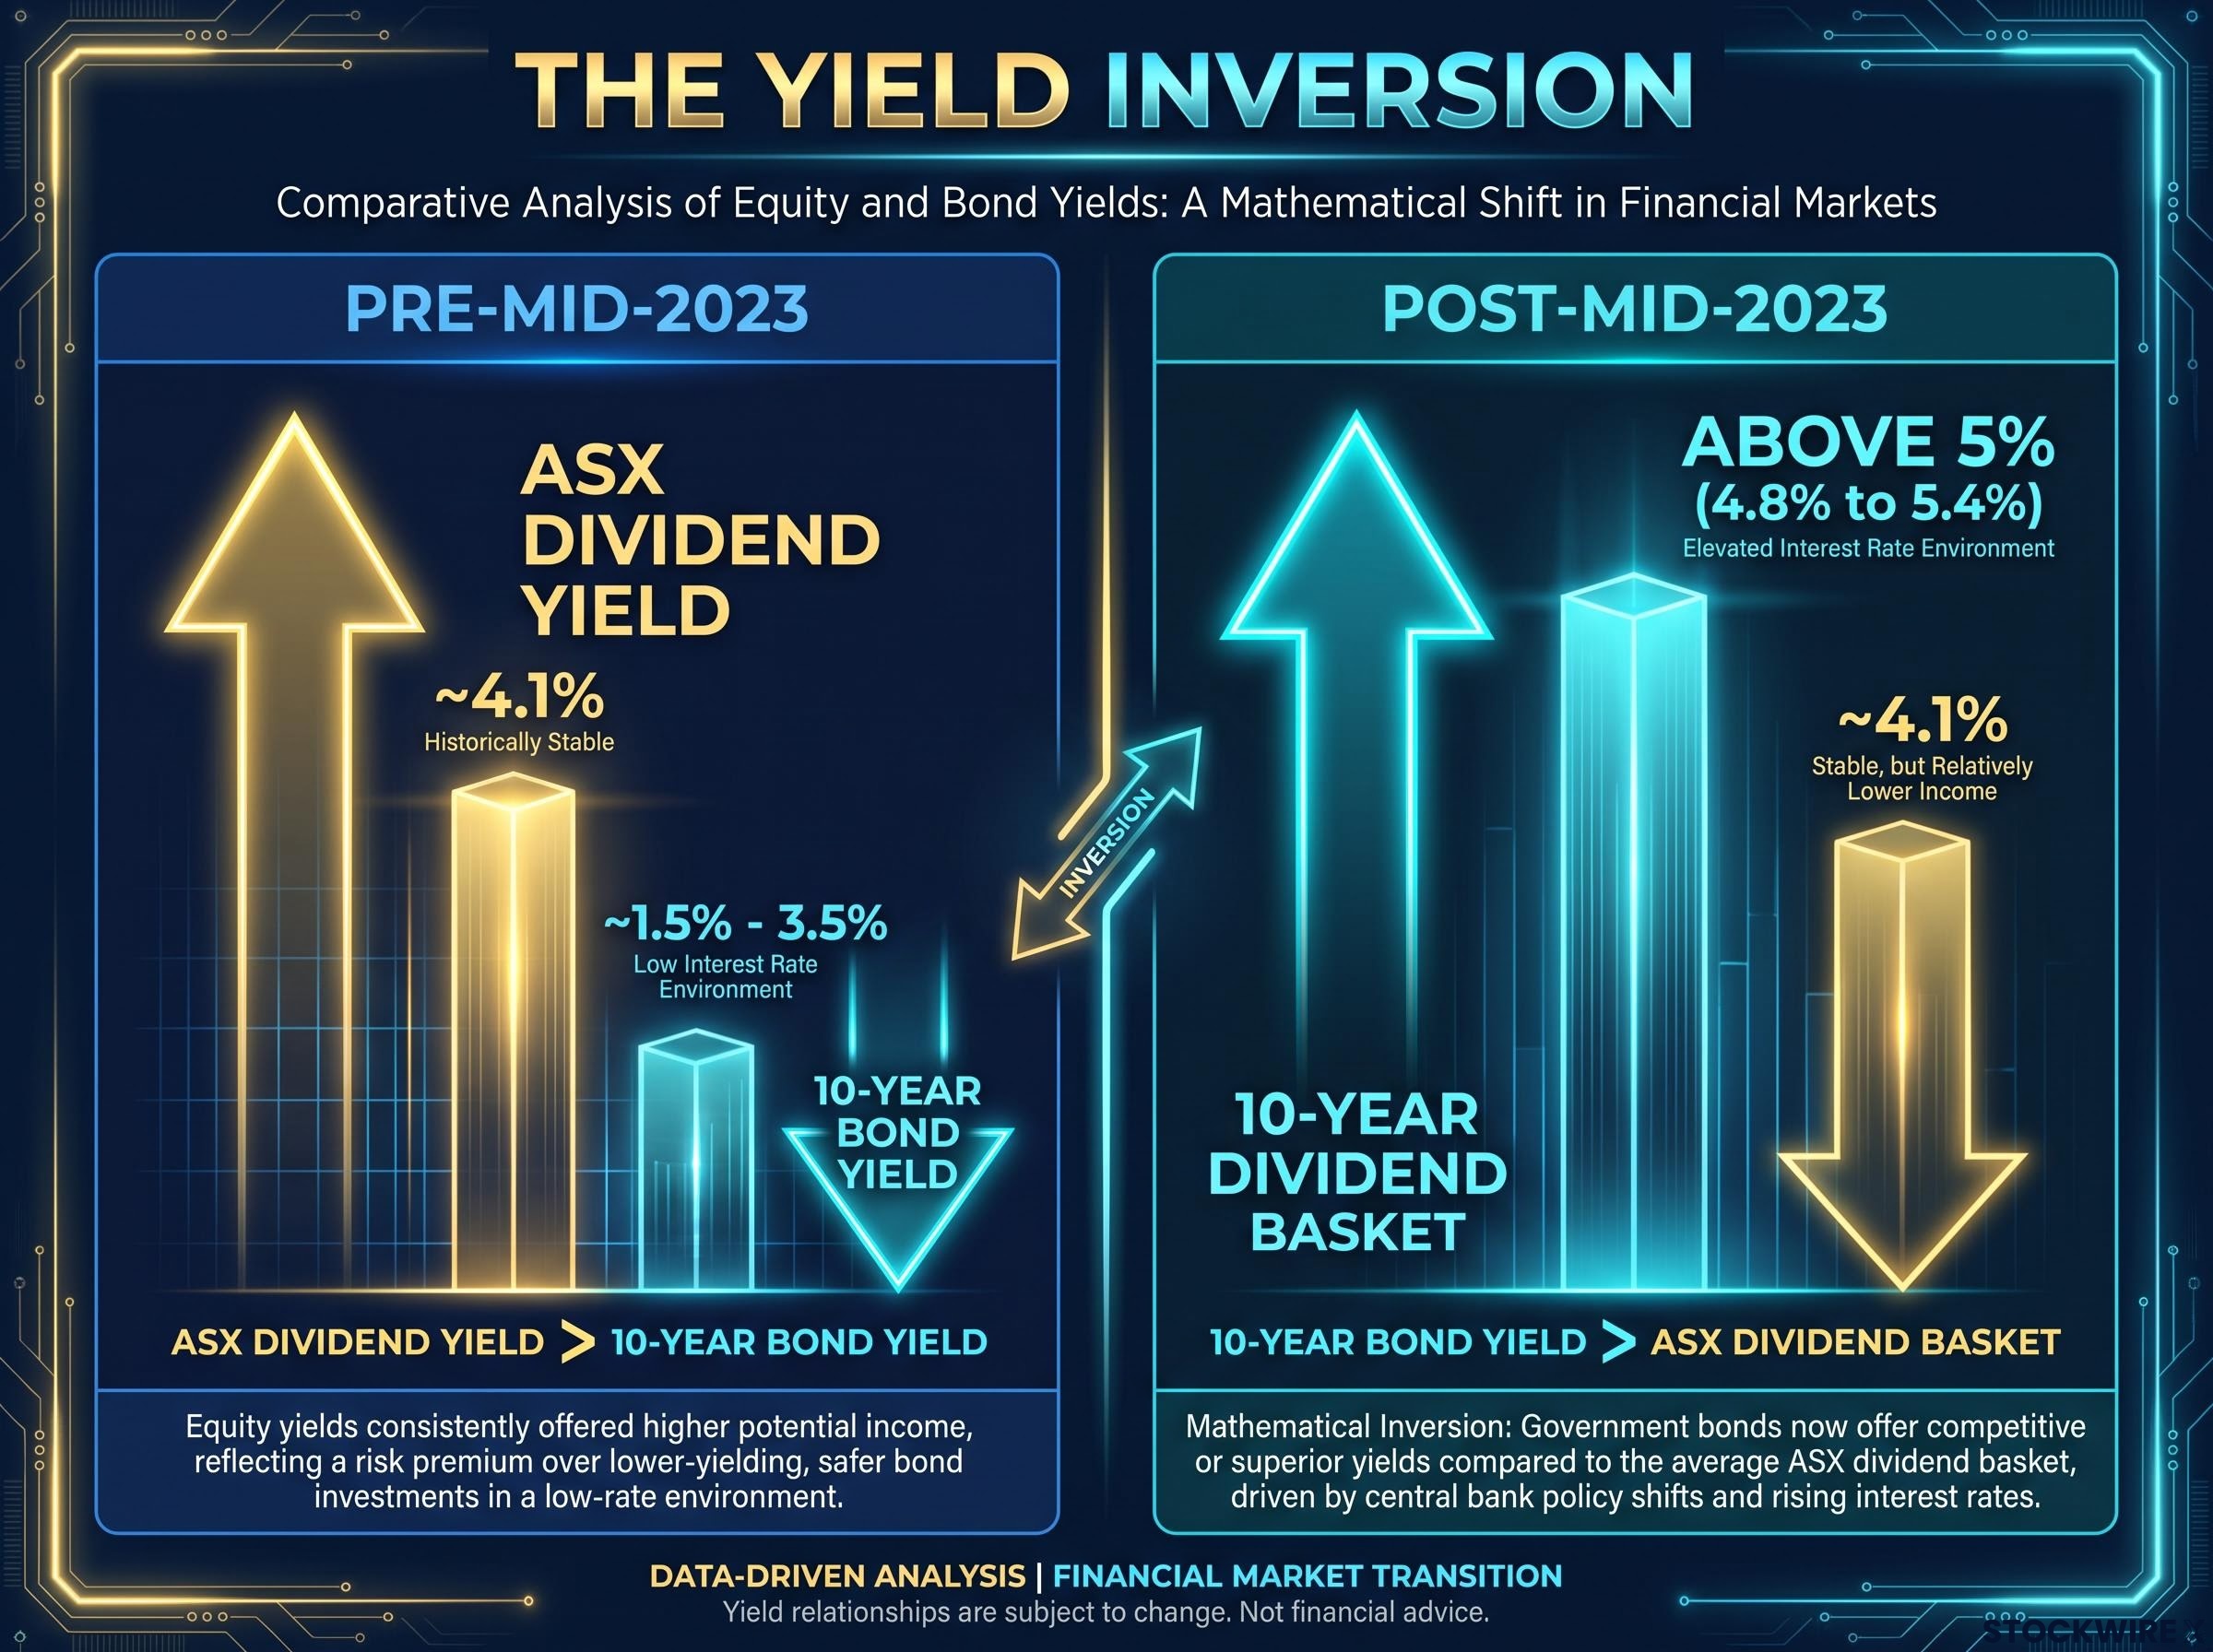
| Period | Relationship | Indicative figures (unverified) |
|---|---|---|
| Pre-mid-2023 | ASX dividend yield above 10-year bond yield | Equity income the higher payer |
| Post-mid-2023 | 10-year bond yield above ASX dividend yield | ASX basket ~4.1% vs bond above 5% |
When a risk-free asset pays more than the average ASX dividend basket, the burden of proof shifts onto equities. Shares now have to justify their valuation through earnings growth or capital appreciation, not income alone. That means income-only strategies built for a low-rate world need a fundamental rethink right now, and it explains why certain ASX sectors are being de-rated even when their earnings are perfectly stable.
ASX dividend yield compression has been running since mid-2023, with the broad market income basket falling to roughly 3.3%, nearly a full percentage point below its 10-year average, a structural gap that reinforces why the income arithmetic for equity-only portfolios has fundamentally shifted.
Sector divergence in FY26: healthcare’s comeback and resources’ uneven terrain
The market is not one story. In FY26 it was several, and your positioning depended entirely on which story you happened to be inside.
Healthcare was the season’s standout. After roughly three years of sustained underperformance, the sector recovered materially, and it did so because market positioning was not aligned for even a modest improvement. When you are that under-owned, marginal beats trigger outsized reactions. Analysts have described the move as a reset, driven by depressed prior valuations, strong underlying cash flows, and structural demand tailwinds such as plasma products, immunoglobulins, and imaging software that stay relatively insensitive to macro cycles.
Three sector narratives, in order of analytical significance:
- Healthcare as the season’s clear standout, recovering from a deep valuation trough
- Banking as the income anchor, with dividends holding but credit clouds forming
- Resources as the watch list, delivering mixed results amid global commodity uncertainty
CSL Limited anchored the healthcare revival. Its shares rallied between 30% and 35% across the broader reporting period and surged roughly 17% on results day (unverified). The result itself was messy on paper: total revenue of US$15.8 billion (down about 1% at constant currency), underlying NPATA of US$3.1 billion, and a statutory net loss of approximately US$2.6 billion driven by US$7.1 billion in pre-tax impairments and restructuring costs (unverified). Investors looked straight past the loss, focusing instead on operating cash flow of US$3.5 billion, a maintained full-year dividend of US$2.92 per ordinary share, and FY27 guidance of around 5% NPAT growth (unverified).
The recovery was sectoral, not a single-stock event. Pro Medicus posted around 24% underlying NPAT growth, a 25% dividend increase, and a roughly 12% share price jump. Cochlear delivered earnings at the top end of guidance and saw its shares rise about 8% (both unverified).
What healthcare tells you is that when a sector is structurally under-owned and depressed in valuation, the entry opportunity does not wait for certainty to arrive. That positioning lesson applies well beyond healthcare.
The healthcare sector recovery thesis rests on a distinction institutional investors had already been pricing before August 2026: that five years of share price weakness reflected valuation compression from rate rises rather than any deterioration in the structural demand driving global earners like CSL and Cochlear.
| Sector | Key result | Share price reaction | FY27 outlook signal |
|---|---|---|---|
| Healthcare (CSL) | Statutory loss on impairments, strong cash flow, dividend held | CSL up ~17% on day | Structural demand tailwinds; durable recovery thesis |
| Banking (CBA) | Cash NPAT A$11.0B, up 7.1%; benign bad debts | Dividends slightly above expectations | Negative gearing policy the swing variable |
| Resources | Mixed outcomes | Uneven | Tied to global commodity uncertainty |
Banking sector: dividends holding, but credit growth clouds are forming
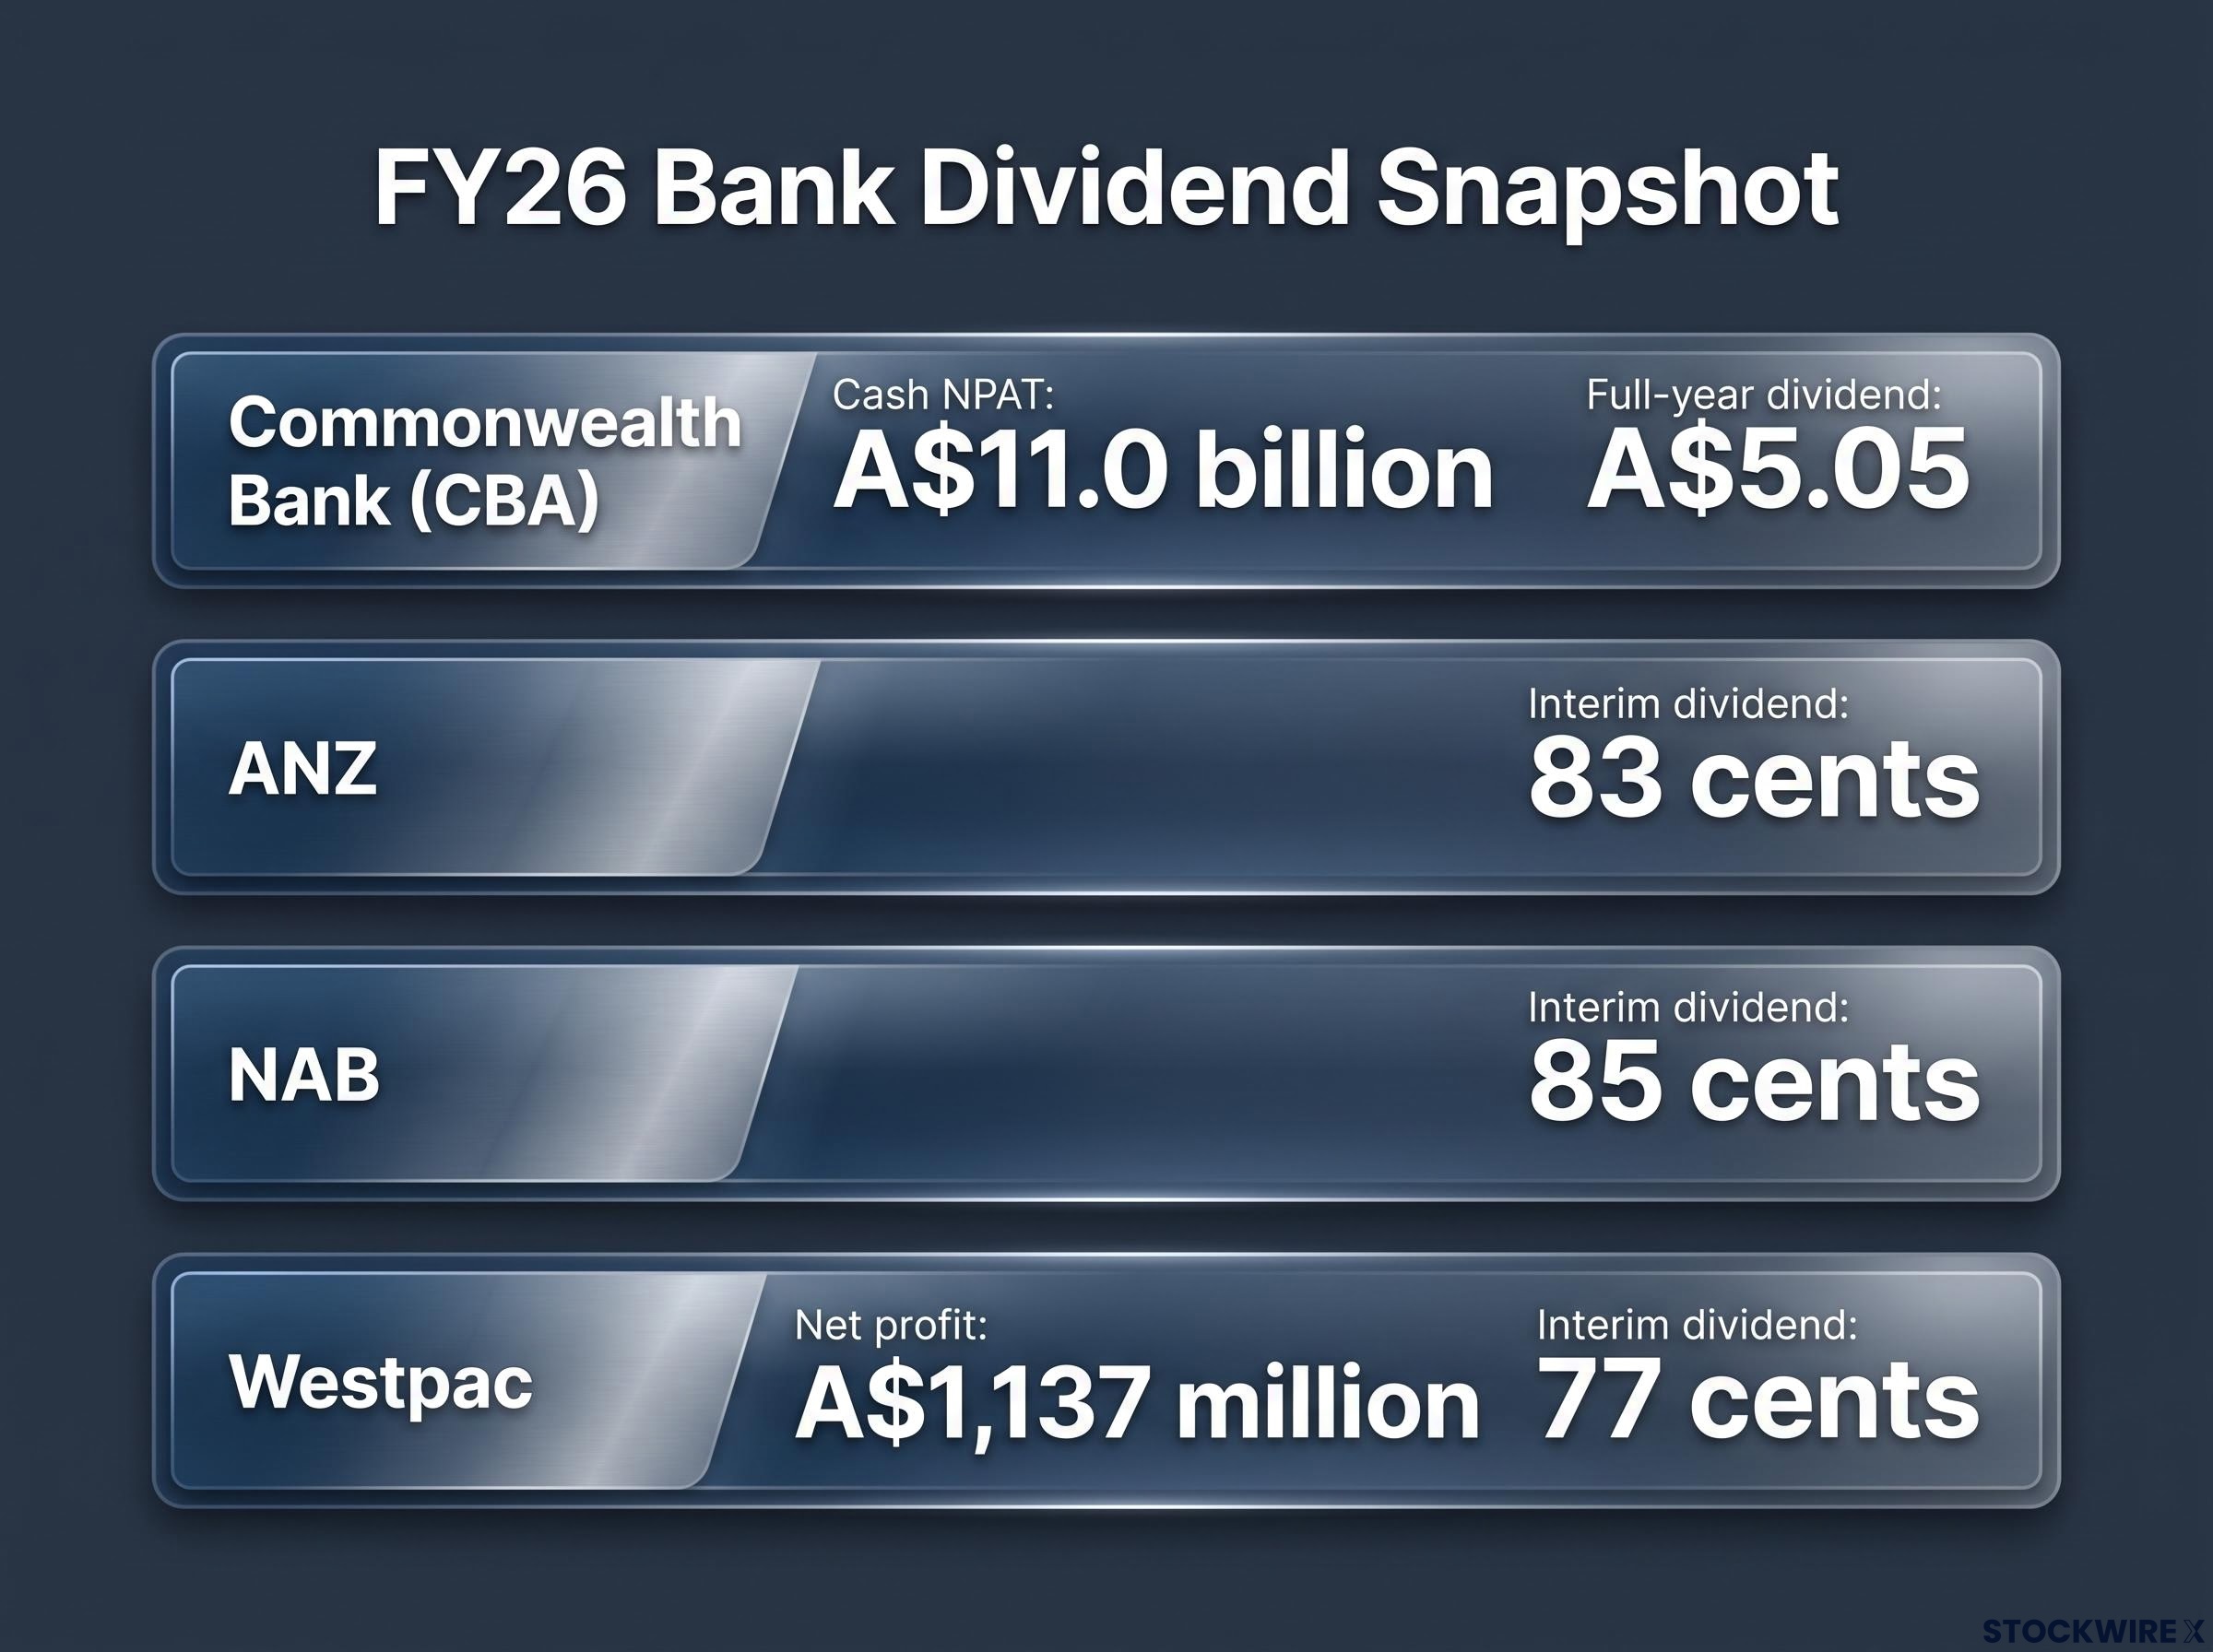
The banks held the income line. Commonwealth Bank reported FY26 cash NPAT of A$11.0 billion, up 7.1%, and declared a fully franked final dividend of A$2.70 per share, taking the full-year payout to A$5.05 (unverified). Half-year and trading updates from the others echoed the theme: ANZ lifted its interim dividend franking to 75% on an 83-cent payout, NAB held its interim dividend at 85 cents, and Westpac declared a 77-cent interim dividend on a 4% lift in net profit to A$1,137 million (all unverified).
Payout discipline and franking levels held, but the provisioning tells a subtler story. NAB booked a A$706 million credit impairment charge, roughly A$300 million of which is linked to forward-looking geopolitical risk rather than any current deterioration in its loan book (unverified). That is precautionary buffer-building, not loan distress.
The variable to watch is policy. Negative gearing uncertainty from the federal budget is the key swing factor for banking credit growth into FY27.
Dividend traps versus sustainable yield: a framework for the current rate environment
Consider Lend Lease. Its core operating businesses performed to guidance, yet the FY26 result carried a statutory loss after tax of A$749 million, driven by A$340 million in non-cash impairments and negative revaluations within its Capital Release Unit (unverified). Research indicates the company cut its total FY26 distribution to 15.7 cents per security from 23 cents in FY25 (unverified), and the share price sagged into the A$2.81 to A$3.04 range afterwards (unverified).
That is how a dividend trap operates. The payout figure is only the surface; the impairments, the leverage, and the capital structure concerns are what the market actually priced.
The lesson generalises into four questions you should ask of any high-yield ASX stock before committing capital.
| Criterion | What to look for (healthy) | Red flag signal |
|---|---|---|
| Payout ratio | Roughly 40% to 70%, leaving room to reinvest | Exceeding 90% to 100%, forcing debt or equity to fund growth |
| Cash flow coverage | Free cash flow around 1.5x the dividend | Dividend funded by trailing metrics, not cash |
| Balance sheet leverage | Modest, manageable debt | High gearing in property, REITs, or retail |
| Yield level | Consistent with sector and history | Double-digit yields pricing an imminent cut |
Treat free cash flow coverage of roughly 1.5x the dividend as the sustainability floor. Below it, the payout is leaning on something other than genuine cash generation.
The rate environment sharpens all of this. Rising bond yields lift funding costs and discount rates, which hits highly leveraged property developers and REIT-style businesses hardest, exactly the businesses most likely to advertise a headline yield.
What the Lend Lease case and the four criteria tell you together is that yield screening in isolation is actively dangerous right now. A yield figure only becomes meaningful once you have assessed leverage and cash flow coverage first. Encouragingly, discipline is holding at the market level: roughly two-thirds of covered ASX companies are projected to raise distributions in FY27, at average payout ratios near 65% (unverified).
What FY26’s divergences mean for how you position in FY27
Three investor positions emerge from the season, and most readers will recognise themselves in at least one.
The first is rotation. With a risk-free bond paying more than the average equity income basket, fixed income has re-entered the conversation as a genuine competitor for the income sleeve of a portfolio.
The second is selective equity exposure. Healthcare’s recovery rests on structural demand tailwinds, plasma products, immunoglobulins, and imaging software, which supports a durable thesis rather than a one-cycle bounce.
The third is defence. Running existing income holdings through the four-criterion framework is how you find the Lend Lease-style risks already sitting in your portfolio.
The FY26 lesson is not “avoid dividends.” ASX 200 dividend growth is still projected at around 4% for FY27, a constructive base case. The lesson is that dividend quality now matters more than dividend size, and the bond yield environment is the mechanism enforcing that distinction.
The S&P/ASX 200 Dividend Points Index tracks aggregate dividend distributions across ASX 200 constituents annually, giving investors a market-wide reference point for assessing whether the projected 4% FY27 dividend growth figure sits inside or outside the historical trend.
Three variables will decide whether the August patterns extend or reverse:
- RBA rate trajectory: any further move in the 10-year yield above 5% tightens the equity risk premium again
- Commodity prices: the swing factor for the uneven resources sector into FY27
- Credit growth dynamics: negative gearing policy will shape bank lending and, by extension, bank dividends
This shift from “any dividend” to “quality dividend” is not a temporary adjustment to a high-rate moment. It is a durable recalibration that will persist for as long as risk-free assets pay more than the average equity income basket. Investors who have not yet made the shift are carrying more risk than their income statements reveal.
Recalibrating for a market where quality beats yield size
The FY26 August season confirmed a structural change in what income investing on the ASX now requires. Balance sheet assessment comes before yield screening. Sector awareness of where valuations are recovering matters as much as the headline result. And the bond yield sits behind every equity valuation as a constant reference point.
When a government bond pays more than the average dividend basket, size stops being the question. Quality is.
Here is the specific action worth taking before the next reporting season in February 2027: run your income portfolio through the four-criterion framework, and pay particular attention to any holding with a yield above 8% or a payout ratio above 80%. Applying that screen is not conservatism. It is the basic analytical work the current rate environment now demands from every income-oriented ASX investor.
Portfolio construction for income durability requires spanning at least three sector buckets to avoid the concentration risk that sorting by headline yield alone produces, a discipline that becomes more consequential when rising bond yields are simultaneously de-rating leveraged property and REIT names.
This article is for informational purposes only and should not be considered financial advice. Investors should conduct their own research and consult with financial professionals before making investment decisions. Past performance does not guarantee future results, and financial projections are subject to market conditions and various risk factors.