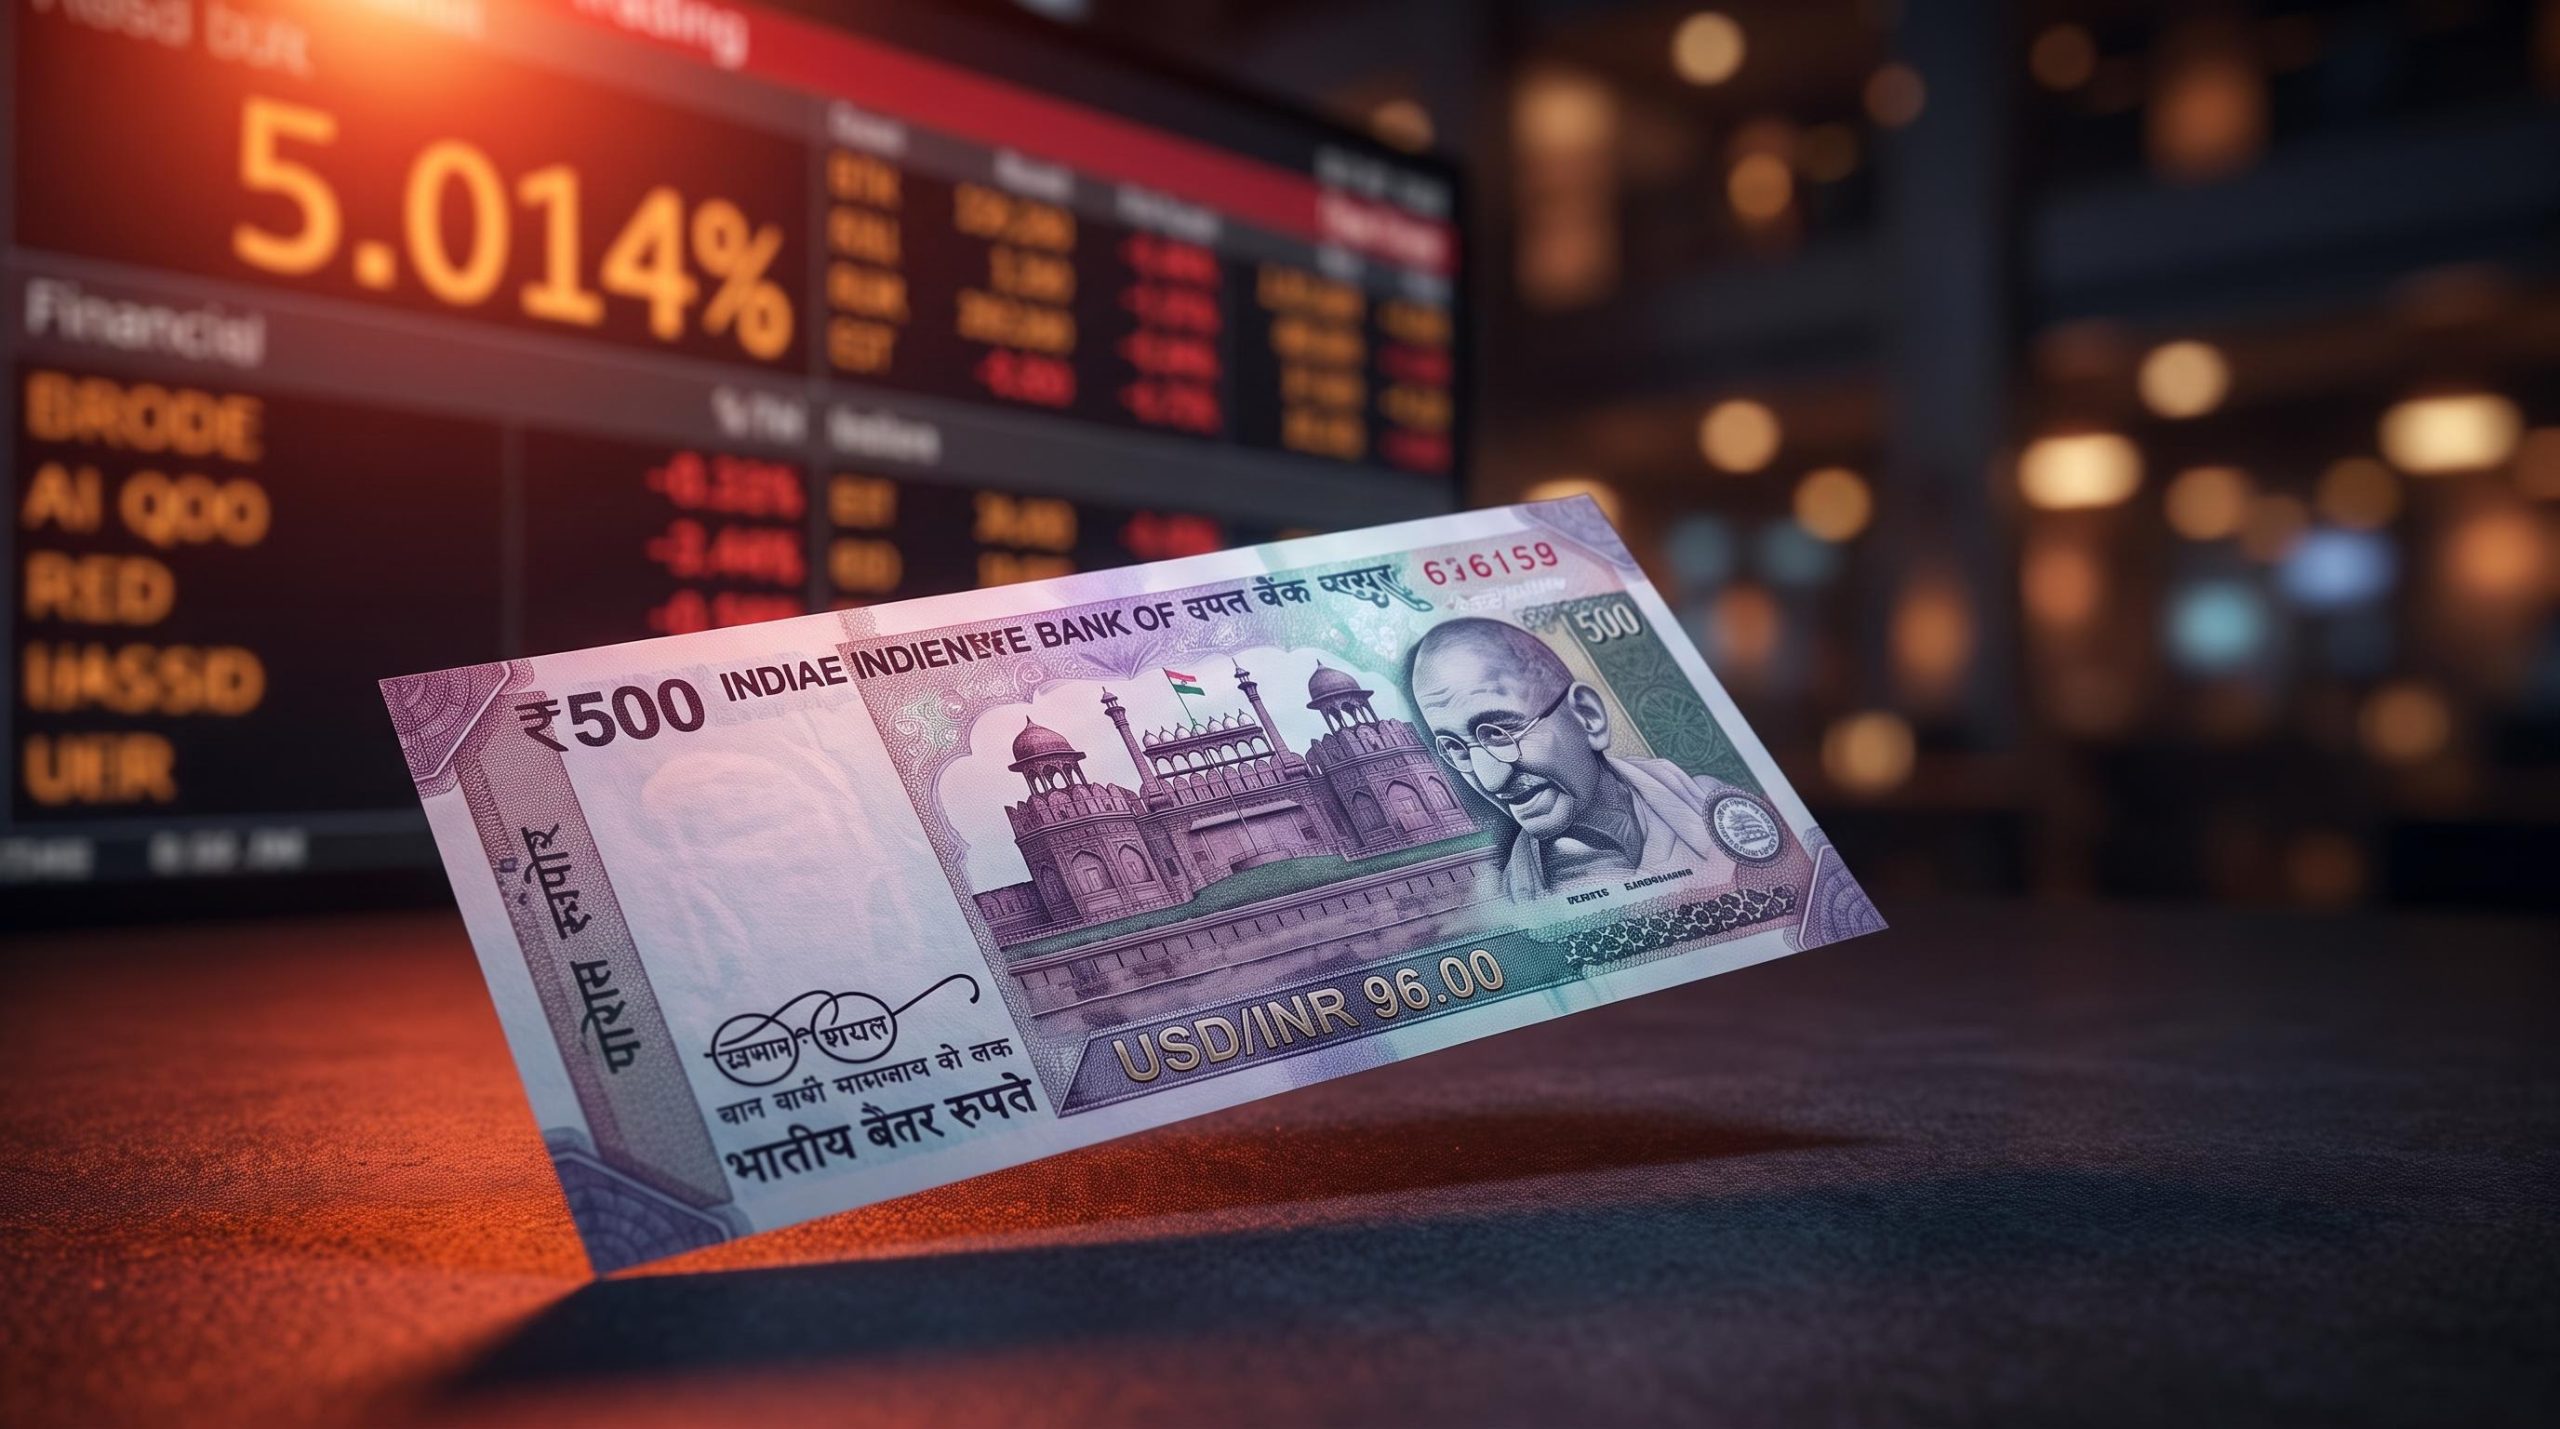
The Reserve Bank of India sold an estimated USD 8-15 billion in a single week in early September 2026 to defend the rupee. The currency still ended that week near a seven-week low.
That gap between the firepower deployed and the result achieved is the story of the rupee right now. It also frames the sharper question behind any Indian Rupee outlook: what happens when a central bank with deep reserves and clear intent runs into forces it cannot permanently suppress?
Three pressures are converging at once. U.S. 10-year Treasury yields crossed 5% for the first time since October 2023, India’s headline consumer price inflation breached the RBI’s 4% median target in June 2026 for the first time in 17 months, and the country’s structural dependence on imported crude keeps dollar demand permanently elevated. None of these is a passing squall.
What follows sorts them by weight. This diagnostic identifies which of the three forces is doing the most damage to the rupee today, where the RBI’s options actually run out, and the specific signals worth watching across the next two Monetary Policy Committee meetings.
Why the dollar is winning the tug of war with the rupee right now
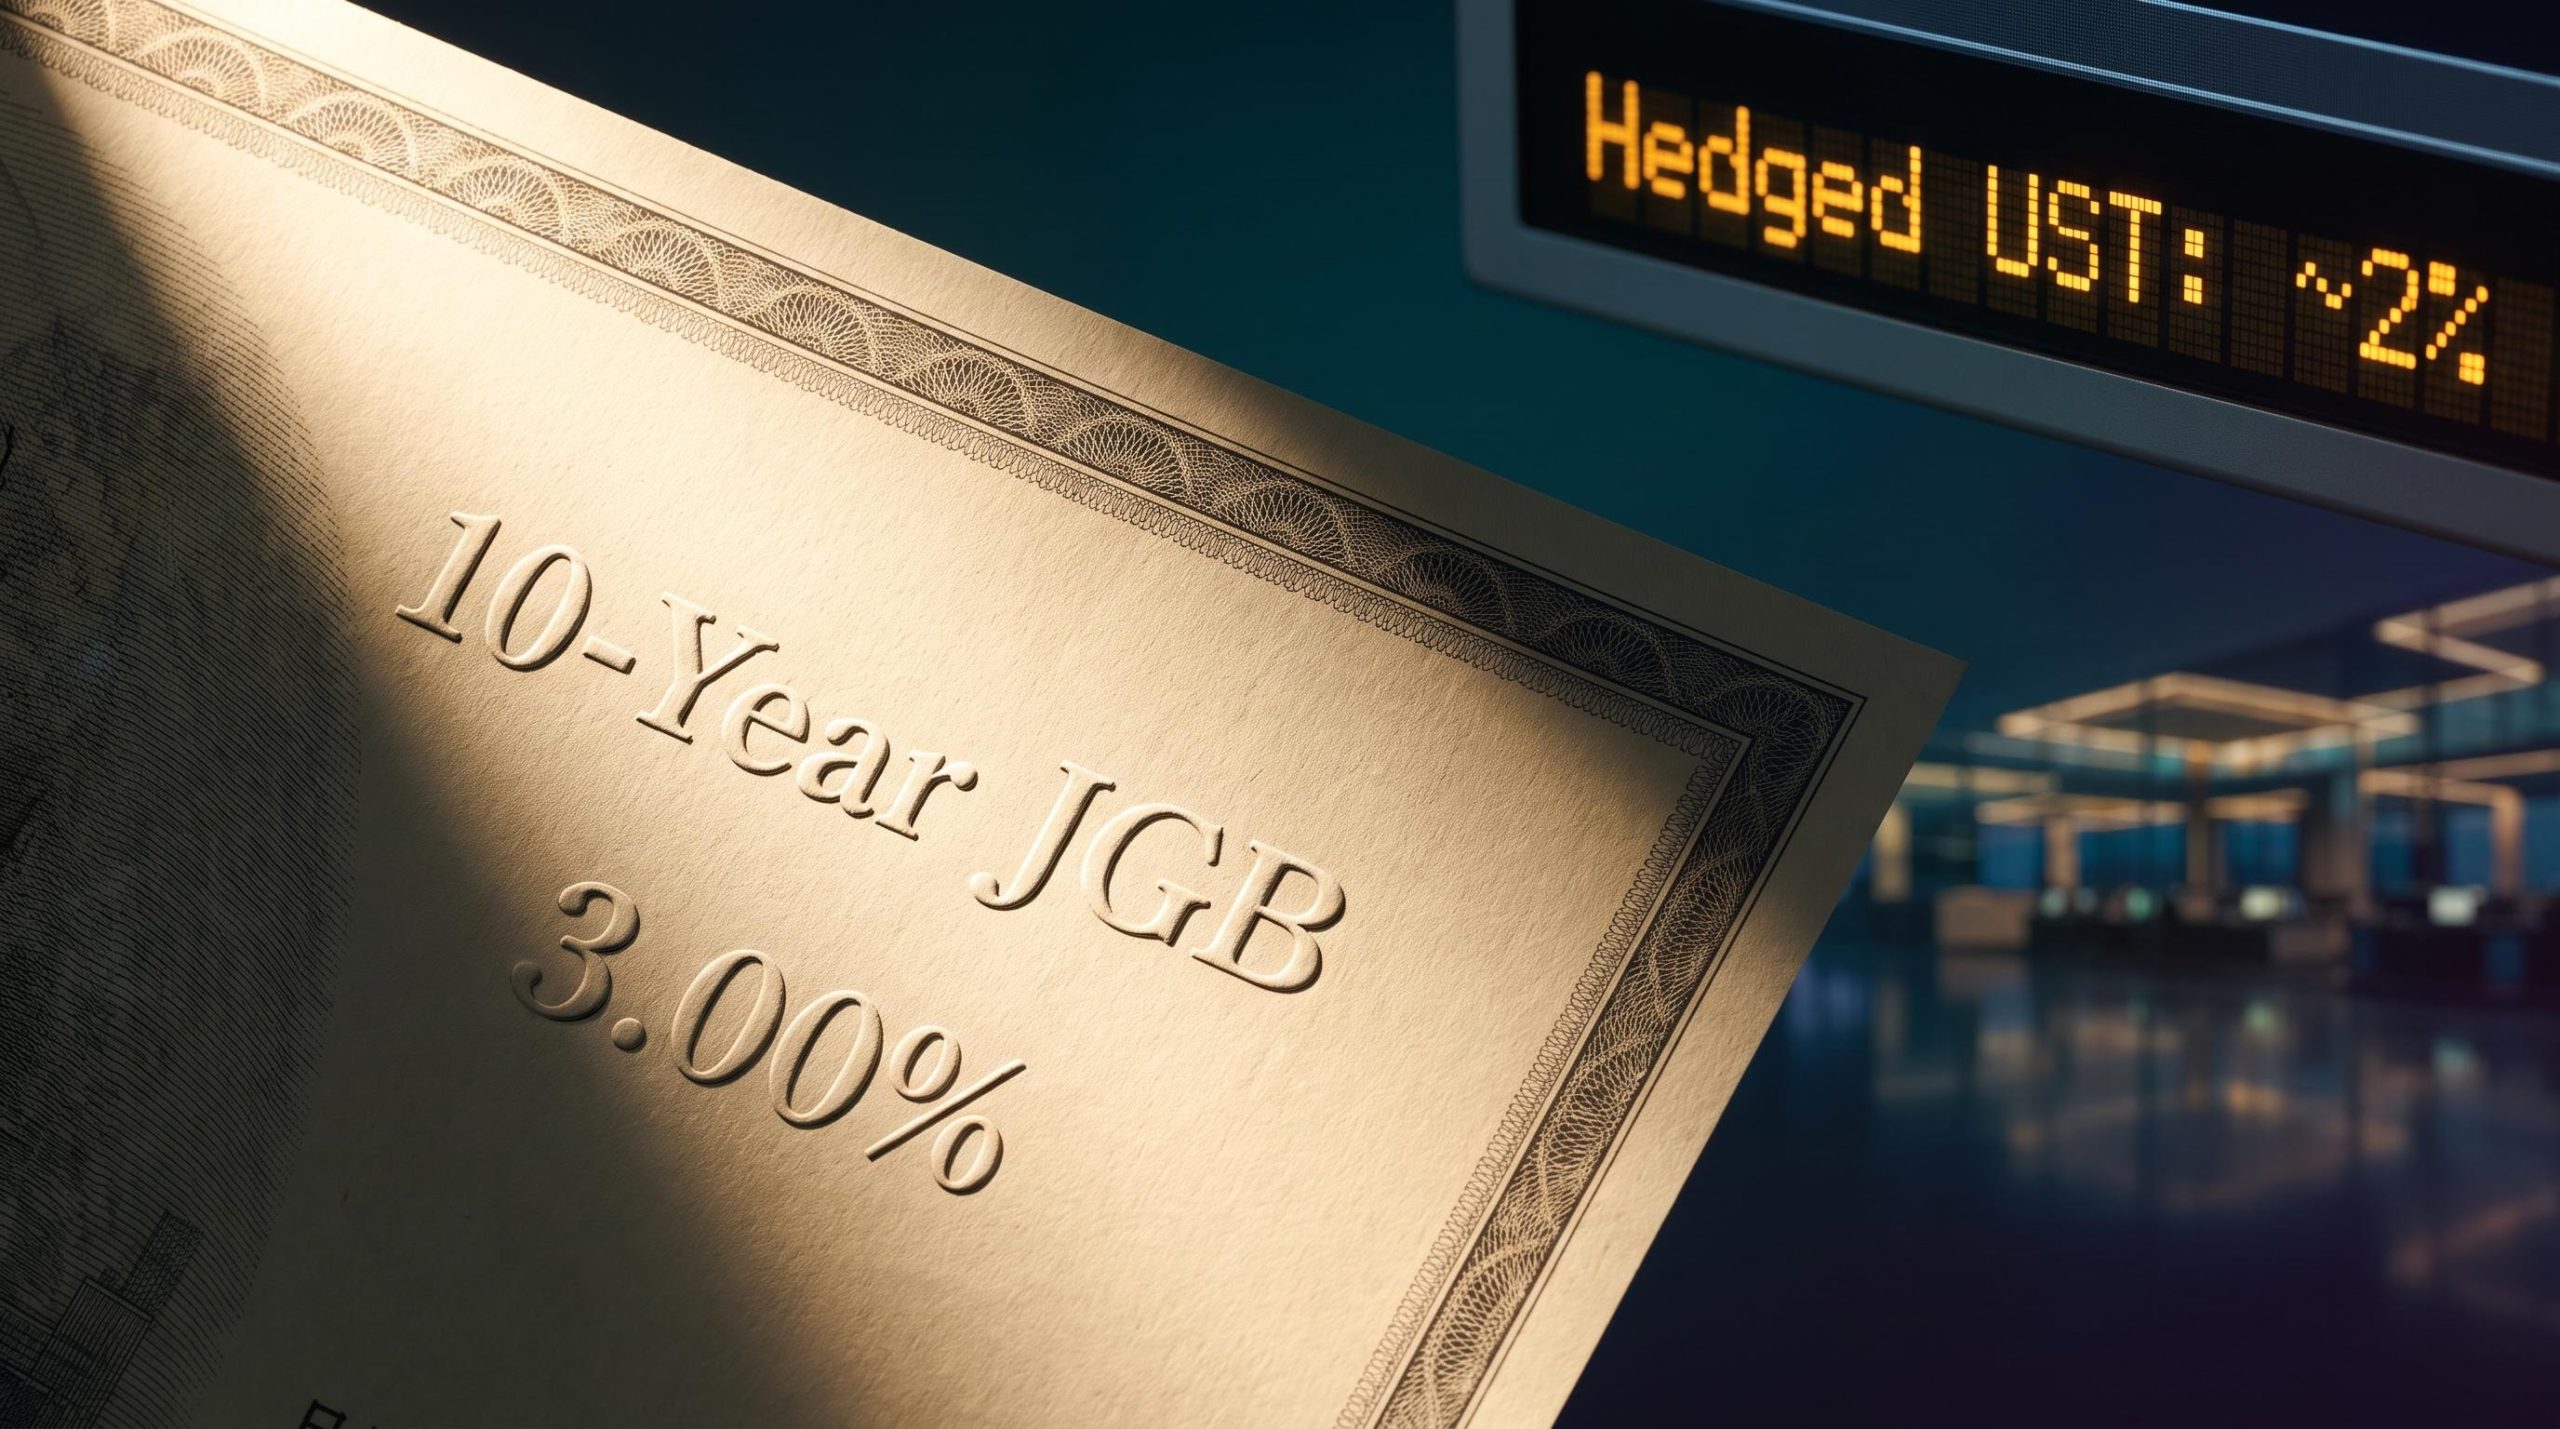
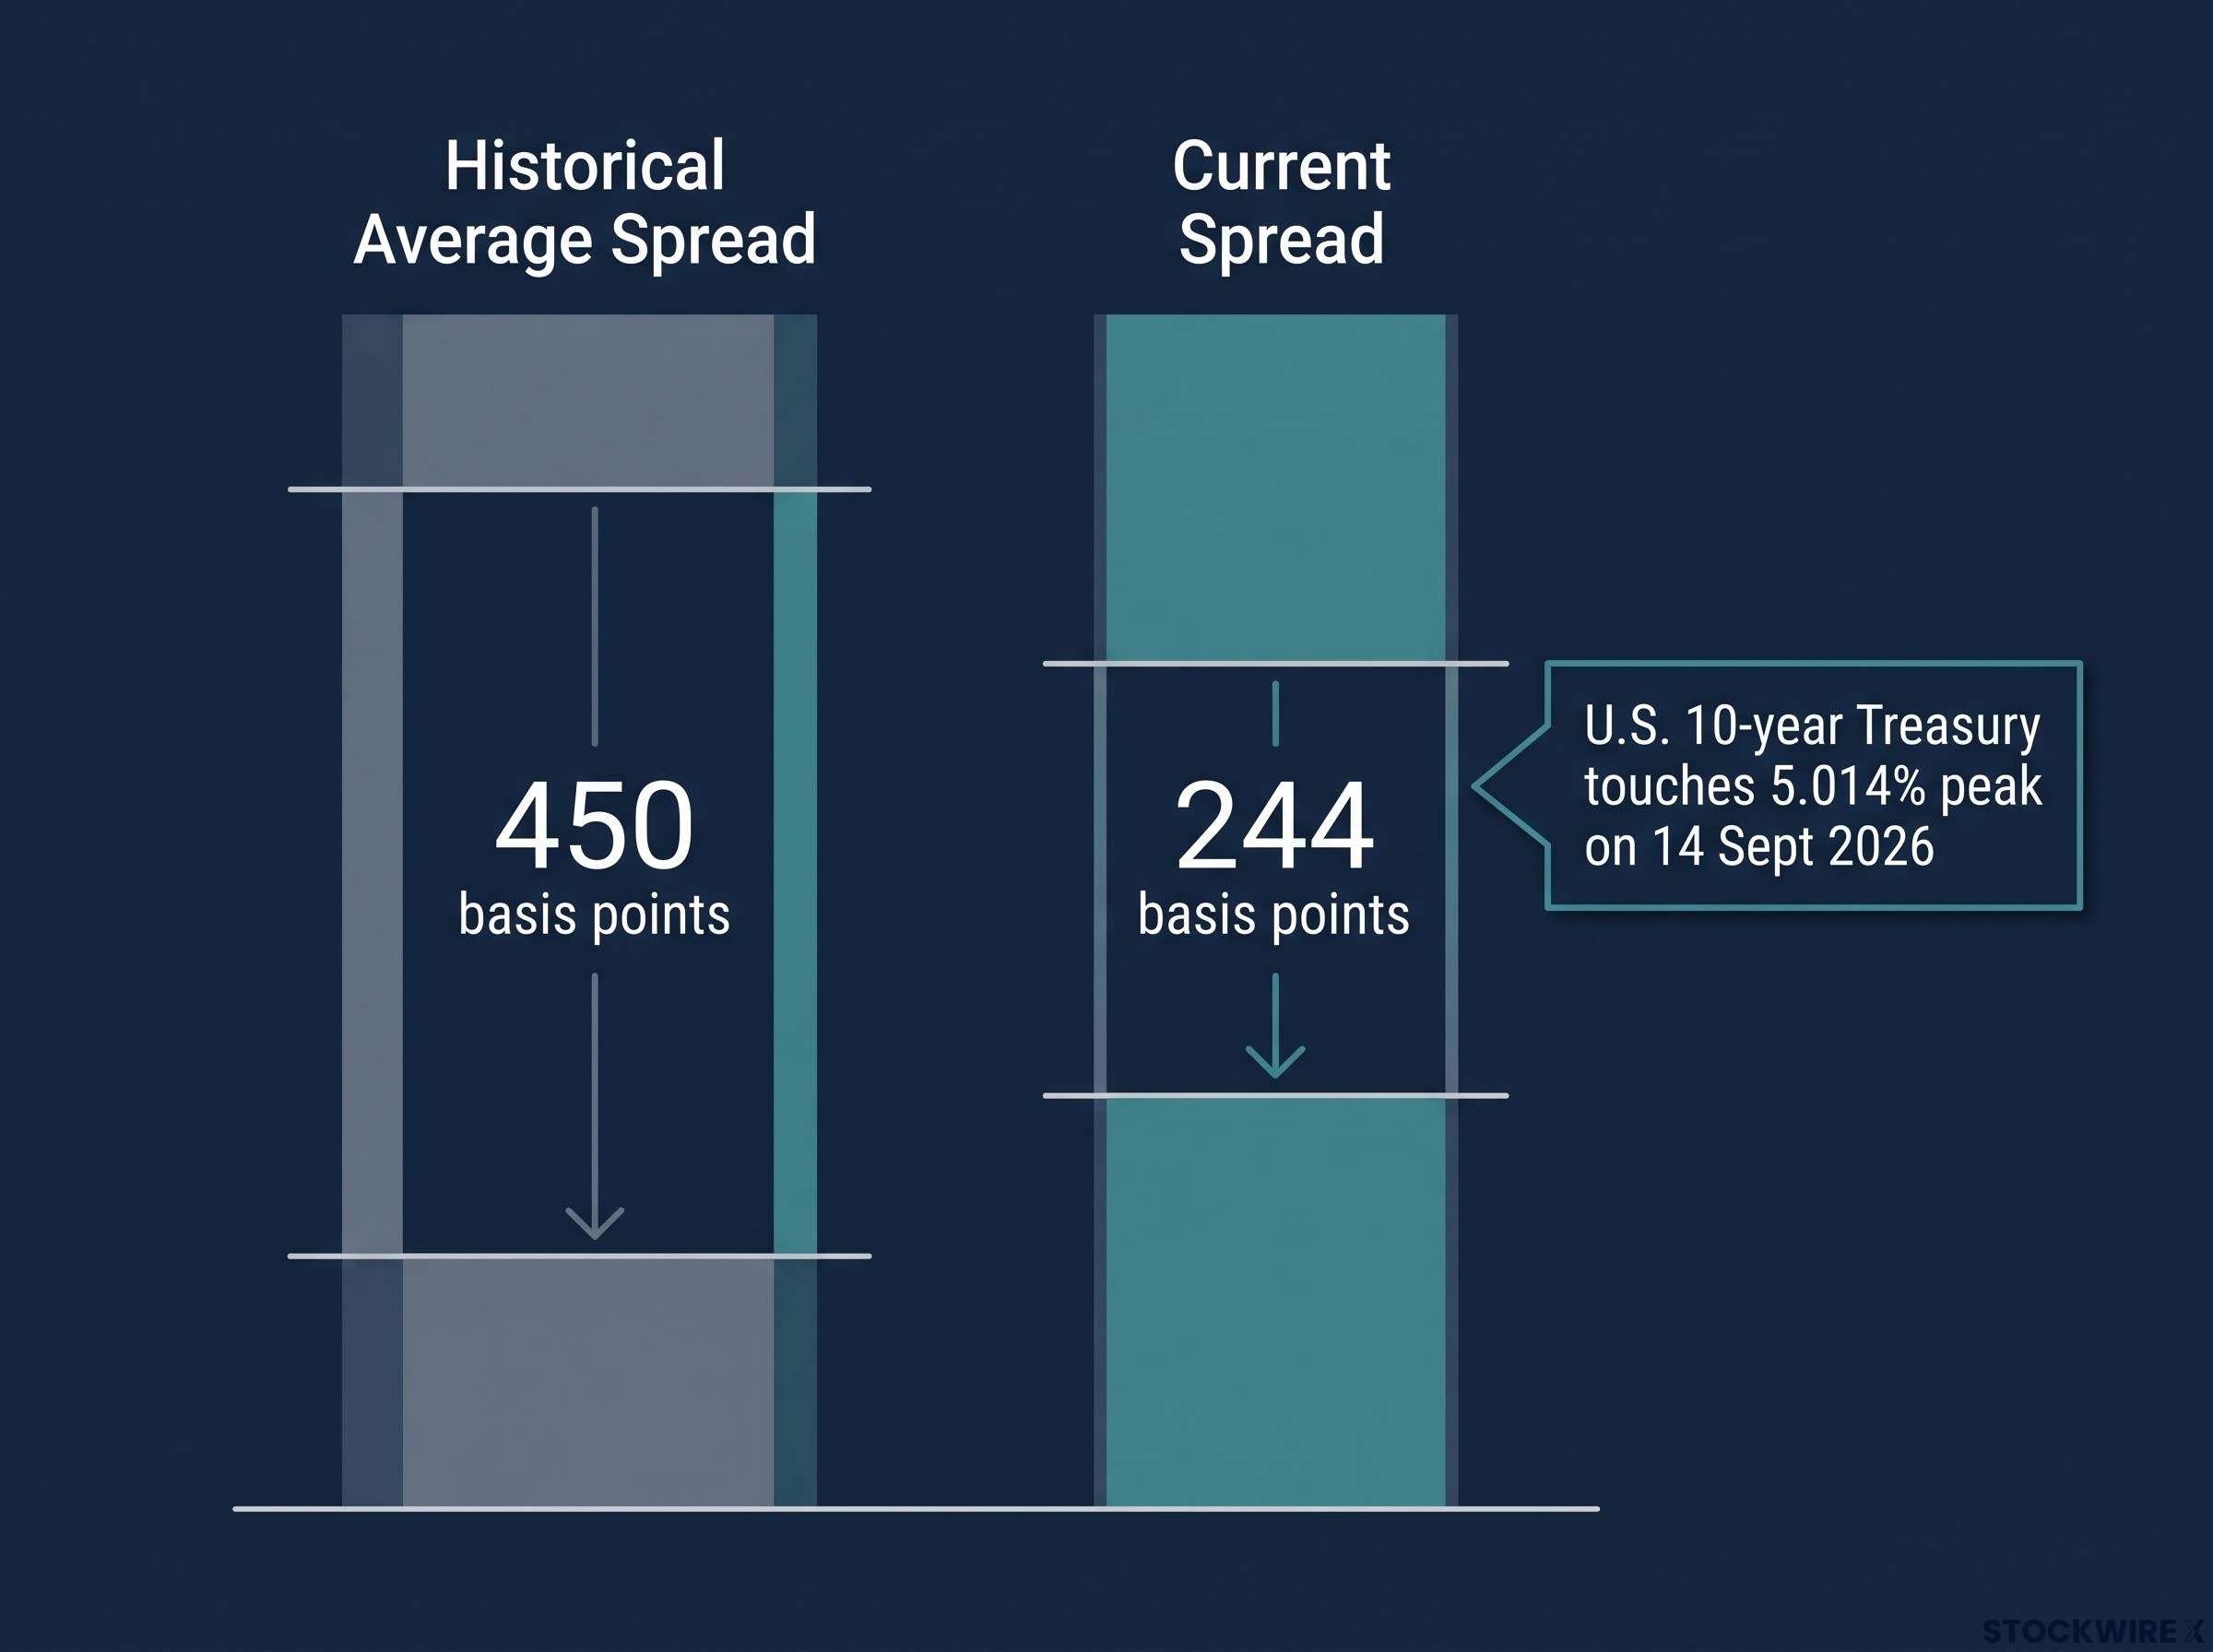
Start with the proximate trigger. On 14 September 2026, the U.S. 10-year Treasury yield touched an intraday peak of 5.014%, and by 15 September 2026 it was holding at 5.00-5.01%, its highest level since October 2023, according to CNBC, Morningstar and Bloomberg. Within days, USD/INR had slid to around 95.977-96.027, a seven-week low sitting near the top of a 94.4-96.0 trading band that has held for the past month and a half.
The mechanism connecting those two moves runs through the yield differential. The gap between India’s 10-year government bond and the U.S. 10-year Treasury has compressed to roughly 244 basis points, well below a historical average of around 450 basis points, according to figures cited by Moneycontrol that have not been independently verified.
Here is what that compression tells you. The mathematical case for holding Indian debt over U.S. Treasuries has weakened to about half its usual strength, and that is what portfolio outflows look like before they show up in the exchange rate itself.
The mechanism behind that compression matters as much as the number itself: BNP Paribas Asset Management characterises the current move as bearish steepening, where the long end rises faster than the short end, a dynamic that BIS research links directly to yield spread compression transmitting into emerging-market bond yields and bank credit within three months.
The pressure arrives through three channels at once:
- Yield differential compression: narrower spreads reduce the reward for holding Indian bonds, cooling foreign inflows.
- Risk-off portfolio reallocation: spiking U.S. yields push global investors to sell emerging-market assets, including Indian equities and bonds, and rotate into safer Treasuries.
- Carry trade unwind: a thinner spread erodes the appeal of borrowing in dollars to hold higher-yielding Indian debt, prompting positions to be closed and dollars to be bought back.
Each channel forces the same trade: sell rupees, buy dollars. That is the double bind. Rising U.S. yields pull capital out of Indian markets while simultaneously strengthening the dollar, squeezing USD/INR from both sides of the pair at the same time. The dollar is not winning by a narrow margin here. It is winning because the rupee is being pressured through several doors simultaneously.
What the technical setup is signalling
The chart agrees with the macro read. USD/INR is trading above its 20-day exponential moving average at approximately 95.37, with buyers back in control after a recent pullback, according to FXStreet’s technical analysis.
The momentum read The Relative Strength Index, a momentum gauge that runs from 0 to 100, registered 63.2, per FXStreet. That places the pair firmly in bullish territory without yet being overbought, with the next upside target at the all-time high near 97.00.
FXStreet has disclosed that its technical work was produced with AI tool assistance. Treat the path toward 97 as contingent rather than fixed: it holds only while the macro drivers behind it stay in place.
When big ASX news breaks, our subscribers know first
India’s structural exposure: why the rupee starts every global shock already on the back foot
Currencies do not respond to shocks from a neutral starting line. The rupee begins most dollar-strength episodes already disadvantaged, and the reason sits in a single import.
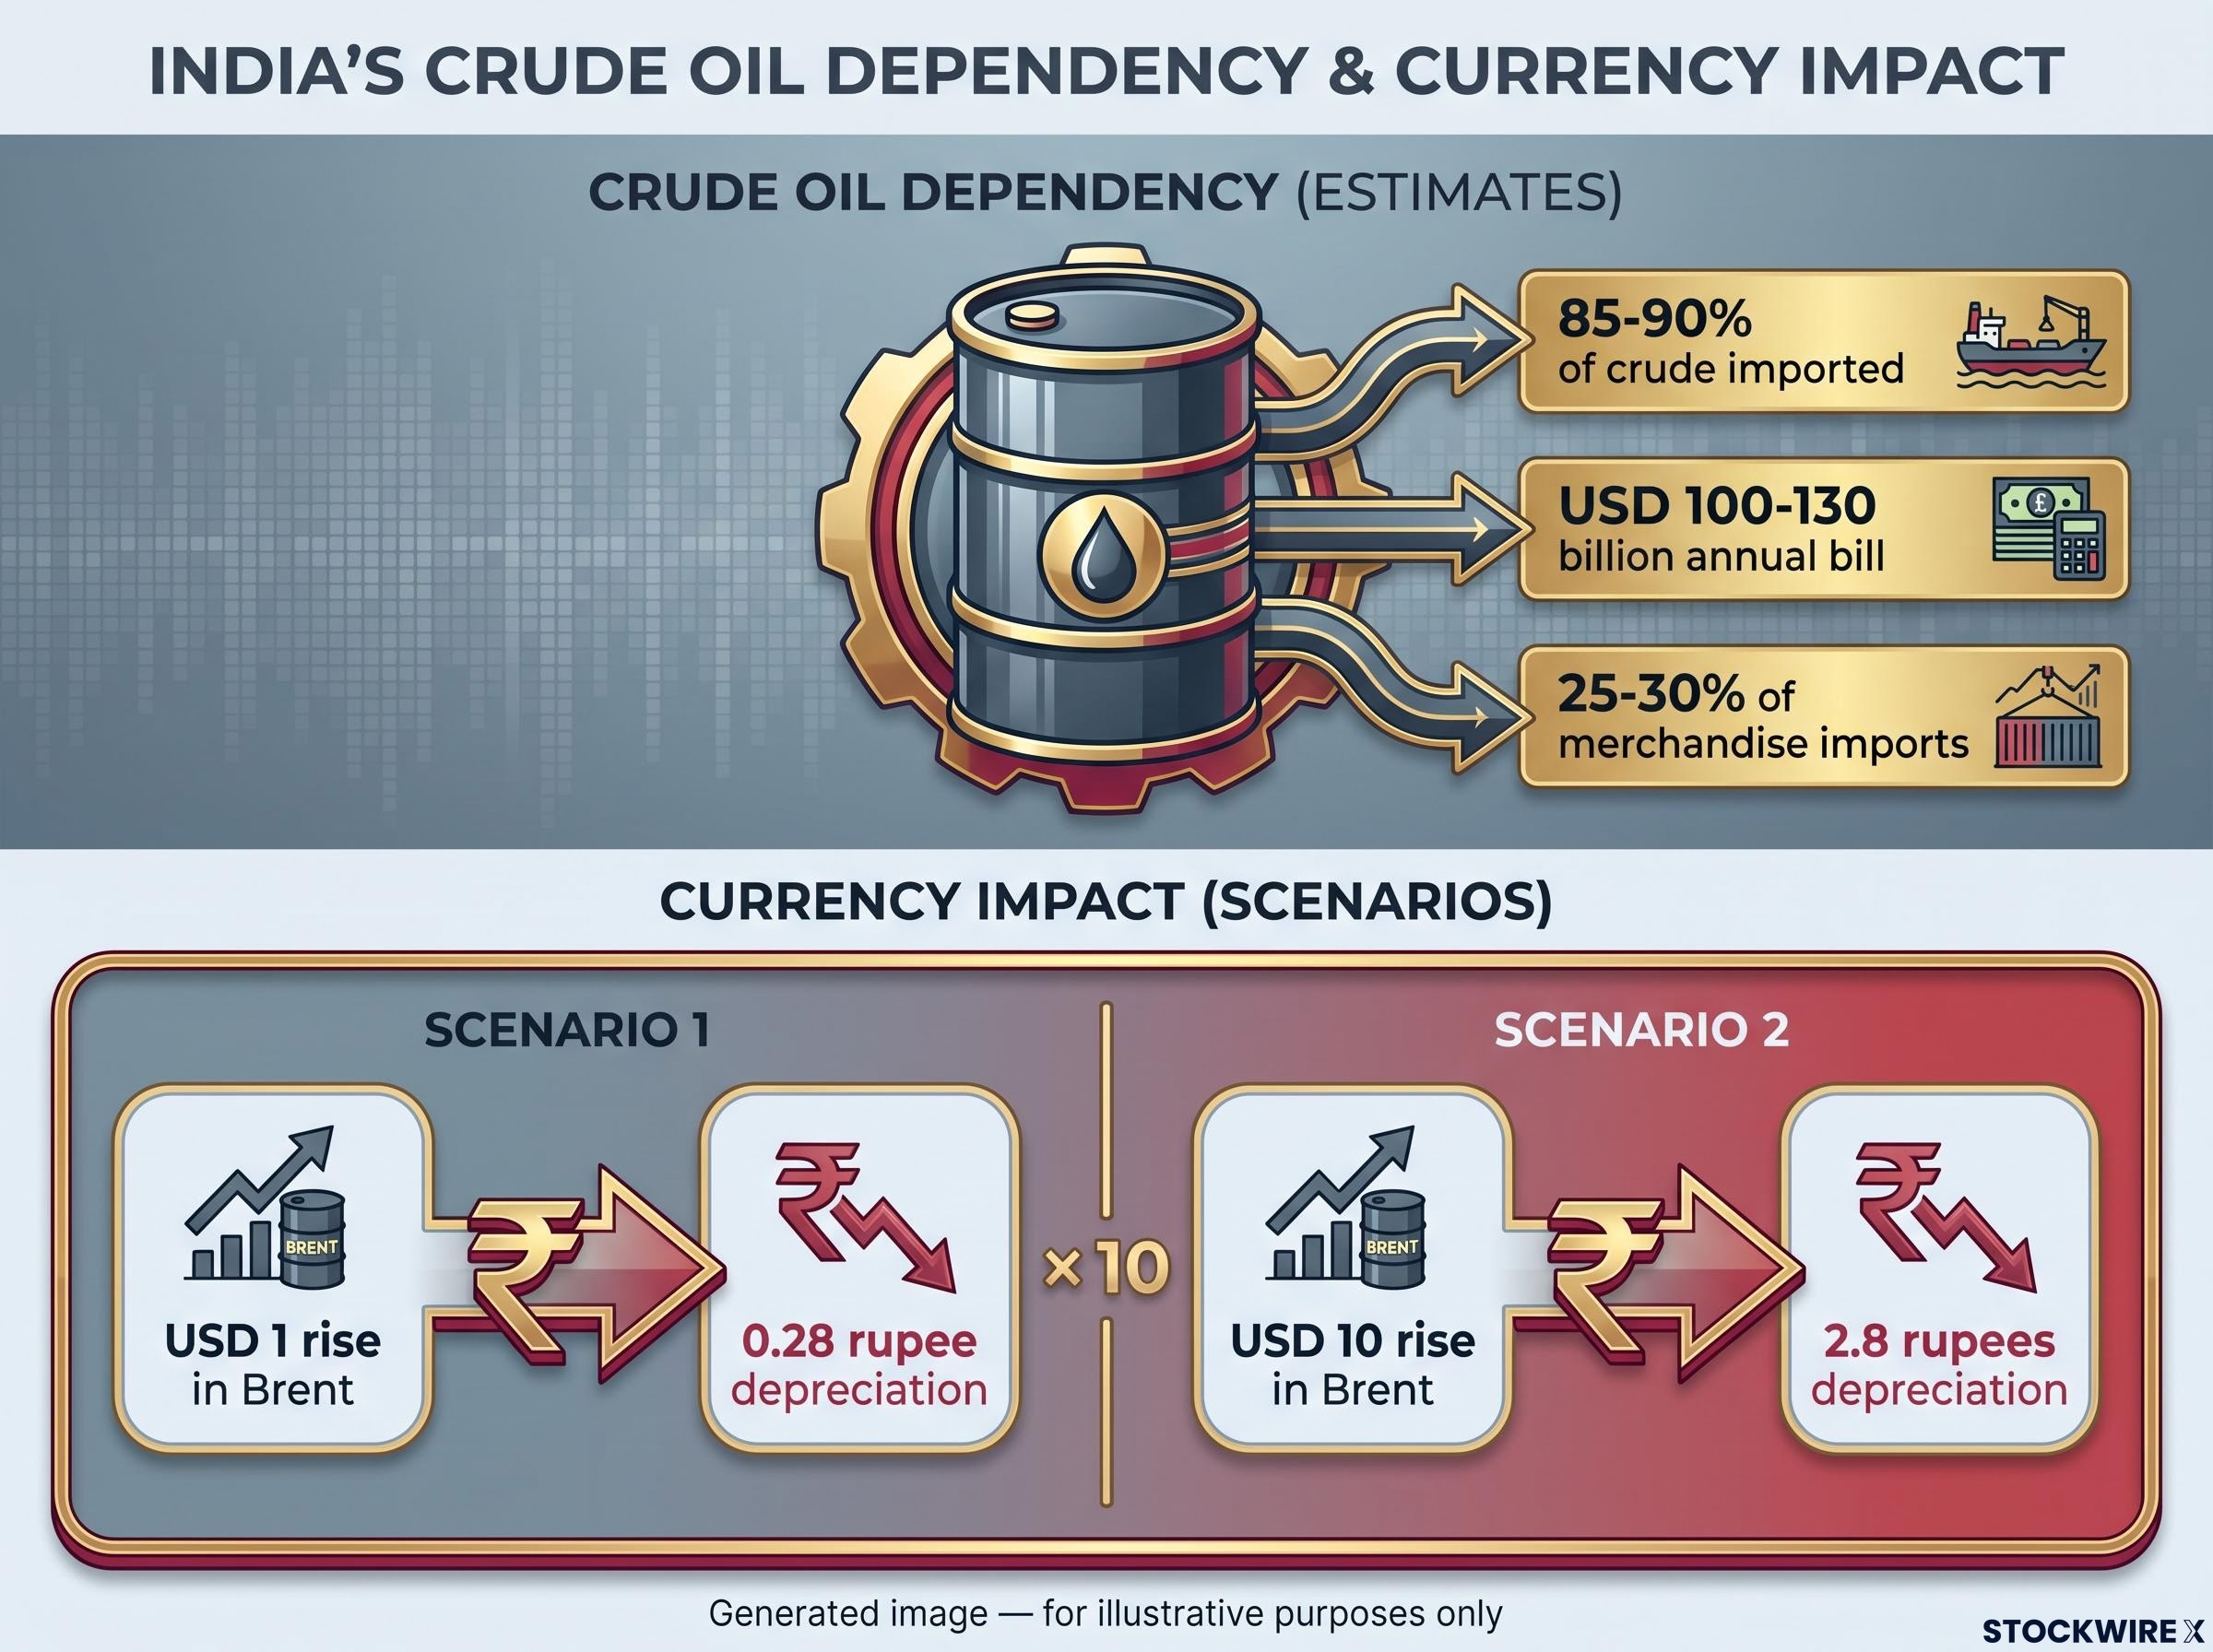
India buys roughly 85-90% of its crude oil from abroad, making it the third-largest crude importer globally, according to research from the International Journal of Research and Analytical Reviews (IJRPR) and Canara Bank. That bill runs to an estimated USD 100-130 billion a year and accounts for around 25-30% of total merchandise imports. It is the single largest source of structural dollar demand in the economy, and it does not switch off.
The bigger problem is how that demand interacts with dollar strength. Oil is invoiced in dollars, so a stronger dollar raises the rupee cost of a barrel even when the dollar price of that barrel has not moved. Importers pay more in local currency for the same physical crude, widening the current account gap and deepening imported inflation at the same moment.
That is the double hit, and both prongs are active right now. U.S. yields are elevated, keeping the dollar bid, while Brent prices remain significant enough to keep the import bill heavy.
The number to hold onto IJRPR research estimates that every USD 1 rise in Brent crude translates into roughly 0.28 rupee of depreciation, independent of Fed or RBI action.
That figure is not academic. A USD 10 move higher in Brent means about 2.8 rupees of downward pressure on the currency before anyone in Washington or Mumbai does anything at all. It also works in reverse: a roughly 15% crude price pullback in late July 2026 was a meaningful contributor to the rupee’s rebound from near-record lows. The same sensitivity that punishes the currency on the way up rewards it on the way down.
The table below sorts the forces currently acting on the rupee and how hard each is pushing.
| Driver | Mechanism | Current intensity | Directional impact on INR |
|---|---|---|---|
| U.S. yield spike | Compresses yield spread, pulls capital toward Treasuries | High | Weakening |
| Crude oil import bill | Structural dollar demand from oil purchases | High | Weakening |
| USD trade denomination | Stronger dollar raises local-currency import cost | Medium to high | Weakening |
| Portfolio outflow risk | Foreign investors rotate out of Indian assets | Medium | Weakening |
This is why the rupee consistently lags emerging-market peers when both U.S. yields and oil are high. Any outlook that leaves out the energy import channel is missing a structural driver as powerful as anything the Fed does.
From prolonged hold to hiking risk: how India’s inflation shift changes the RBI’s calculus
The policy story looked settled at the start of the year. A Reuters economists’ poll published on 29 January 2026 found that 59 of 70 respondents expected the repo rate to hold at 5.25% through the whole of 2026, with no change at the February MPC meeting or after it. Rate cuts were off the table, and so, apparently, were hikes.
Then the inflation data began to climb. The following table tracks that shift alongside the policy expectation that dominated at each point.
| Month (2026) | Headline CPI (y/y) | Dominant policy expectation |
|---|---|---|
| January | 2.75% | Prolonged hold at 5.25% |
| February | 3.21% | Prolonged hold at 5.25% |
| April | 3.48% | Hold, watching inflation |
| May | 3.93% | Hold, inflation nearing target |
| June | 4.38% | Rising risk of hiking cycle |
June was the pivot. CPI hit 4.38% year-on-year, the first breach of the RBI’s 4% median target in 17 months, according to MoSPI data released on 13 July 2026. At its June MPC meeting the RBI held the repo rate but lifted its 2026-27 inflation projection to 5.1%, a signal that the central bank saw the pressure building.
India’s inflation outlook carries an additional risk the monthly CPI prints alone do not capture: a 15% southwest monsoon deficit through early September 2026 points to 250-300 basis points of added food inflation concentrated in perishables where grain buffer stocks provide no protection, and frozen retail fuel prices have queued rather than cancelled a further energy shock.
One data point deserves a caveat. The original Societe Generale analysis references three consecutive months above target, while research sources identify June as the first breach in 17 months. The discrepancy likely reflects different publication timing or reference metrics, and readers should treat the exact count as unsettled.
Against that backdrop, Societe Generale has projected an actual tightening cycle. Its forecast path runs as follows:
- 25 basis points at the October MPC meeting.
- 25 basis points at the December meeting.
- 25 basis points at the February meeting.
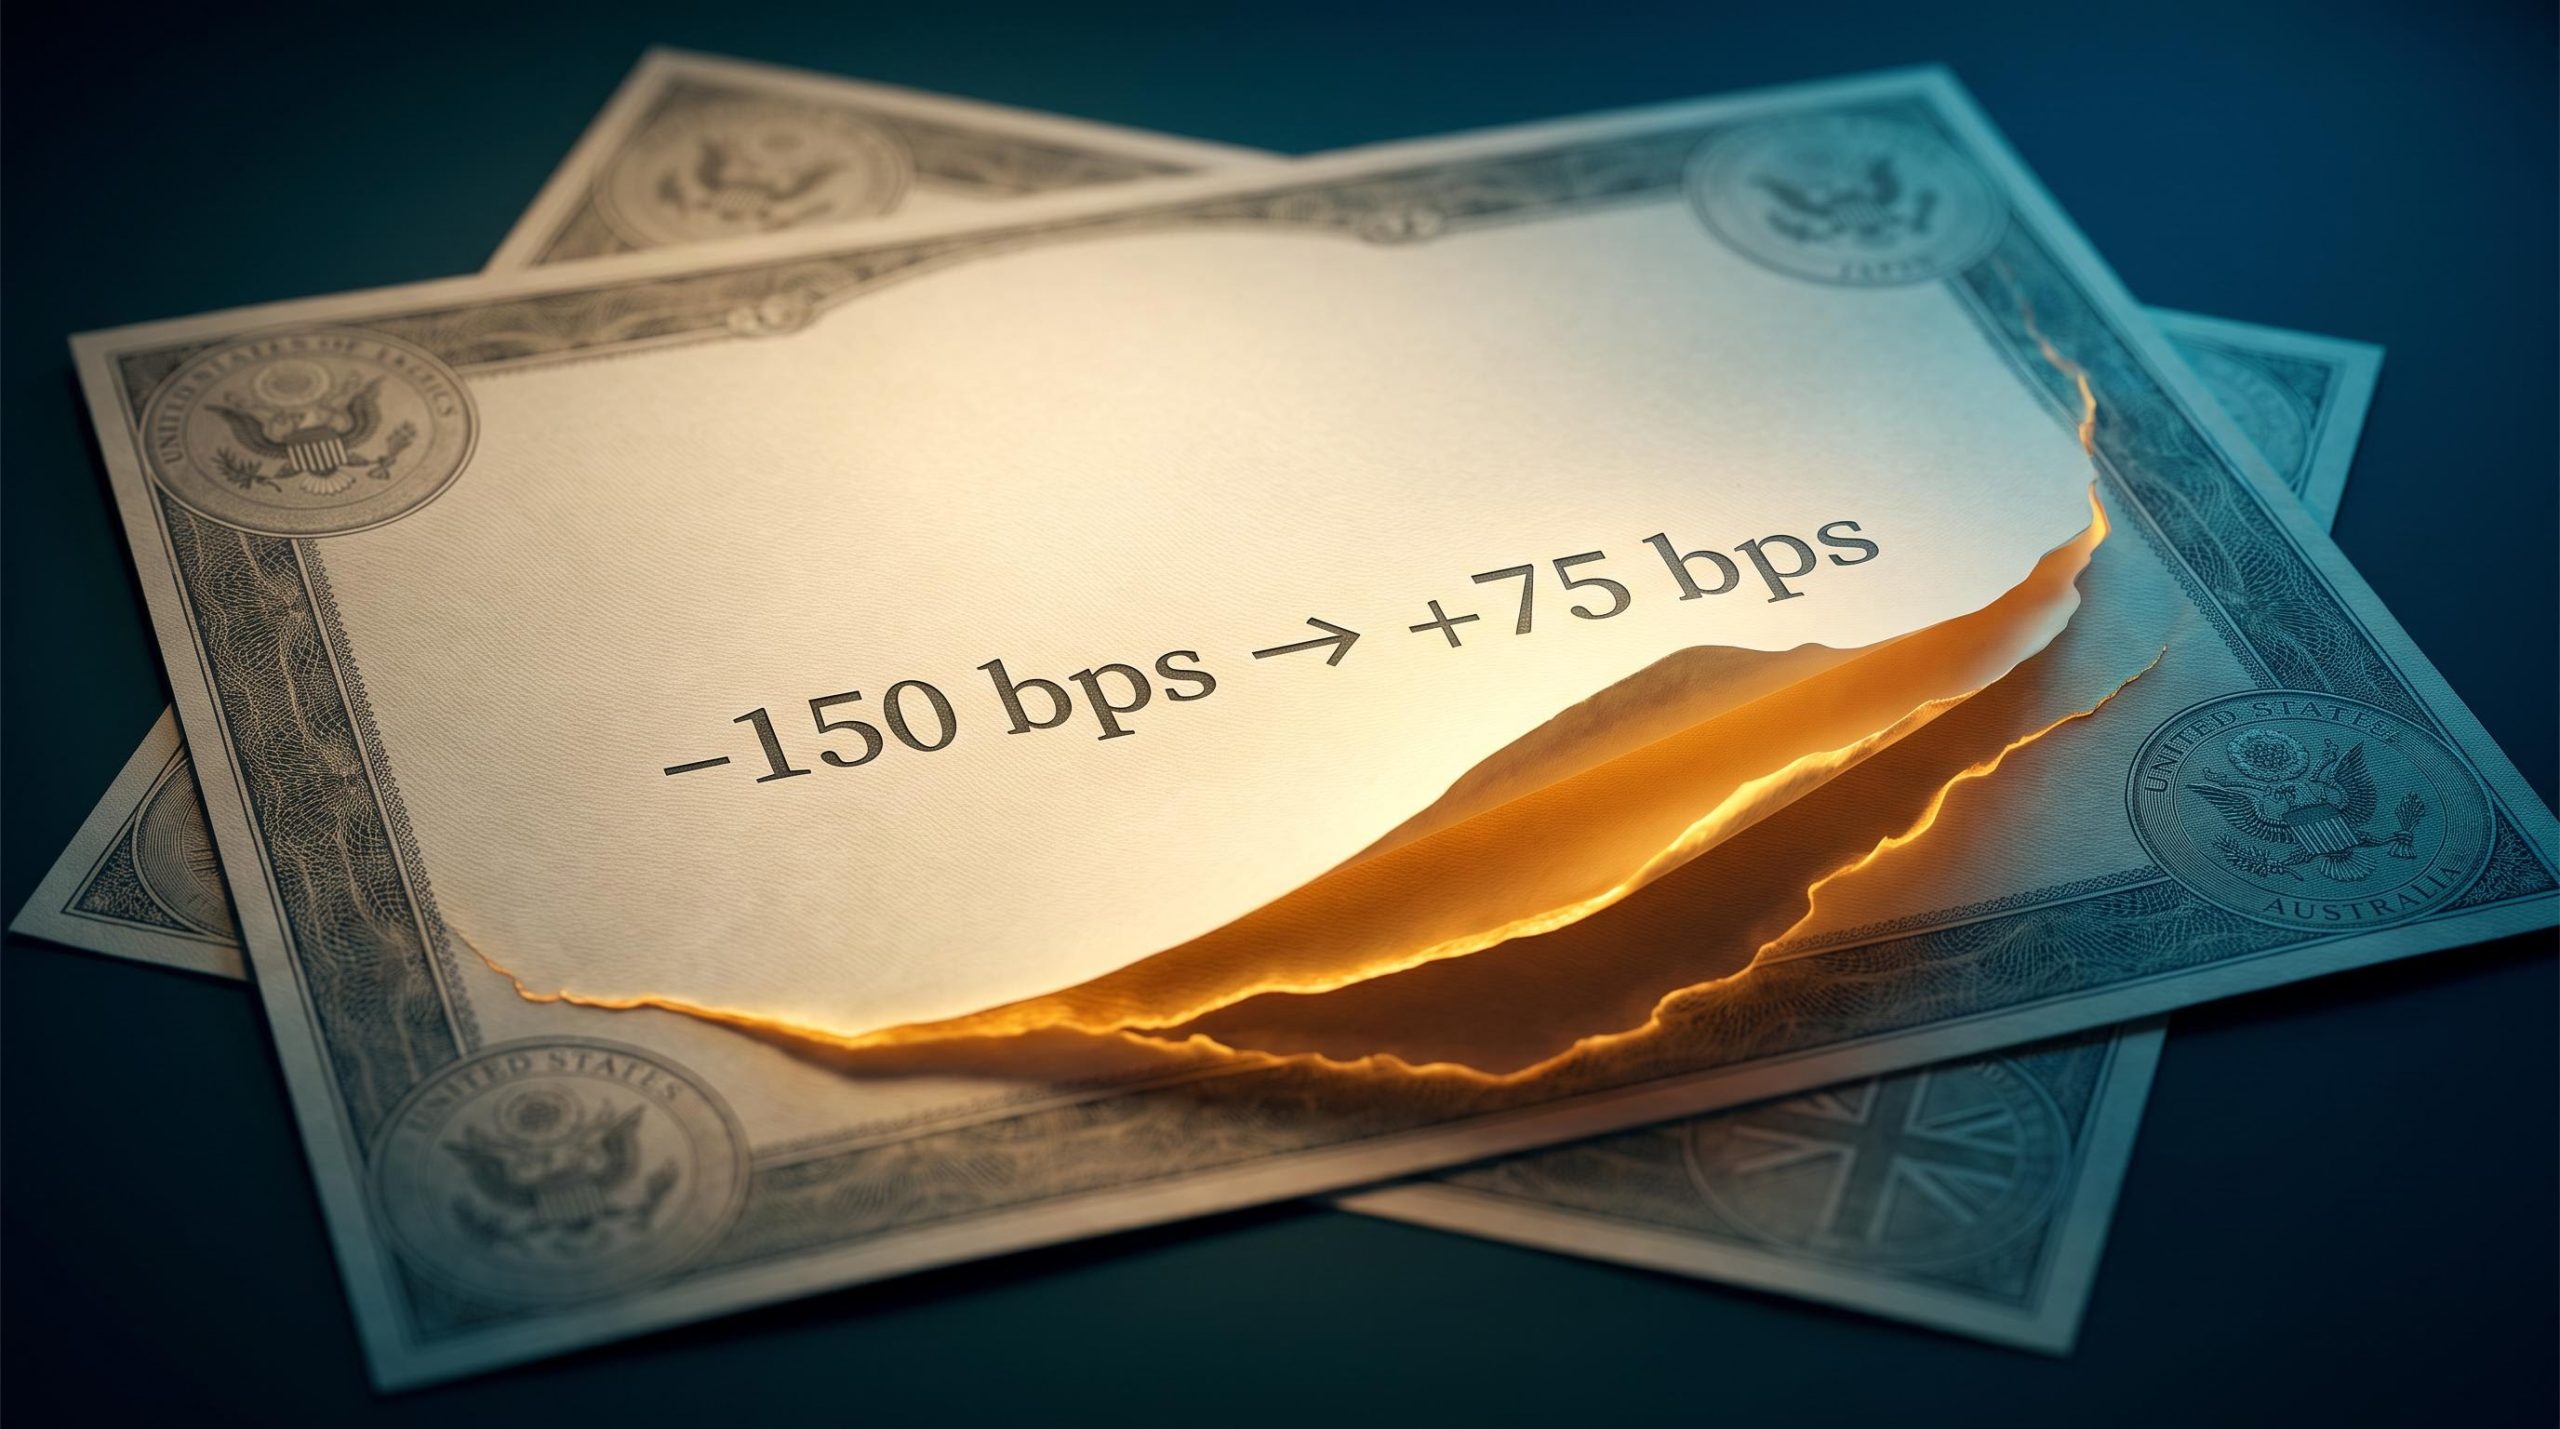
The projection, with its caveat Societe Generale sees 75 basis points of tightening across three meetings, and does not exclude a sharper 50 basis point move if inflation deteriorates further, according to the forecast attributed via FXStreet. This projection has not been independently corroborated, and broader consensus remains more cautious.
A move from 5.25% to 6.00% over three meetings would be a meaningful tightening cycle by India’s own history. If it lands, the rupee faces two forces pulling in opposite directions: higher rates improve its carry appeal, but the growth-dampening effect of tighter policy could cool the foreign direct investment inflows the currency also relies on. That tension is why the October meeting is the near-term catalyst that matters most for anyone tracking Indian bond and equity flows.
The counterintuitive case rests on carry appeal in Indian debt: Commerzbank and DBS Group Research both argue that a credible tightening pivot would deliver structural rupee support, because the inflation-driven hawkish repricing improves the yield differential at precisely the moment when foreign investors are weighing whether to re-enter Indian fixed income.
What the RBI’s intervention record reveals about the limits of defence
Give the RBI its due first. The scale of its recent defence is genuinely large. In late July 2026, bankers estimated the central bank sold roughly USD 8-9 billion in a single session across spot and non-deliverable forward markets as the rupee neared its record low around 96.96, according to Reuters. In early September 2026, Reuters cited estimates of USD 8-15 billion deployed over one week, briefly lifting the currency to a two-month high of 94.2850.
That is credible firepower, and it worked, for a while. The intervention is widely credited with capping USD/INR below its all-time high and smoothing day-to-day volatility.
The FCNR(B) deposit programme that mobilised USD 127.23 billion and pushed reserves to a record USD 729.33 billion closed its window on 30 September 2026, meaning no fresh programme inflows can top up the cushion from that point and the rupee defence shifts entirely to existing reserves against the same structural pressures the current article identifies.
Then look at where the pair sits now. Despite tens of billions in dollar sales, USD/INR is back around 95.93-96.00, drifting once more toward the record high near 97.00.
The core tension Analysts warn the RBI is buying time against structural headwinds rather than resolving the underlying pressures. Managing the pace of a decline is not the same as reversing its direction.
That distinction matters for anyone building medium-term assumptions. The intervention is real and effective in the short run, but it is working against an oil bill and a yield gap it cannot make disappear.
Three risks the market is not fully pricing into RBI support
Sustained intervention carries costs that build quietly beneath the headline stabilisation.
- Reserve depletion. Deploying USD 8-15 billion in a single week is sustainable for a while, not indefinitely. Each intervention draws down the reserves available to fight the next shock, and if global conditions worsen, the firepower left for a genuine crisis shrinks.
- Distorted hedging behaviour. When importers and corporates assume the RBI will always cap rupee weakness, they delay their currency hedges. That leaves a growing pool of unhedged exposure that can amplify moves sharply if the central bank ever steps back.
- Deferred adjustment. Temporary stabilisation can mask the true pressure on the currency, setting up a faster, larger correction whenever intervention is scaled down.
None of this questions the RBI’s credibility as a stabiliser. The issue is duration and cost: how long, and at what price, it can hold this role against the current macro configuration.
What could reverse the rupee’s slide before it tests the record high
A bearish structural case is not a one-way bet. Several identifiable triggers could interrupt the uptrend before USD/INR reaches 97.00, and each rests on the same data that built the bearish view. Ranked by near-term force:
- A drop in U.S. yields. This is the most powerful lever. The 10-year sits at 5.00-5.01%, and intraday reversals show buyers are already testing whether these levels hold. A sustained decline would simultaneously cool the dollar, widen the India-U.S. spread again, restore carry appeal in Indian debt, and ease imported inflation on the RBI’s plate.
- An oil price reversal. The roughly 15% crude pullback in late July 2026 helped drag the rupee off record-low territory. A sustained fall in Brent would cut India’s import bill and dollar demand directly, given the 0.28 rupee per dollar of Brent sensitivity.
- RBI escalation. The late-July and early-September operations, at USD 8-9 billion and USD 8-15 billion respectively, produced measurable if temporary reversals. Further coordinated intervention could cap the pair again.
- A positive Indian growth or CPI surprise. If inflation slips back below 4% or growth data strengthens without stoking prices, the case for aggressive RBI hikes and continued weakness softens.
- The October MPC as a carry catalyst. If Societe Generale’s projected 25 basis point hike is delivered, improved carry dynamics could lend the rupee near-term support.
The caveat that governs all five The technical target near 97.00 holds only while the macro drivers stay in place. Any one of these reversals could interrupt the trend without changing the medium-term structural picture.
The rupee’s next six months depend on two meetings and one oil move
Step back and the diagnostic resolves into a clear frame. The rupee’s path over the next six months turns on three variables established at the outset: U.S. yields, domestic inflation, and the structural drag from crude. The sequence and size of moves across these three, not random market noise, will set the trajectory.
Two October events form the first hard catalysts. The RBI MPC meeting is the first chance to deliver Societe Generale’s projected 25 basis point hike, and the U.S. CPI release will most directly shape whether the 10-year yield holds above 5% or retreats.
Oil is the wild card. At 0.28 rupee per dollar of Brent, a sustained USD 15-20 shift in crude would carry structural weight comparable to the yield spread compression itself.
Watch three signals in particular:
- The U.S. 10-year yield trajectory: the single most powerful driver of both the dollar and Indian carry appeal.
- The October and December RBI MPC outcomes: the test of whether the projected hiking cycle materialises against a 5.25% repo rate and a 5.1% inflation projection.
- Brent crude direction: the structural swing factor, with the 20-day EMA at 95.37 as the near-term support to watch if any reversal begins.
The read is neither freefall nor recovery. The rupee is in a managed, structurally pressured decline, and the pace of that decline will be set by a handful of nameable events with the all-time high near 97.00 as the technical destination if conditions persist.
This article is for informational purposes only and should not be considered financial advice. Investors should conduct their own research and consult with financial professionals before making investment decisions. Past performance does not guarantee future results, and financial projections are subject to market conditions and various risk factors. These statements are speculative and subject to change based on market developments.